Notice to Reader SMARTCENTRES REAL ESTATE INVESTMENT TRUST
|
|
|
- Denis Newton
- 6 years ago
- Views:
Transcription


1 Investor Presentation Based on Fourth Quarter 2017 February 2018
2 Notice to Reader Readers are cautioned that certain terms used in this Investor Presentation ( Presentation ) such as Funds from Operations ("FFO"), Adjusted Funds from Operations ("AFFO"), Adjusted Cashflow from Operations ("ACFO"), "Gross Book Value", "Payout Ratio", "Interest Coverage", "Total Debt to Adjusted EBITDA" and any related per Unit amounts used by management to measure, compare and explain the operating results and financial performance of the Trust do not have any standardized meaning prescribed under IFRS and, therefore, should not be construed as alternatives to net income or cash flow from operating activities calculated in accordance with IFRS. These terms are defined in this Presentation and reconciled to the consolidated financial information of the Trust in the Management s Discussion and Analysis ( MD&A ) for the year ended December 31, Such terms do not have a standardized meaning prescribed by IFRS and may not be comparable to similarly titled measures presented by other publicly traded entities. Certain statements in this Presentation are "forward-looking statements" that reflect management's expectations regarding the Trust's future growth, results of operations, performance and business prospects and opportunities. More specifically, certain statements contained in this Presentation, including statements related to the Trust's maintenance of productive capacity, estimated future development plans and costs, view of term mortgage renewals including rates and upfinancing amounts, timing of future payments of obligations, intentions to secure additional financing and potential financing sources, and vacancy and leasing assumptions, and statements that contain words such as "could", "should", "can", "anticipate", "expect", "believe", "will", "may" and similar expressions and statements relating to matters that are not historical facts, constitute "forward-looking statements". These forwardlooking statements are presented for the purpose of assisting the Trust's Unitholders and financial analysts in understanding the Trust's operating environment, and may not be appropriate for other purposes. Such forwardlooking statements reflect management's current beliefs and are based on information currently available to management. However, such forward-looking statements involve significant risks and uncertainties. A number of factors could cause actual results to differ materially from the results discussed in the forward-looking statements. Although the forward-looking statements contained in this Presentation are based on what management believes to be reasonable assumptions, the Trust cannot assure investors that actual results will be consistent with these forward-looking statements. The forward-looking statements contained herein are expressly qualified in their entirety by this cautionary statement. These forward-looking statements are made as at the date of this Presentation and the Trust assumes no obligation to update or revise them to reflect new events or circumstances unless otherwise required by applicable securities legislation. 2
3 SmartCentres Real Estate Investment Trust (TSX:SRU.UN) One of Canada s premier REITs $4.6 billion equity capitalization (unit price of $28.99 as of February 8, 2018) $9.4 billion total asset value 154 shopping centres, 1 office property and 1 mixed-use property across Canada 3
4 Track Record of Performance Total Return to Unitholders 9.5% average annual return since IPO (as of February 8, 2018) $1,200 $1,000 $ $800 $600 $400 $ $ $200 $0 SmartCentres TSX Capped REIT TSX Composite 4

5 Track Record of Performance Growth in Rental Revenue Growth in FFO / Unit 6.4% CAGR since % CAGR since 2013 Rental Revenue (in millions of $) FFO ($ per unit) * 2017 * YTD and remainder of year forecasted * Includes $0.06 per unit of non-operating income 5
 8,505 8,739 9,380")

6 Track Record of Performance Growth in Total Assets 34.6% CAGR since 2002 Total Assets (in millions of $) 8,505 8,739 9,380 5,956 6,480 7,070 7,107 3,584 3,894 4,194 4,237 4,374 2, ,
7 Key Investment Highlights The quality of our shopping centre portfolio Our exceptional list of growth initiatives Our healthy balance sheet and financial flexibility The quality and depth of our development team and JV relationships 7
8 SmartCentres Retail Shopping Centre Portfolio 34.2 million square feet of principally open format shopping centre space Average age: 14.0 years (youngest in the industry) Lower capital expenditures Coast to coast locations 84% are urban or near urban markets 88% by square feet in Ontario, Quebec and BC Virtually 100% of sites contain both a food store and a pharmacy, either in a Walmart store or independently Strong value orientation Results in high degree of stability: Average occupancy of 98.9% since
9 SmartCentres Portfolio 156 Properties* 34.2 million square feet* Alberta 8 Manitoba 3 BC 14 Saskatchewan 5 Ontario 94 Quebec 22 Atlantic 10 * Excludes 7 development lands totalling 0.7 million square feet upon completion and an additional 3.3 million square feet of development density associated with existing centres. 9
10 Market Conditions Why is Canada different from the United States Much lower square feet of retail per person (15 vs. 23) traditionally drives higher rents per square foot Power Centres and Big Box retail are only 20 years old in Canada, so assets are still very relevant to consumers daily shop Rate and stage of E-commerce penetration is much slower in Canada due to small market size, cost of shipping, etc. Canada has already rationalized its department store base Canadian value orientation means all population segments shop at Walmart, dollar stores and other value chains Affordability of housing continues to drive urban sprawl and growth of the suburbs where a number of our assets are located 10

11 Stable Income Base Average lease term of 5.8 years Average remaining lease term of 7.1 years for Walmart, with multiple renewal options of up to 80 years Average remaining lease term excluding Walmart is 4.9 years 2017 average retention rate was 73% Average same property NOI growth is 1.0% to 1.5% p.a. Lease Maturity by Area (in millions of square feet) Monthto-month Average roll of 2.3 million square feet annually (6.7% of total GLA per year) Vacant 11
12 Well Tenanted, High Quality Portfolio The following table illustrates the top ten tenants for SmartCentres Property Portfolio as at December 31, 2017, in terms of their percentage contribution to gross rental revenues of SmartCentres' Portfolio: Tenant Number of Stores % of Gross Rental Revenues Average Remaining Lease Term DBRS Credit Rating S&P Credit Rating Moody s Credit Rating Walmart AA AA Aa2 Canadian Tire, Mark's and FGL Sports BBB (high) BBB+ n/a Winners, HomeSense, Marshalls n/a A+ A2 Loblaws and Shoppers Drug Mart BBB BBB n/a Lowe's, RONA A (low) A- A3 Sobeys BB (high) BB+ n/a Reitmans n/a n/a n/a Best Buy n/a BBB- Baa1 Dollarama BBB n/a n/a Michaels n/a n/a Ba2 Total
13 Current Leasing Environment Former Target and Sears space and other smaller bankrupt retailers causing overhang in certain markets Fashion segment still rationalizing, but we have limited exposure Value segment still growing Dollar stores, Winners, Marshalls, HomeSense Other mid-size retailers also adding space Indigo, Michaels, Food stores, Pet stores Fitness category still adding space or expanding existing footprint Bars, restaurants, etc., part of lifestyle experience evolution 13
14 OneREIT Transaction Summary 12 Properties / $429 million 2.2 million square feet / 93% leased Ontario (10) / BC (1) / Saskatchewan (1) 10 Food-anchored / inclusive of 6 Walmarts NOI of $26 - $28 million (Year 1 to Year 2) FFO / Unit growth near $ $0.06 Average lease term of 7.3 years SmartCentres & Strathallen combined for $4.26 Unit Price to OneREIT (15% premium) 14
15 OneREIT Transaction In Effect Two Portfolios A. Stability 99.5% leased Walmart Supercentre anchored Very strong national tenants / covenants Coupon clipper B. Growth & Stability 90% leased Redevelopment opportunity for part / all of each property 100,000 square feet of future retail density 1.7 million square feet of future mixed-use (residential, retirement, office, storage, etc.) Business Units already in process of reviewing opportunity, zoning, permissions, uses, etc. 15
16 Highlights of the 12 Property Portfolio Property Creekside Crossing Chilliwack Mall Golden Mile Shopping Centre Kingspoint Shopping Centre Burnhamthorpe City Centre Yorkgate Shopping Centre Lincoln Value Centre Hartzel Plaza Orillia Shopping Centre Simcoe Shopping Centre Fergus Shopping Centre Rockland Shopping Centre City Province Mississauga ON Chilliwack BC Regina SK Brampton ON Mississauga ON Toronto ON St. Catharines ON St. Catharines ON Orillia ON Simcoe ON Fergus ON Rockland ON Acquired % GLA (sf) Leased % 30% 122,402 98% 100% 152,467 82% 100% 255,572 93% 100% 202,236 98% 100% 199,434 84% 100% 215,862 93% 100% 376,041 82% Major Tenants and Features Walmart, Costco, LCBO, Beer Store, RBC, TD, CIBC (New dominant urban retail centre) Safeway, Winners, Sport Chek (Strategic location: redevelopment) Loblaw Superstore (new 20 year lease), Dollarama, Liquor Store, GoodLife, Rexall (Newly redeveloped centre) Giant Tiger, GoodLife, Shoppers Drug Mart, (Urban, potential mixeduse residential) Government, Swiss Chalet, Remax (Redevelopment potential near Square One) No Frills (Loblaw), City of Toronto, Dollarama (New subway redevelopment potential) Walmart, Canadian Tire, Loblaw (Dominant three anchored centre, repositioning potential) 100% 67, % Food Basics, Provincial Government 100% 241, % 100% 129, % 100% 109, % 100% 147, % Walmart, Winners, Dollarama (WM only discount mass retailer in market) Walmart, LCBO (WM only discount mass retailer in the market) Walmart, LCBO (WM only discount mass retailer in the market) Walmart, Rona, LCBO (new Rona shadow and WM only discount mass retailer in the market) Total 2,219,945 93% 16
17 Future Growth Strategy Every one of our properties under consideration for development / intensification Multiple different joint venture relationships are being added to optimize chances of success In addition to existing land banks, we own over 2,600 acres of parking lots, of which over half are in the six major urban markets some will be developable over time Total financial expenditures on projects begun in the next five years expected to be between $7 $8 billion, of which our share is close to $3 billion 17
18 Development Categories Residential Senior Residences Retail Apartment Rentals Office Build out of existing Condominiums Self Storage Outlet Malls Townhouses Penguin Pick-Up 18
19 Technology Initiatives Charging Stations Mobile Advertising Digital Signs Technology Wifi Networks Building Systems Advertising Kiosks 19
20 Deal Structures SC s Development Team Joint Venture Partners Building Lease Ground Lease Sale of Surplus Land 20
21 Major Mixed-Use Real Estate Initiatives Site Project Type GLA ('000sf) / Units Estimated Costs ($M) SRU % Share 100% SRU Share NOI at 100% ($M) NOI at SRU Share ($M) Estimated Gain on Final Sale Completion Year Yield Profit % SRU Share Timing 1. VMC (Office Towers) (1) a. KPMG (T#1) b. PWC (T#2) c. Office (T#3) d. Office (T#4) Office Office Office Office 360sf 105sf 600sf 300sf 50% 50% 50% 50% $180.0 $65.0 $310.0 $175.0 $90.0 $32.5 $155.0 $87.5 $10.2 $3.0 $17.4 $9.6 $5.1 $1.5 $8.7 $ % 4.5%-5.5% 5.0%-6.0% 5.0%-6.0% Toronto Premium Outlets (2) Phase II (JV) Retail 144sf 50% $133.0 $66.5 $10.9 $5.4 Nov %-8.5% Montreal Premium Outlets (2) Phase II (JV) Retail 140sf 50% $56.0 $28.0 $5.6 $ %-10% New Premium Outlets Premium (JV) Retail 360sf 50% $136.0 $68.0 $11.7 $ %-8.5% Laval Centre (4) Jadco (2 Bldgs) Apartments 338 Units 50% $76.5 $38.3 $4.3 $ % VMC (Condos) (4) CentreCourt CentreCourt CentreCourt Condo Condo #1 Condo #2 Condo #3 Condo #4 & Units 559 Units 606 Units 1,100 Units 25% 25% 25% 25% $181 $189 $190 $380 $45.25 $47.25 $47.5 $95.0 N/A N/A N/A N/A N/A N/A N/A N/A N/A N/A N/A N/A 25%-30% 25%-30% 20%-25% 20%-25% 25% 25% 25% 25% Vaughan NW Fieldgate Townhomes 229 Units 50% $152.0 $76.0 N/A N/A N/A 20%-25% 50% Ottawa Laurentian (4) JV Partner (2 Bldgs) Apartments 300 Units 25% $86.0 $21.5 $4.9 $ %-6.5% Multiple Locations (4) Self Storage (JV) Self Storage (4 to 5 new facilities each year) 500sf built per year in each of years % $52M per year in each of years 1-5 $26M per year in each of years 1-5 $4.8M net new NOI commences annually on stabilization (3) $2.4M net new NOI commences annually on stabilization (3) %-8.5% StudioCentre (Toronto) SRU-Penguin JV Mixed-Use (Office, Studio, Hotel) 150sf 50% $53.0 $26.5 $3.4 $ %-7.0% VMC (Apartments) (4) VMC Rental Apartments Apartments 221 Units 25% $113.6 $28.4 $5.6 $ % Pointe-Claire (Apartments) (4) Rental Apartments (2 Bldgs) Apartments 486 Units 50% $154.8 $77.4 $7.2 $ %
22 Major Mixed-Use Real Estate Initiatives Site Project Type GLA ('000sf) / Units Estimated Costs ($M) SRU % Share 100% SRU Share NOI at 100% ($M) NOI at SRU Share ($M) Estimated Gain on Final Sale Completion Year Yield Profit % SRU Share Timing 13. Pointe-Claire (Condo) (4) Condo Condo 194 Units 50% $54.8 $27.4 N/A N/A 2020 N/A 10%-15% 50% Multiple Locations (4) Retirement Homes (JV) Retirement Homes (3 to 5 new facilities each year) 600sf built per year in each of years % $70M per year per site in each of years 1-5 $35M per year per site in each of years 1-5 $4.2M-$5.6M net new NOI commences annually on stabilization (3) $2.1M-$2.8M net new NOI commences annually on stabilization (3) %-8.0% Notes: (1) KPMG and PwC-YMCA towers are included in the future development pipeline as Developments. (2) The Phase II expansions for both the Toronto Premium Outlets and the Montreal Premium Outlets are included in the future development pipeline as Developments. (3) Stabilization is estimated to be 2 to 3 years after completion. (4) Estimated Transactional FFO Gains on Sale related to parcel sales of land into Joint Ventures estimated at 1%-2% of annual FFO at SmartCentres' ownership share. In addition to the projects set out in the table above (with the exception of the projects listed in Notes 1 and 2), SmartCentres' pipeline also includes approximately 4.0 million square feet of future developments as set out in the table shown on the Future Earnouts and Developments section. Also in addition to the above, SmartCentres has a further mixed-use development pipeline estimated at 4 million square feet in projects that are underway or active. Further, SmartCentres will initiate activities in the short-term to work towards development of a further estimated 12.5 million to 15 million square feet in mixed-use initiatives that will be completed in the longer-term. 22
23 Development Initiatives Non Retail Initiatives 17 Underway 50 Active 59+ Future Retail Developments 25 Underway 36 Active 2+ Future 23


24 Residential Development Initiatives Apartment Rentals Underway 1 Active 10 Future 18+ Condominiums Underway 5 Active 9 Future 12+ Townhouses Underway 1 Active 5 Future 4+ 24


25 Development Initiatives Self-Storage Underway 8 Active 14 Future 7+ Office Underway 1 Active 3 Seniors Residences Underway 1 Active 9 Future


26 Retail Development Build-out of existing Underway 23 Active 34 Outlet Malls Existing 2 Expansions 2 Future 2 26
27 SmartCentres Retail Intensification Multiple sites under investigation for intensification. Currently 50+ sites have identified projects Majority of initial sites in the Greater Toronto Area Collaborate with JV partners who bring expertise Can be both new builds or retrofit in existing buildings 27
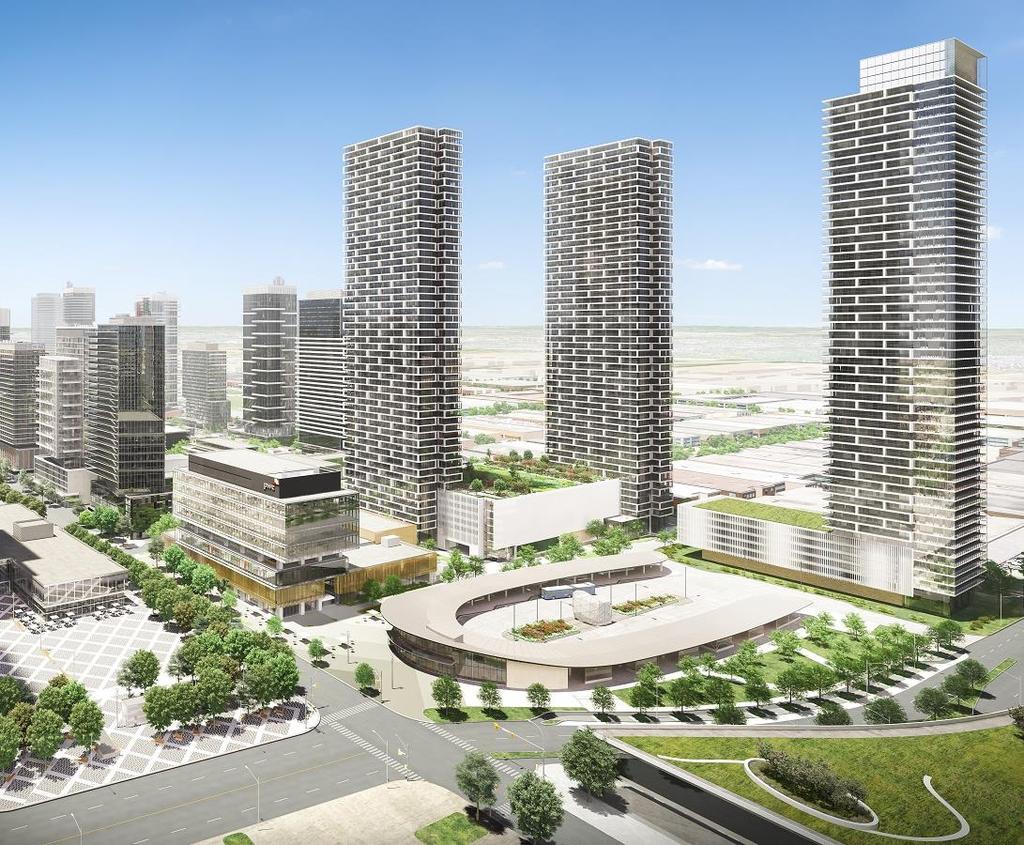
28 Vaughan Metropolitan Centre ( VMC ) A long term build (10 15 years) A 50:50 JV between SmartCentres and Penguin Investments. Mitchell Goldhar intimately involved in all aspects of the project Potential density of million square feet of residential, office and retail development for the whole 100-acre site SmartCentres lands (approximately 25 acres) represent million square feet of potential development Transit infrastructure, including TTC subway and VIVA bus opened in December 2017, and York regional bus station to open in Q Exceptional opportunity to develop a new city centre for one of Canada s fastest growing communities 28

29 VMC Aerial Aerial Overview 29

30 VMC Aerial Transit Overview 30
31 VMC Phases 1 & 2 of Office Development First development completed KPMG Tower complex with 365,000 square feet of LEED Gold space, opened in th Annual Real Estate Excellence (REX) Award for Office Development of the Year for the GTA Office tenants include KPMG, Green for Life, Miller Thompson, Harley Davidson, BMO, FM Global Second mixed-use tower under construction, with YMCA, Library and community space for 100,000 SF and PwC has taken another 80,000 square feet of office space Nine-acre urban park is a key component of the master plan 31

32 VMC KPMG Tower Lobby 32

33 VMC Transit City Condos 33

34 VMC PwC-YMCA Tower 34

35 SmartCentres VMC Central Park 35
36 VMC Residential Development First residential development is a JV with CentreCourt Developments, an experienced GTA-based condominium developer Initial plan was for a 55 storey condominium tower with over 500 suites, anchored by a BUCA-branded restaurant and BAR BUCA, together with an associated parking facility First tower fully sold at higher than initially projected pricing, so second and third towers launched early, which also sold out at strong pricing Additional condominium and rental towers expected to be developed based on consumer demand Sales centre has been built on-site to allow potential tenants to see suite layouts, finishes, etc. 36
")

 KPMG Tower at VMC (3)")

37 VMC Major Construction Projects in Vicinity (2) (1) (3) (1) Liberty office and residential development at Weston Road and Hwy 7 (2) KPMG Tower at VMC (3) Cortellucci residential development at Jane Street and Hwy 7 37
38 Vaughan NW Residential Development Existing Walmart anchored shopping centre at Major Mackenzie Drive and Weston Road in Vaughan JV with Fieldgate on 16-acre site Up to 230 freehold townhomes to be built Construction to commence in late 2018 and possession to occur in early 2020 and into 2021 Significant financial benefit for SmartCentres unitholders 38

39 Vaughan NW Residential Development 39

40 Laval Centre Lands designated by City as Centre-Ville, due to highway and transit access 43 acre site anchored by a 160,000 square foot Walmart Supercentre Parcels of land under contract for seniors housing, hotel and office development of 400,000 square feet JV for 290,000 square feet of rental residential in 330 units with Jadco Remaining 15 acres to be developed 40

41 Laval Centre with Jadco 338 units in the two buildings along with central services 41
42 Pointe-Claire, Montreal Walmart and Home Depot anchored site in West Montreal purchased in 2016 Very well-located site in terms of transit and road access Extensive work has identified new opportunity to add 1 2 million square feet of mixed-use development on the perimeter of the property Master planning activities moving forward with strong support from council First condominium building expected to be completed in


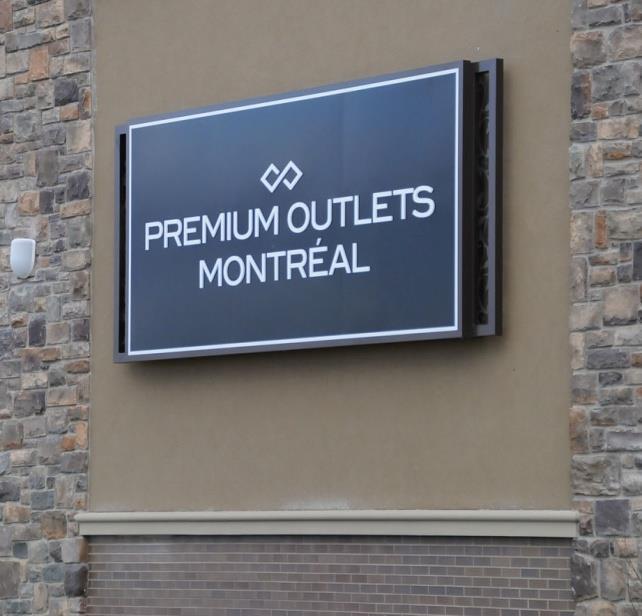
43 Pointe-Claire Existing Conditions FUTURE REM STATION 43

44 Pointe-Claire Perspective from St-Jean Boul & Hymus Boul 44
45 Westside Mall Toronto Inner urban redevelopment site. Currently an approximate 140,000 square foot shopping centre New Light Rapit Transit (LRT) station as part of Eglinton Cross Town system to open on site New links to existing GO network will link new East:West to existing North:South transit framework Received council support for rezoning up to 2.5 million square feet Long-term project to add principally new residential development, with select retail 45

46 Westside Mall Toronto 46


47 StudioCentre StudioCentre is a brownfield location next to Toronto s eastern waterfront. A former industrial site, today it is an underutilized film production centre SmartCentres and Penguin Investments intend to revitalize the centre, adding new film production, office, and retail opportunities Rezoning has created the opportunity to build up to 1.2 million square feet of office, retail and film studios at the centre New music / video studio to open onsite in Spring

48 StudioCentre Architect s rendering of potential new site layout 48
49 Self Storage Identified business opportunity to build self storage properties based on market demand with established JV partner Buildings on average 100,000 square feet to 130,000 square feet Development yield expected to be 7.5% to 8.5% Additional returns from sale of land into the JV 5 sites now identified in the GTA with more to follow Additional parts of the country to be developed over time 49

50 Self Storage with SmartStop 50
51 Retirement Homes Joint venture with Revera, one of Canada s largest operators in the senior living sector Sites already identified in the GTA Once the pipeline is fully established, expect to complete 5 projects per year Typical building size is 140,000 square feet, with investment including land of up to $70 million per site Yields in the 6.0% - 8.0% range on cost 51

52 Retirement Homes with Revera 52
53 Premium Outlets Toronto Premium Outlets JV with Simon Property Group 500,000 square feet when all phases are completed Phase I opened August 1, 2013 Phase II construction Underway with new parking facility as part of expansion Stabilized yield continues to be in the double digits Montreal Premium Outlets JV with Simon Property Group Phase I 350,000 square feet Opened October 30, 2014 Additional 75 acres of potential retail development adjacent to the site Actively sourcing two other locations in Canada 53


54 Premium Outlets 54
")
55 Toronto Premium Outlets ( TPO ) Expansion 55

56 TPO Expansion New Parking Deck 56
57 Key Investment Highlights Our Balance Sheet Will Support Extensive Asset Growth Unencumbered pool at $3.4 billion = flexibility Ready access to mortgage and unsecured debt capital when needed = strong liquidity Payout ratio at 82.8% at Q Higher than latest long term target of 77% to 82% due to higher retail capex and RealPac guideline on treatment of recoverable capex Renewing interest rates still lower than maturing rates despite rate increases improves FFO 57
58 Debt Maturity / Leverage (including OneREIT transaction) 436 Debt Maturity (in millions of $) THEREAFTER Secured Debt Debentures Lower interest costs on refinancing available with 10 year unsecured rates around 4.3% and secured rates below that Interest Coverage: 3.1X Target: 2.5X 3.0X Debt to EBITDA: 8.4X Target: 8.0X - 8.5X Debt to GBV: 52.3% Target: 50% - 60% long-term trend to continue to de-lever Unencumbered pool: $3.4 billion (1.8X) Target: 1.5X unsecured coverage Weighted Avg Interest Rate (Secured Debt): 3.87% Weighted Avg Term to Maturity (Secured Debt): 4.6 yrs DBRS rating of BBB with a Stable trend 58
59 Leverage Profile Dec Dec Dec Dec Debt to Aggregate Assets 45.4% 44.3% 44.7% (1) 42.8% Secured Debt to Aggregate Assets 26.1% 29.5% 31.2% (2) 24.7% Unencumbered Assets $3.4B $2.7B $2.5B $2.4B Debt to Adjusted EBITDA 8.4X 8.4X 8.4X (1) 7.4X Interest Coverage 3.1X 3.1X 3.0X 2.7X Liquidity: Cash Resources $646M $355M $345M $324M Weighted Average Interest Rate (3) 3.87% 3.79% 3.87% 5.03% Weighted Average Term to Maturity (3) 4.6 yrs 4.8 yrs 5.4 yrs 5.3 yrs (1) Leverage increased during 2015 in support of the transformative Penguin Investments Platform transaction (2) Significant rate spread between unsecured and secured debt led management to increase secured debt financing during 2015 (3) Secured Debt 59
60 Conservative Capital Structure Total Enterprise Value $8.7 Billion 27.0% 20.3% 0.4% 51.7% 0.6% Secured Mortgage Financing Amount - $2.4 billion Weighted Avg Interest Rate 3.87% Weighted Avg Term to Maturity 4.6 years Unsecured Debentures Amount - $1.81 billion Weighted Avg Interest Rate 3.42% Weighted Avg Term to Maturity 5.8 years Convertible Debentures Amount - $37 million Weighted Avg Interest Rate 5.50% Weighted Avg Term to Maturity 2.5 years Equity Units Outstanding 160 million Share Price $28.99 as at Feb. 8, 2018 Market Capitalization $4.6 billion Operating Lines / Outstanding LC s Operating Line $nil Letters of Credit $55 million Focused on: Lowering interest rates on renewals Maintaining maximum flexibility Reducing leverage over time Rebalancing unsecured and secured debt ratios 60


61 Stable Cash Flow AFFO Payout Ratio 90.3% 88.6% 84.7% 81.1% 79.8% 82.8% ($ per unit) FFO * 2.20 AFFO * 2.07 Distributions * includes $9.9 million settlement proceeds associated with the Target lease terminations net of other amounts Distribution fully funded from operating cashflow Management expects the payout ratio to remain in the high 70% to low 80% range Annual distribution increased in October 2016 to $1.70 from $1.65, representing an increase of 3.0%, and further increased in October 2017 to $1.75, representing an additional 2.9% increase 61
62 Ability to Execute Strong, Experienced In-House Development Team Partner Relationships Government/Consultant Relationships 62
63 In-House Development Experience Employees in Development & Leasing Related Functions: # of People 145 # of Years Experience with SmartCentres Average Total 7.5 years 1,088 years # of Years Experience in Real Estate Average Total 15.0 years 2,175 years 63
64 In-House Development Skills Planners / Developers Engineers Government Relations Environmental / Geotech Specialists Leasing Construction Architects Lawyers Finance / Financial Analysts 64
65 Other Issues We Are Monitoring In the coming years, retailers businesses will be affected by: E-commerce Aging population Urbanization and the move to more convenient shopping Changing ethnic mix of population We will continue to monitor the impact of these issues and will adjust our business model accordingly, always remembering: The quality of our sites The value we provide our tenants The strength and capabilities of our partners 65
 SmartCentre")
66 E-commerce Response Penguin Pick-Up Penguin Pick-Up located at Scarborough (1900 Eglinton) SmartCentre 66
67 E-commerce Responses Penguin Pick-Up: Initiative driven by Penguin Investments Convenient locations for consumers to pick up products ordered online Drives traffic to shopping centres and supports tenants 11 SmartCentres locations in place for the initiative at year-end, along with 76 external sites in multiple provinces. The target is double the number of sites by year-end 2018 Over 2,500 different retailers supported so far A network of Tesla charging stations on SmartCentre sites being built Launching digital signage at select locations 67
68 The Best Offense Starts With a Strong Defense - SmartCentres Best-in-Class Portfolio Newest retail portfolio amongst all Canadian peers. 84% located in urban or near urban locations, with strong national tenants as anchors Strong Financial Position Strong balance sheet and strong credit metrics. Growing unencumbered pool provides increased financial flexibility. Access to multiple sources of capital Pipeline of new development opportunities growing every quarter Extensive portfolio of growth opportunities from smaller local intensification to Vaughan Metropolitan Centre, Canada s largest mixed use development 68
69 Appendix 69
70 Strategic Relationships Walmart Mitchell Goldhar Simon Property Group CentreCourt Developments Jadco Corporation SmartStop Asset Management Revera Inc. 70
71 Strategic Relationship - Walmart Canada Walmart Canada attributes Number of Walmart Stores (1) Value pricing and fresh food generates huge traffic Other Dominant retailer Shadow SmartREIT Will benefit from the closure of Target and Sears 96 Supercentres (331)* 101 Total Walmart Stores (410)* 76% of Canadians live within 10 km of a Walmart (1) Includes OneREIT transaction * Company source as at February 8,
72 Strategic Relationship - Mitchell Goldhar JV Partner Vaughan Metropolitan Centre StudioCentre Site Salmon Arm Consultant on mixed use projects Board Chair, Trustee and Investment Committee member Ad hoc advice and council on shopping centre portfolio Multiple on-going business relationships as service provider 72
73 Strategic Relationship - Simon Property Group Largest public real estate company in the U.S. Engaged primarily in retail real estate properties including regional malls, Premium Outlets and The Mills Exceptional relationships with the world s largest retailers provides strong tenant base for premium sites Canada is part of a continuing global expansion 73
74 Strategic Relationship CentreCourt Developments Leader in the development of high-rise condominiums in downtown Toronto Since 2011, CentreCourt has completed and/or is in various stages of developing over 3,000 condominium units in six major high-rise projects with a development value of over $1.2 billion 74
75 Strategic Relationship Jadco Corporation Well reputed family-owned business Has gained a strong foothold in the real estate sector in the Greater Montreal Area Strengths lie in its commitment to excellence in building exceptional living and mixed-used environments Diversified portfolio comprised of luxury residential, upscale rental and mixed-used projects such as Paton1, Quintessence and Équinoxe 75
76 Strategic Relationship SmartStop Asset Management Diversified real estate company focused on self storage assets, along with student and senior housing Portfolio currently includes 65,000 self storage units, 7.5 million rentable square feet and $1 billion of real estate assets under management Asset manager for 103 self storage facilities located throughout the United States and Toronto, Canada 76
77 Strategic Relationship Revera Inc. Leading owner, operator and investor in the senior living sector Through various partnerships own over 500 properties in Canada, the United States, and the United Kingdom serving over 55,000 seniors Offering seniors apartments, independent living, assisted living, memory care and long term care. Joint venture with SmartCentres and Penguin Investments to develop properties in Canada, with initial focus in the GTA 77
SMARTCENTRES REIT ANNUAL GENERAL MEETING Smart Today Smart Tomorrow. May 16, 2018
 REIT Smart Today Smart Tomorrow May 16, 2018 FORWARD LOOKING STATEMENTS SmartCentres wishes to remind all participants at this meeting that the presentations which follow contain certain forward-looking
Notice to Reader SMART REAL ESTATE INVESTMENT TRUST
 Investor Presentation Based on First Quarter 2017 June 2017 Notice to Reader Readers are cautioned that certain terms used in this Investor Presentation ( Presentation ) such as Funds from Operations ("FFO"),
SmartREIT to Acquire $429 Million Portfolio
 SmartREIT to Acquire $429 Million Portfolio Toronto, Ontario (August 4, 2017) Smart Real Estate Investment Trust ( SmartREIT ) (TSX:SRU.UN) announced today that it will acquire a portfolio of 12 properties
SMART REAL ESTATE INVESTMENT TRUST RELEASES SECOND QUARTER RESULTS FOR 2017 AND ANNOUNCES DISTRIBUTION INCREASE
 SMART REAL ESTATE INVESTMENT TRUST RELEASES SECOND QUARTER RESULTS FOR 2017 AND ANNOUNCES DISTRIBUTION INCREASE TORONTO, ONTARIO - (August 9, 2017) Smart Real Estate Investment Trust ("SmartREIT" or "the
SMARTCENTRES REAL ESTATE INVESTMENT TRUST RELEASES SECOND QUARTER RESULTS FOR 2018 AND ANNOUNCES DISTRIBUTION INCREASE
 SMARTCENTRES REAL ESTATE INVESTMENT TRUST RELEASES SECOND QUARTER RESULTS FOR 2018 AND ANNOUNCES DISTRIBUTION INCREASE TORONTO, ONTARIO - (August 9, 2018) SmartCentres Real Estate Investment Trust ("SmartCentres"
Investor Presentation. First Quarter 2015
 Investor Presentation First Quarter 2015 1 CAUTIONARY STATEMENTS Today s session and our answers to questions contain statements that constitute forward-looking statements about expected future events
SMARTCENTRES REIT 1 ST QUARTER. Supplemental Information Package FOR THE THREE MONTHS ENDED MARCH 31, 2018
 SMARTCENTRES REIT smart today smart tomorrow 1 ST QUARTER Supplemental Information Package FOR THE THREE MONTHS ENDED MARCH 31, 2018 TABLE OF CONTENTS Notice to Reader...... 2 Conference Call Highlights....
FOR IMMEDIATE RELEASE AUGUST 2, 2018 ARTIS REAL ESTATE INVESTMENT TRUST RELEASES SECOND QUARTER RESULTS
 FOR IMMEDIATE RELEASE AUGUST 2, 2018 ARTIS REAL ESTATE INVESTMENT TRUST RELEASES SECOND QUARTER RESULTS Today Artis Real Estate Investment Trust ( Artis or the "REIT") issued its financial results and
Quarterly dividend per common share
 Corporate Profile First Capital Realty (TSX: FCR) is one of Canada s largest owners, developers and managers of grocery anchored, retailfocused urban properties where people live and shop for everyday
THIRDQUARTER. Supplemental Information Package. FOR THE THREE and NINE MONTHS ENDED SEPTEMBER 30, 2017
 THIRDQUARTER Supplemental Information Package FOR THE THREE and NINE MONTHS ENDED SEPTEMBER 30, 2017 Table of Contents Notice to Reader.... 2 Conference Call Highlights..... 3 Looking Beyond... 7 Portfolio
CHOICE PROPERTIES REAL ESTATE INVESTMENT TRUST. Management s Discussion and Analysis of Financial Condition and Results of Operations
 CHOICE PROPERTIES REAL ESTATE INVESTMENT TRUST Management s Discussion and Analysis of Financial Condition and Results of Operations (in thousands of Canadian dollars except where otherwise indicated)
Artis Real Estate Investment Trust
 Artis Real Estate Investment Trust Debt Investor Presentation Q2 2016 PROPERTIES OF SUCCESS 1 FORWARD-LOOKING STATEMENTS This presentation may contain forward-looking statements. For this purpose, any
Investor Presentation Second Quarter 2006
 Investor Presentation Second Quarter 2006 2006 Highlights (Six months to June 30, 2006) Revenues up 10.2% from accretive acquisitions Net Operating Income up 10.9% NOI margin increases Stabilized portfolio
Q Conference Call Presentation. October 31, 2018
 Q3 2018 Conference Call Presentation October 31, 2018 FORWARD LOOKING ADVISORY In talking about our financial and operating performance and in responding to your questions we may make forward-looking statements
FOURTH QUARTER RESULTS 2015
 FOURTH QUARTER RESULTS Q4 MANAGEMENT S DISCUSSION AND ANALYSIS AND CONSOLIDATED FINANCIAL STATEMENTS MANAGEMENT S DISCUSSION AND ANALYSIS DECEMBER 31, PART I BASIS OF PRESENTATION Financial data included
Management Investor Presentation. Third Quarter 2017 November 13, 2017
 Management Investor Presentation Third Quarter 2017 November 13, 2017 Who we are RioCan is Canada s largest real estate investment trust. We own, manage and develop retail-focused, increasingly mixed-use
Management Investor Presentation. Year-end 2016 March 17, 2017
 Management Investor Presentation Year-end 2016 March 17, 2017 NON-GAAP MEASURES RioCan s consolidated financial statements are prepared in accordance with IFRS. Consistent with RioCan s management framework,
COMINAR ANNOUNCES 2018 SECOND QUARTER RESULTS AND HIGHLIGHTS
 PRESS RELEASE For Immediate Release COMINAR ANNOUNCES 2018 SECOND QUARTER RESULTS AND HIGHLIGHTS Québec City, Quebec, August 9, 2018 Cominar Real Estate Investment Trust ( Cominar or the REIT ) (TSX: CUF.UN)
PRIMARIS RETAIL REIT Announces Third Quarter Results
 PRIMARIS RETAIL REIT Announces Third Quarter Results Toronto (Ontario) November 8, 2011 Primaris Retail REIT (TSX:PMZ.UN) is pleased to report positive operating results for the third quarter of 2011.
The Property. The Market
 PRIMARIS RETAIL REIT Announces Significant Investment Toronto (Ontario), July 15, 2010 - Primaris Retail REIT (TSX:PMZ.UN) announced today that it has agreed to purchase Cataraqui Town Centre, an enclosed
2017 ANNUAL REPORT SMART TODAY SMART TOMORROW
 2017 ANNUAL REPORT SMART TODAY SMART TOMORROW A DYNAMIC REAL ESTATE PORTFOLIO, MULTIPLE INTENSIFICATION OPPORTUNITIES AND MEASURED GROWTH HAVE CONTRIBUTED TO MAKING SMARTCENTRES ONE OF THE LARGEST PUBLIC
DREAM GLOBAL ANNOUNCES FOURTH QUARTER RESULTS, 24% ANNUAL NET ASSET VALUE GROWTH AND OVER 6% FOURTH QUARTER COMPARATIVE NOI GROWTH
 DREAM GLOBAL ANNOUNCES FOURTH QUARTER RESULTS, 24% ANNUAL NET ASSET VALUE GROWTH AND OVER 6% FOURTH QUARTER COMPARATIVE NOI GROWTH TORONTO, FEBRUARY 20, 2019 DREAM GLOBAL REIT (TSX:DRG.UN, FRA:DRG) (or
PROPERTIES OF SUCCESS. May 14, Annual and Special Unitholders Meeting
 1 PROPERTIES OF SUCCESS May 14, 2010 2009 Annual and Special Unitholders Meeting FORWARD-LOOKING DISCLAIMER Certain information included in this presentation contains forward-looking statements within
Management Investor Presentation. First Quarter 2017 June 15, 2017
 Management Investor Presentation First Quarter 2017 June 15, 2017 NON-GAAP MEASURES RioCan s consolidated financial statements are prepared in accordance with IFRS. Consistent with RioCan s management
FIRST CAPITAL REALTY ANNOUNCES NEW INVESTMENTS IN CORE URBAN MARKETS AND $200 MILLION BOUGHT DEAL EQUITY OFFERING
 FIRST CAPITAL REALTY ANNOUNCES NEW INVESTMENTS IN CORE URBAN MARKETS AND $200 MILLION BOUGHT DEAL EQUITY OFFERING NOT FOR DISTRIBUTION IN THE UNITED STATES OR OVER UNITED STATES WIRE SERVICES Toronto,
Cominar Real Estate Investment Trust Quarterly Presentation
 Cominar Real Estate Investment Trust Quarterly Presentation Quarter Ended September 30, 2018 Conference Call November 9, 2018 Forward-looking statements P 2 This presentation may contain forward-looking
RELIABLE. DURABLE. GROWING. March 2017 Equity Investors
 RELIABLE. DURABLE. GROWING. March 2017 Equity Investors CAUTIONARY STATEMENTS This presentation contains forward-looking statements that involve a number of risks and uncertainties, including statements
RIOCAN HBC JOINT VENTURE PRESENTATION February 25, 2015
 RIOCAN HBC JOINT VENTURE PRESENTATION February 25, 2015 Forward Looking Statements Certain information included in this presentation contains forward-looking statements within the meaning of applicable
ANNUAL GENERAL MEETING. May 29, 2018
 ANNUAL GENERAL MEETING May 29, 2018 NON-GAAP MEASURES RioCan s consolidated financial statements are prepared in accordance with IFRS. Consistent with RioCan s management framework, management uses certain
PROREIT COMPLETES COMPASS COMMERCIAL REALTY ACQUISITION AND $31.7 MILLION IN PROPERTY ACQUISITIONS IN WINNIPEG AND DRUMMONDVILLE
 PROREIT COMPLETES COMPASS COMMERCIAL REALTY ACQUISITION AND $31.7 MILLION IN PROPERTY ACQUISITIONS IN WINNIPEG AND DRUMMONDVILLE NOT FOR DISSEMINATION IN THE UNITED STATES OR DISTRIBUTION THROUGH UNITED
2018 Annual General Meeting
 2018 Annual General Meeting 2 SPENCER ENRIGHT Director and Chairman of the Board of Directors 3 PHILIP SOPER President and Chief Executive Officer 4 GLEN MCMILLAN Chief Financial Officer 5 BOARD OF DIRECTORS
FORWARD-LOOKING STATEMENTS
 0 Q1 2017 Investor Presentatio n FORWARD-LOOKING STATEMENTS This presentation contains forward-looking information and other forward-looking statements. Words such as continue, momentum, expected, forecast,
PURE INDUSTRIAL REAL ESTATE TRUST ANNOUNCES CLOSING OF PREVIOUSLY ANNOUNCED ACQUISITIONS AND OTHER INVESTMENT ACTIVITIES
 ANNOUNCES CLOSING OF PREVIOUSLY ANNOUNCED ACQUISITIONS AND OTHER INVESTMENT ACTIVITIES Vancouver, BC August 21, 2017: Pure Industrial Real Estate Trust (TSX: AAR.UN) (the Trust ) announced today the following
Across Canada, Northview s passion is providing our customers with a place to call home. Creating Value for Unitholders
 Across Canada, Northview s passion is providing our customers with a place to call home Creating Value for Unitholders Third Quarter 2017 Conference Call November 8, 2017 Disclaimer This presentation may
White Paper on Adjusted Cashflow From Operations (ACFO) for IFRS. February, 2018
 for IFRS. February, 2018") White Paper on Adjusted Cashflow From Operations (ACFO) for IFRS February, 2018 Copyright REALPAC is the owner of all copyright in this publication. All rights reserved. No part of this document may be
White Paper on Adjusted Cashflow From Operations (ACFO) for IFRS February, 2018 Copyright REALPAC is the owner of all copyright in this publication. All rights reserved. No part of this document may be
Consolidating Canada s Automotive Dealership Properties 2018 SECOND QUARTER REPORT
 Consolidating Canada s Automotive Dealership Properties 2018 SECOND QUARTER REPORT Automotive Properties Real Estate Investment Trust Management s Discussion and Analysis June 30, 2018 Table of Contents
Management Presentation June 8, 2011
 Management Presentation June 8, 2011 Forward Looking Statements 2 Certain information included in this presentation contains forwardlooking statements within the meaning of applicable securities laws including,
PRIMARIS RETAIL REIT Announces Significant Investment The Properties
 PRIMARIS RETAIL REIT Announces Significant Investment Toronto (Ontario), November 24, 2009 - Primaris Retail REIT (TSX:PMZ.UN) announced today that it has unconditionally agreed to purchase two retail
May 10, 2016 Halifax, Nova Scotia KILLAM APARTMENT REIT ANNOUNCES 20% INCREASE IN FFO PER UNIT IN Q1 2016
 May 10, 2016 Halifax, Nova Scotia KILLAM APARTMENT REIT ANNOUNCES 20% INCREASE IN FFO PER UNIT IN Q1 2016 Killam Apartment REIT (TSX: KMP.UN) ("Killam") is pleased to report its Q1 2016 results, including
Macquarie Mexican REIT
 Macquarie Mexican REIT Fourth Quarter 2012 Results Presentation February 26, 2013 4Q12 Results Agenda 1. Overview Nick O Neil 2. Highlights & Portfolio Performance Jaime Lara 3. Financials Jaime Lara 2
INVESTOR DAY 2018 PROPERTY TOUR. April 18, 2018
 INVESTOR DAY 2018 PROPERTY TOUR April 18, 2018 VALUE PROPOSITION AND FOUR STRATEGIC PILLARS REAL VISION, SOLID GROUND CANADA S MAJOR MARKET PORTFOLIO High quality, necessity based retail, and increasingly
Definitions. CPI is a lease in which base rent is adjusted based on changes in a consumer price index.
 Annualized Rental Income is rental revenue under our leases on Operating Properties on a straight-line basis, which includes the effect of rent escalations and any tenant concessions, such as free rent,
TRANSFORMING. RIOCAN INVESTOR PRESENTATION Second Quarter 2013 August 27, 2013
 TRANSFORMING RIOCAN INVESTOR PRESENTATION Second Quarter 2013 August 27, 2013 Forward Looking Statements Certain information included in this presentation contains forward-looking statements within the
Our Objectives. Our Strategy
 2005 Third Quarter Report» Management s Discussion and Analysis Management s Discussion and Analysis This Management s Discussion and Analysis has been dated as at November 3, 2005. All dollar amounts
SUNTEC REIT FINANCIAL RESULTS. For the 2 nd Quarter and Half Year ended 30 June 2017
 SUNTEC REIT FINANCIAL RESULTS For the 2 nd Quarter and Half Year ended 30 June 2017 26 July 2017 Agenda 03 2Q 17 Highlights 05 Financial Highlights 18 Office Portfolio Performance 25 Retail Portfolio Performance
RIOCAN INVESTOR PRESENTATION Third Quarter 2014 November 27, 2014
 RIOCAN INVESTOR PRESENTATION Third Quarter 2014 November 27, 2014 Forward Looking Statements Certain information included in this presentation contains forward-looking statements within the meaning of
SITE CENTERS NOVEMBER 2018
 SITE CENTERS NOVEMBER 2018 JOINT VENTURE WITH CHINESE INSTITUTIONAL INVESTORS $607MM JOINT VENTURE ALLOWS SITE CENTERS TO ACCELERATE OPPORTUNISTIC INVESTING AND FURTHER IMPROVE THE BALANCE SHEET Dividend
MANAGEMENT PRESENTATION. November 7, 2017
 MANAGEMENT PRESENTATION November 7, 2017 DISCLAIMER This presentation includes time-sensitive information that may be accurate only as of today s date, November 7, 2017. Estimates of future net income
FIRST INDUSTRIAL REALTY TRUST REPORTS FIRST QUARTER 2018 RESULTS
 First Industrial Realty Trust, Inc. 311 South Wacker Drive Suite 3900 Chicago, IL 60606 312/344-4300 FAX: 312/922-9851 MEDIA RELEASE FIRST INDUSTRIAL REALTY TRUST REPORTS FIRST QUARTER 2018 RESULTS Occupancy
NOT FOR DISSEMINATION IN THE UNITED STATES OR DISTRIBUTION THROUGH UNITED STATES NEWS OR WIRE SERVICES.
 PROREIT ANNOUNCES $45.1 MILLION IN PROPERTY ACQUISITIONS AND THE INTENTION TO INTERNALIZE PROPERTY MANAGEMENT THROUGH STRATEGIC PURCHASE OF A PROPERTY MANAGEMENT FIRM NOT FOR DISSEMINATION IN THE UNITED
FOR IMMEDIATE RELEASE
 FOR IMMEDIATE RELEASE American Finance Trust Announces Second Quarter Operating Results New York, August 9, - American Finance Trust, Inc. (Nasdaq: AFIN) ( AFIN or the Company ), a real estate investment
North America s Largest Owner & Operator of Neighborhood & Community Shopping Centers. Retail Investor Presentation. Long Gate S.C.
 North America s Largest Owner & Operator of Neighborhood & Community Shopping Centers Retail Investor Presentation Long Gate S.C. Ellicott City, MD Safe Harbor The statements in this presentation, including
Front Yard Residential Corporation Reports Third Quarter 2018 Results
 Front Yard Residential Corporation Reports Third Quarter 2018 Results November 7, 2018 CHRISTIANSTED, U.S. Virgin Islands, Nov. 07, 2018 (GLOBE NEWSWIRE) -- Front Yard Residential Corporation ( Front Yard
AGREE REALTY CORPORATION REPORTS OPERATING RESULTS FOR THE SECOND QUARTER 2015
 FOR IMMEDIATE RELEASE CONTACT: Joey Agree Chief Executive Officer (248) 737-4190 AGREE REALTY CORPORATION REPORTS OPERATING RESULTS FOR THE SECOND QUARTER 2015 BLOOMFIELD HILLS, MI (July 27, 2015) - Agree
Momentum you can build on
 Momentum you can build on Leading provider of services to residential real estate brokers and their REALTORS 2015 Annual General Meeting Forward Looking Statements This presentation contains forward looking
Presentation for REITs Symposium 2016
 Presentation for REITs Symposium 2016 4 June 2016 Important Notice This presentation shall be read in conjunction with OUE Commercial REIT s Financial Results announcement for 1Q 2016 dated 10 May 2016.
Dream Global REIT 2018 Fourth Quarter 1
 EPRA Metrics The annual EPRA BPR Awards aim to recognize and commend upon the efforts of property companies that have successfully adopted the EPRA BPR Guidelines. Based on the assessment performed by
CONSOLIDATED FINANCIAL STATEMENTS
 CONSOLIDATED FINANCIAL STATEMENTS Dundee Real Estate Investment Trust Consolidated Balance Sheets (unaudited) June 30, December 31, (in thousands of dollars) Note 2004 2003 Assets Rental properties 3,4
Q Investor Presentation
 Q1 2018 Investor Presentation 0 FORWARD-LOOKING STATEMENTS This presentation contains forward-looking information and other forward-looking statements. Words such as continue, expected, forecast, grow,
Taubman Centers, Inc. Taubman/Starwood Capital Group Transaction
 Taubman Centers, Inc. Taubman/Starwood Capital Group Transaction June 18, 2014 Forward Looking Language and Use of Non-GAAP Measures For ease of use, references in this presentation to Taubman Centers,
FY2012 RESULTS PRESENTATION
 FY2012 RESULTS PRESENTATION 21 August 2012 INVESTMENT HIGHLIGHTS Proven track record of consistent earnings growth and meeting targets Strategically located and diverse residential portfolio Urban and
2014 Operating and Financial Highlights
 FINANCIAL HIGHLIGHTS > 2014 Operating and Financial Highlights Operating Results Executed 203 leasing transactions representing approximately 2.8 million square feet, the highest gross leasing volume in
STAG INDUSTRIAL ANNOUNCES SECOND QUARTER 2018 RESULTS
 STAG INDUSTRIAL ANNOUNCES SECOND QUARTER 2018 RESULTS Boston, MA July 31, 2018 - STAG Industrial, Inc. (the Company ) (NYSE:STAG), today announced its financial and operating results for the quarter ended
MANAGEMENT INVESTOR PRESENTATION Second Quarter August 9, 2018
 MANAGEMENT INVESTOR PRESENTATION Second Quarter 2018 August 9, 2018 NON-GAAP MEASURES RioCan s consolidated financial statements are prepared in accordance with IFRS. Consistent with RioCan s management
Automotive Properties Real Estate Investment Trust
 Automotive Properties Real Estate Investment Trust Management s Discussion and Analysis December 31, 2015 Table of Contents SECTION 1 GENERAL INFORMATION AND CAUTIONARY STATEMENTS...3 Basis of Presentation...3
FOR THE YEAR ENDED DECEMBER 31, 2012 THE KEYS TO SUCCESS CALLOWAY REAL ESTATE INVESTMENT TRUST
 Supplemental information Package FOR THE YEAR ENDED DECEMBER 31, 2012 THE KEYS TO SUCCESS CALLOWAY REAL ESTATE INVESTMENT TRUST Index Conference Call Highlights.... 2 Portfolio Highlights...... 6 Distribution
4Q & FY16/17 Financial Results
 4Q & FY16/17 Financial Results 24 April 2017 Important Notice This presentation shall be read in conjunction with Mapletree Industrial Trust s ( MIT ) financial results for Fourth Quarter Financial Year
Comstock Holding Companies, Inc. NASDAQ: CHCI. New Business Model Update June 12, 2018
 NASDAQ: CHCI New Business Model Update June 12, 2018 DISCLAIMER This release includes "forward looking" statements that are made pursuant to the safe harbor provisions of the Private Securities Litigation
Achieved record annual revenues of $110.0 million for 2018, representing an increase of 5.8%
 Clipper Realty Inc. Announces Fourth Quarter and Full-Year 2018 Results Reports Record Annual Revenues, Record Annual Income from Operations and Record Quarterly and Annual Adjusted Funds from Operations
Investor Presentation September 2014
 Investor Presentation September 2014 Forward Looking Statements This presentation may contain various forward-looking statements. You can identify forward-looking statements by the use of forward-looking
MANAGEMENT INVESTOR PRESENTATION First Quarter June 22, 2018
 MANAGEMENT INVESTOR PRESENTATION First Quarter 2018 June 22, 2018 NON-GAAP MEASURES RioCan s consolidated financial statements are prepared in accordance with IFRS. Consistent with RioCan s management
Clipper Realty Inc. Announces Third Quarter 2018 Results Reports Record Revenues, Income From Operations and Adjusted Funds From Operations
 Clipper Realty Inc. Announces Third Quarter 2018 Results Reports Record Revenues, Income From Operations and Adjusted Funds From Operations NEW YORK, November 1, 2018 /Business Wire/ -- Clipper Realty
Front Yard Residential Corporation Announces Transformative Acquisition and Reports Second Quarter 2018 Results
 Front Yard Residential Corporation Announces Transformative Acquisition and Reports Second Quarter 2018 Results August 9, 2018 CHRISTIANSTED, U.S. Virgin Islands, Aug. 09, 2018 (GLOBE NEWSWIRE) -- Front
CORNWALL SQUARE ENCLOSED RETAIL REPOSITIONING OPPORTUNITY
 SYDNEY STREET PITT STREET WATER STREET EAST CORNWALL SQUARE C O R N W A L L, O N ENCLOSED RETAIL REPOSITIONING OPPORTUNITY CORNWALL SQUARE THE OFFERING CBRE Limited ( CBRE ), on behalf of Partners REIT
SUPPLEMENTAL INFORMATION
 SUPPLEMENTAL INFORMATION UNAUDITED FOURTH QUARTER 2018 STAG SUPPLEMENTAL INFORMATION FOURTH QUARTER 2018 1 Forward-Looking Statements This supplemental information package contains certain forward-looking
FOR IMMEDIATE RELEASE CONTACT: John Bucksbaum 312/ General Growth Properties, Inc. Reports Operating Results for the Third Quarter 2005
 News Release General Growth Properties, Inc. 110 North Wacker Drive Chicago, IL 60606 (312) 960-5000 FAX (312) 960-5475 FOR IMMEDIATE RELEASE CONTACT: John Bucksbaum 312/960-5005 Bernie Freibaum 312/960-5252
Table of Contents Page
 Table of Contents Page Page Company, Common Stock, and Earnings Call Information 1 Debt Information Definitions 2-3 Debt Maturities 20 Financial Information Unsecured Public Debt Covenants 21 Balance Sheets
CHOICE PR A great START OPER TIES REIT Annu A l R EPOR T 2013
 A great start Annual Report 2013 About Us Choice Properties Real Estate Investment Trust is an owner, manager and developer of well-located retail and commercial properties across Canada. Choice Properties
Timbercreek. U.S. Multi-Residential Opportunity Fund #1. Semi-Annual Investor Update
 Timbercreek U.S. Multi-Residential Opportunity Fund #1 Semi-Annual Investor Update FORWARD LOOKING STATEMENT Certain statements in this presentation about Timbercreek U.S. Multi-Residential Opportunity
12 REGIONAL CENTRES AND CORRIDORS PROGRAM UPDATE
 Clause No. 12 in Report No. 11 of was adopted, without amendment, by the Council of The Regional Municipality of York at its meeting held on June 26, 2014. 12 REGIONAL CENTRES AND CORRIDORS PROGRAM UPDATE
MANAGEMENT INVESTOR PRESENTATION Year end Updated: February 27, 2018
 MANAGEMENT INVESTOR PRESENTATION Year end 2017 Updated: February 27, 2018 NON-GAAP MEASURES RioCan s consolidated financial statements are prepared in accordance with IFRS. Consistent with RioCan s management
Investors and Analyst
 KITE HEADQUARTERS Indianapolis, IN PRESENTED TO: Investors and Analyst 11.2011 DISCLAIMER This presentation contains certain statements that are not historical fact and may constitute forwardlooking statements
2018 Greater Toronto Area Economic Outlook
 2018 Greater Toronto Area Economic Outlook 1 HIGHLIGHTS Although the Canadian economy performed exceptionally well in the first half of, posting GDP growth of approximately 4.0%, it has slowed since then
SUNTEC REIT FINANCIAL RESULTS. For the 1 st Quarter ended 31 March 2017
 SUNTEC REIT FINANCIAL RESULTS For the 1 st Quarter ended 31 March 2017 26 April 2017 Agenda 03 Q1 17 Highlights 05 Financial Highlights 15 Office Portfolio Performance 22 Retail Portfolio Performance 29
MANAGEMENT INVESTOR PRESENTATION Year end Updated: March 23, 2018
 MANAGEMENT INVESTOR PRESENTATION Year end 2017 Updated: March 23, 2018 NON-GAAP MEASURES RioCan s consolidated financial statements are prepared in accordance with IFRS. Consistent with RioCan s management
SOUTHWEST CORNER OF CAPITOL DRIVE & 124TH STREET BROOKFIELD (SUBURBAN MILWAUKEE), WISCONSIN
, WISCONSIN") SOUTHWEST CORNER OF CAPITOL DRIVE & 124TH STREET BROOKFIELD (SUBURBAN MILWAUKEE), WISCONSIN INVESTMENT HIGHLIGHTS S U B J E C T O F F E R I N G Mid-America Real Estate Corporation, in cooperation with
SOUTHWEST CORNER OF CAPITOL DRIVE & 124TH STREET BROOKFIELD (SUBURBAN MILWAUKEE), WISCONSIN INVESTMENT HIGHLIGHTS S U B J E C T O F F E R I N G Mid-America Real Estate Corporation, in cooperation with
Retail Acquisition Example
 Property Information Retail Acquisition Example Project Assumptions Acquisition Assumptions Property Name Retail Acquisition Example Project Type Acquisition Location Austin, TX Acquisition Cost $1,800,000
Retail Opportunity Investments Corp. Reports Strong First Quarter Results & Raises FFO Guidance
 April 27, 2016 Retail Opportunity Investments Corp. Reports Strong First Quarter Results & Raises FFO Guidance $17.4% increase in FFO Per Diluted Share 7.6% Increase in Same-Center Cash Net Operating Income
NON-GAAP FINANCIAL MEASURES
 NON-GAAP FINANCIAL MEASURES Welltower Inc. (HCN) believes that revenues, net operating income from continuing operations (NOICO), net income and net income attributable to common stockholders (NICS), as
Industrial Income Trust Inc.
 UNITED STATES SECURITIES AND EXCHANGE COMMISSION Washington, D.C. 20549 FORM 8-K CURRENT REPORT Pursuant to Section 13 or 15(d) of The Securities Exchange Act of 1934 Date of Report (Date of earliest event
February 7, *Electronic version Delivered by to:
 February 7, 2018 Mr. Chris Raynor, Regional Clerk* The Regional Municipality of York 17250 Yonge Street Newmarket, ON L3Y 6Z1 *Electronic version Delivered by E-mail to: Christopher.raynor@york.ca Dear
26 February 2013 FIRST HALF RESULTS PRESENTATION
 26 February 2013 FIRST HALF RESULTS PRESENTATION Investment highlights Proven track record of consistent earnings growth and meeting targets Strategically located and diverse residential portfolio Urban
Real Estate Market Report
 THE POWER OF DISCIPLINED INVESTING Real Estate Market Report March, There continues to be demand for core real estate in major Canadian markets and institutional investors continue to show interest in
Genesis Reports 2017 Third Quarter Results
 Genesis Reports 2017 Third Quarter Results For Immediate Release CALGARY, November 9, 2017 Genesis Land Development Corp. (TSX: GDC) (the Corporation or Genesis ) reported its financial and operating results
AGREE REALTY CORPORATION REPORTS OPERATING RESULTS FOR THE FOURTH QUARTER AND FULL YEAR 2014
 FOR IMMEDIATE RELEASE CONTACT: Brian Dickman Chief Financial Officer (248) 737-4190 AGREE REALTY CORPORATION REPORTS OPERATING RESULTS FOR THE FOURTH QUARTER AND FULL YEAR 2014 BLOOMFIELD HILLS, MI (February
Five Oaks Investment Corp.
 Five Oaks Investment Corp. Investor Presentation May 2018 Disclaimer & Name Change This presentation contains forward-looking statements within the meaning of Section 27A of the Securities Act of 1933,
FORM F3 MATERIAL CHANGE REPORT
 FORM 51-102F3 MATERIAL CHANGE REPORT Item 1 Name and Address of Issuer Crombie Real Estate Investment Trust (the REIT or Crombie ) 610 East River Road, Suite 200, New Glasgow, Nova Scotia, B2H 3S2 Item
Public Storage Reports Results for the Quarter Ended March 31, 2017
 News Release Public Storage 701 Western Avenue Glendale, CA 91201-2349 www.publicstorage.com For Release Immediately Date April 26, 2017 Contact Clemente Teng (818) 244-8080, Ext. 1141 Public Storage Reports
Extra Space Storage Inc. Reports 2017 Fourth Quarter and Year-End Results
 Extra Space Storage Inc. Reports 2017 Fourth Quarter and Year-End Results February 20, 2018 SALT LAKE CITY, Feb. 20, 2018 /PRNewswire/ -- Extra Space Storage Inc. (NYSE: EXR) (the "Company"), a leading
WHITE PAPER ON SUPPLEMENTAL DISCLOSURES FOR REAL ESTATE INVESTMENT AND DEVELOPMENT ENTITIES
 WHITE PAPER ON SUPPLEMENTAL DISCLOSURES FOR REAL ESTATE INVESTMENT AND DEVELOPMENT ENTITIES FEBRUARY 10, 2009 I. Introduction II. III. IV. Adjusted Funds From Operations Capital Expenditures TABLE OF CONTENTS