U.S. Foreclosure Outlook
|
|
|
- Erica Wilcox
- 6 years ago
- Views:
Transcription
1 U.S. Foreclosure Outlook Where we ve been, where we are, and where we re going To: Company Name Here Date: Goes Here
2 A brief note on methodology RealtyTrac collects foreclosure documents, postings and published notices from about 2,200 counties nationwide. Counties account for over 92 percent of all U.S. housing units Data is collected primarily by network of abstractors Monthly counts are based on date the document/posting/notice was uploaded into the RealtyTrac database, not the recording date
3 Where we ve been: Foreclosure Review An historically unprecedented cycle First wave not started by usual economic trends, but by unsustainable home prices and high-risk monetary and underwriting practices Sub-prime loans started the wave, and provided the tipping point for the mortgage market meltdown Properties with foreclosure filings have exceeded 300,000 for 20 consecutive months through Oct March 2010 was the highest month ever in terms of foreclosure activity, with over 367,000 U.S. households receiving a foreclosure notice That will trend will be broken in November because of fallout from robo-signing controversy
4 U.S. foreclosure activity over last five years U.S. Monthly Foreclosure Activity Default Auction REO March 2010 highest monthly total with 367,
5 Apr-05 Jun-05 Aug-05 Oct-05 Dec-05 Feb-06 Apr-06 Jun-06 Aug-06 Oct-06 Dec-06 Feb-07 Apr-07 Jun-07 Aug-07 Oct-07 Dec-07 Feb-08 Apr-08 Jun-08 Aug-08 Oct-08 Dec-08 Feb-09 Apr-09 Jun-09 Aug-09 Oct-09 Dec-09 Feb-10 Apr-10 Jun-10 Aug-10 Oct-10 The Delay and Pray strategy usually doesn t work 120,000 Default Auction REO SB 1137 takes effect in Sep ,000 80,000 60,000 40,000 20,000 -
6 Total Foreclosure Sales Percent of All Sales Where we ve been: foreclosure sales skyrocketing U.S. Total Foreclosure Sales Activity # of Sales Pct. of All Sales 400, , , , , , , , Q Q Q Q Q Q Q Q Q Q Q Q Q Q Q Q Q Q Q Q Q Q2 Q3 0.00
7 Where we are At or near the technical peak of foreclosure activity U.S. foreclosure activity has decreased on annual basis in five of last seven months New foreclosure starts have decreased on annual basis for nine straight months But risk remains in market High unemployment Underwater homeowners (20% plus) Toxic loans still lingering Backlog of bank-owned inventory
8 Where we are: Foreclosure Starts decreasing 120% Annual Percent Change in Foreclosure Activity by Type Default YOY Auction YOY REO YOY 100% 80% 60% 40% 20% 0% -20% -40%

9 Where we are: Top 10 State Foreclosure Rates
10 Where we are: backlog of bank-owned inventory RealtyTrac New REO Activity RealtyTrac # of REO Sales 350, ,000 Since Q2 2005, 1.7 million more REOs have been created than have been sold 250, , , ,000 50, Q Q Q Q Q Q Q Q Q Q Q Q Q Q Q Q Q Q Q Q Q Q Q4
11 Where we are: more shadow inventory 59% of the housing market, or 7.1 million, are in some stage of distress Properties in Foreclosure Process, 1,200,000, 10% Exhisting Home Sales, 4,530,000, 38% New Home Sales, 307,000, 3% Delinquent, 5,000,000, 41% REO, 900,000, 8%

12 Where we are: toxic loans lingering 14 SOURCE: Amherst Securities, Loan Performance
13 Where we re going Foreclosure levels remain at a high plateau in 2011 Unemployment will drive high levels of foreclosure activity through 2011 Resetting option ARMs could also contribute to continued high foreclosure levels Foreclosure activity turns corner 2012 to 2014 Optimistically, levels could start declining consistently in 2012, which would match the typical seven-year window we have seen with high foreclosure cycles in the past. Pessimistically, the cycle pushed out up to two years because of the delays we ve seen over the past two years in getting the distressed inventory cleared.
14 Where we re going: 2010 and 2011 projections U.S. Properties with FC Filings Total FC Filings 4,500,000 4,000,000 3,957,643 4,000,000 4,100,000 3,500,000 3,000,000 3,157,806 2,824,674 2,900,000 3,000,000 2,500,000 2,203,295 2,330,483 2,000,000 1,500,000 1,259,118 1,285,873 1,000, , , (p) 2011 (p)
15 Charting foreclosures by county To: Company Name Here Date: Goes Here

16 Charting foreclosure rates by county October 2010
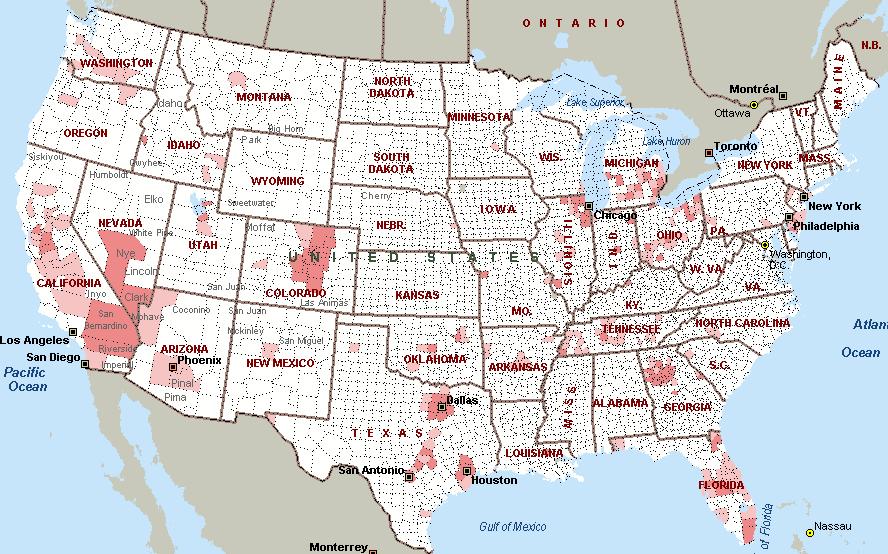
17 2006
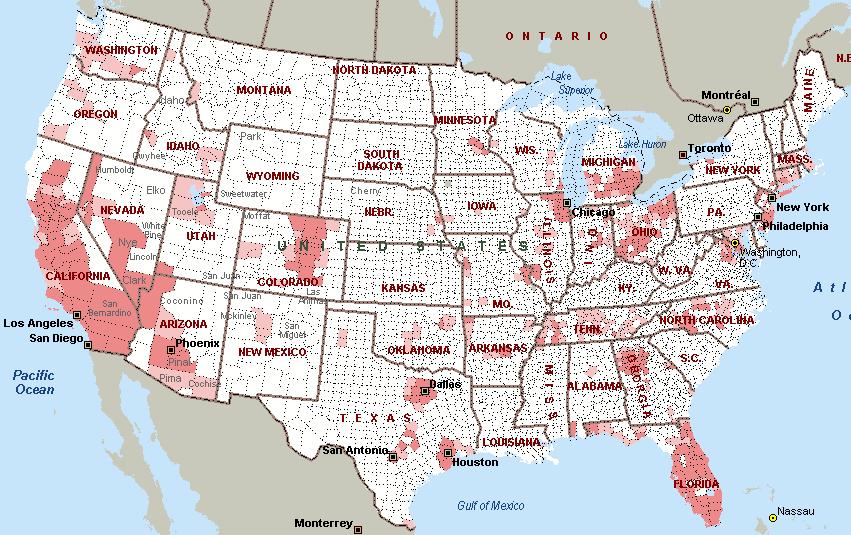
18 2007
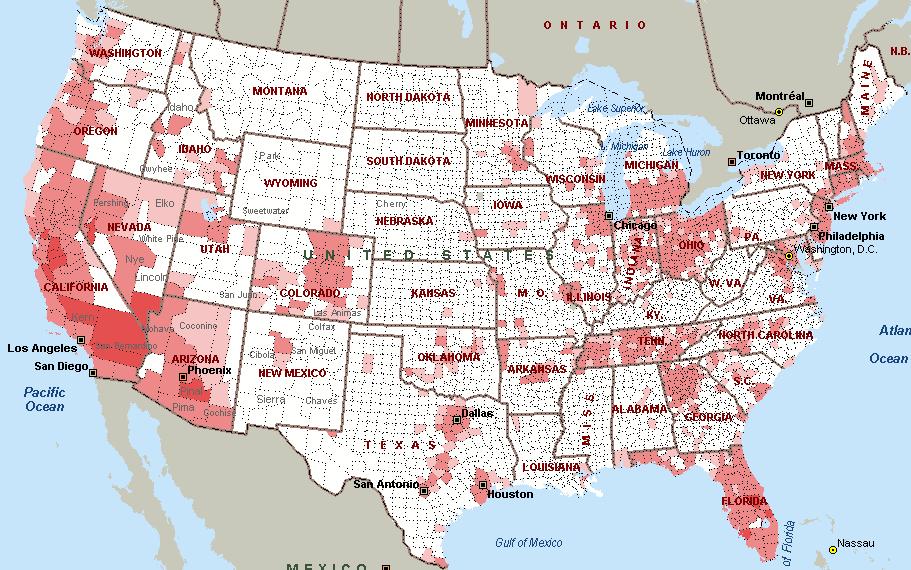
19 2008
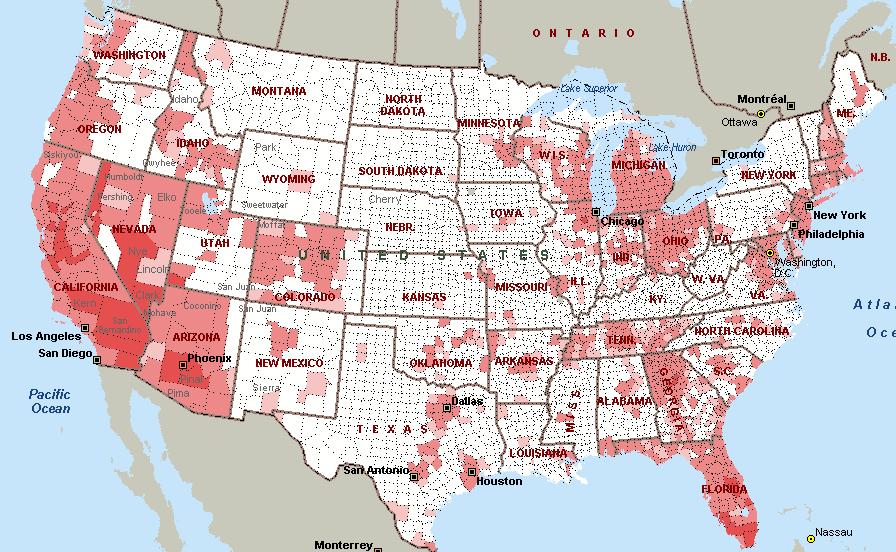
20 2009

21 2010 Year-End Projection

22 Hope for first-time homebuyers
23 Contact Information Daren Blomquist Director of Marketing Communications To: Company Name Here Ext. 115 Date: Goes Here
U.S. Foreclosure Activity Increases 2 Percent in July Boosted by 6 Percent Increase in Foreclosure Starts
 August 13, 2013 By RealtyTrac Staff U.S. Foreclosure Activity Increases 2 Percent in July Boosted by 6 Percent Increase in Foreclosure Starts Bank Repossessions Up 4 Percent From Previous Month, 29 States
Monthly Indicators + 4.8% - 3.5% %
 Monthly Indicators 2015 New Listings were up 45.0 percent for single family/duplex homes but decreased 44.1 percent for townhouse-condo properties. Pending Sales increased 14.3 percent for single family/duplex
California Housing Market Update. Monthly Sales and Price Statistics May 2018
 California Housing Market Update Monthly Sales and Price Statistics May 2018 Sales Lost Momentum as Mortgage Rates Continued to Climb California, May 2018 Sales: 409,270 Units, +0.3% YTD, -4.6% YTY 700,000
Monthly Indicators + 7.3% + 6.6% + 8.3% Single-Family Market Overview Condo Market Overview New Listings Pending Sales.
 Monthly Indicators 2018 The three most prominent national market trends for residential real estate are the ongoing lack of abundant inventory, the steadily upward movement of home prices and year-over-year
FOR IMMEDIATE RELEASE Contact: David B. Bennett President & CEO Phone:
 FOR IMMEDIATE RELEASE Contact: David B. Bennett President & CEO Phone: 727-216-32 Email: dbennett@tampabayrealtor.com Real Estate Statistics for September 216 At this time of year everyone starts to get
Monthly Market Watch for the Prescott Quad City Area. Provided by Keller Williams Check Realty Statistics from August 2012 Prescott MLS
 August 2012 Monthly Market Watch for the Prescott Quad City Area Provided by Keller Williams Check Realty Statistics from August 2012 Prescott MLS Report Overview: This report includes MLS data for the
California Housing Market Update. Monthly Sales and Price Statistics September 2018
 California Housing Market Update Monthly Sales and Price Statistics September 2018 Sales Had the Largest Decline since March 2014 California, September 2018 Sales: 382,550 Units, -3.3% YTD, -12.4% YTY
Monthly Indicators % % %
 Monthly Indicators 2016 Percent changes calculated using year-over-year comparisons. New Listings were down 27.6 percent for single family homes and 41.8 percent for townhouse-condo properties. Pending
Monthly Indicators % + 9.7% %
 Monthly Indicators 2016 Percent changes calculated using year-over-year comparisons. New Listings were up 11.1 percent for single family homes and down 30.8 percent for townhouse-condo properties. Pending
RESIDENTIAL MARKET ANALYSIS
 RESIDENTIAL MARKET ANALYSIS EVAN ABRAMOWITZ Joseph Bernard Investment Real Estate Oregon Association of Realtors Student Fellow Masters of Real Estate Development Graduate Student National housing market
Report on Nevada s Housing Market
 July Report on Nevada s Housing Market This series of reports on Nevada s Housing Market is co-presented by the Lied Institute for Real Estate Studies at the University of Nevada, Las Vegas and the State
FOR IMMEDIATE RELEASE Contact: David B. Bennett President & CEO Phone:
 FOR IMMEDIATE RELEASE Contact: David B. Bennett President & CEO Phone: 727-216-32 Email: dbennett@tampabayrealtor.com Real Estate Statistics for September 217 September s numbers are out, and it comes
LEVERAGING THE LATEST HOUSING MARKET TRENDS TO HELP DISTRESSED HOMEOWNERS Renwood RealtyTrac LLC
 LEVERAGING THE LATEST HOUSING MARKET TRENDS TO HELP DISTRESSED HOMEOWNERS WHAT WE LL COVER A bit about RealtyTrac Where have all the foreclosures gone? Markets bucking the downward trend Shadow inventory?
California Housing Market Update. Monthly Sales and Price Statistics October 2018
 California Housing Market Update Monthly Sales and Price Statistics October 2018 Sales Had the 2 nd Largest Drop in the Last 6 Months California, October 2018 Sales: 397,060 Units, -3.7% YTD, -7.9% YTY
FOR IMMEDIATE RELEASE Contact: David B. Bennett President & CEO Phone:
 FOR IMMEDIATE RELEASE Contact: David B. Bennett President & CEO Phone: 727-216-32 Email: dbennett@tampabayrealtor.com Real Estate Statistics for December 217 wrapped up a sizzling 217 with a steady month
California Housing Market Update. Monthly Sales and Price Statistics November 2018
 California Housing Market Update Monthly Sales and Price Statistics November 2018 Home Sales: Largest Decline Since 2014 California, November 2018 Sales: 381,400 Units, -4.6% YTD, -13.4% YTY 700,000 600,000
Monthly Indicators % % - 3.5%
 Monthly Indicators 2017 New Listings were up 6.3 percent for the category but decreased 33.1 percent for the category. Pending Sales increased 5.0 percent for but decreased 1.3 percent for. The Median
California Housing Market Update. Monthly Sales and Price Statistics August 2018
 California Housing Market Update Monthly Sales and Price Statistics August 2018 Sales Declined for the 4 th Consecutive Month California, August 2018 Sales: 399,600 Units, -2.1% YTD, -6.6% YTY 700,000
Jim & Jim McKenna LBA & LSA TheJims.com
 Jim & Jim McKenna LBA & LSA 631-974-9151 TheJims.com Return on Investment January 2000 March 2013 MSN Money.com, Case Shiller Pending Home Sales 110 105 100 95 90 Jan Feb Mar Apr May Jun Jul Aug Sep Oct
California Housing Market Update. Monthly Sales and Price Statistics December 2018
 California Housing Market Update Monthly Sales and Price Statistics December 2018 Sales Reached the Lowest Level since Jan 2015 California, December 2018 Sales: 372,260 Units, -5.2% YTD, -11.6% YTY 700,000
1200 Premier Drive, Suite 140 Chattanooga, TN Each office is independently owned and operated.
 THIS MONTH IN REAL ESTATE K im aulston R REALTOR 1200 Premier Drive, Suite 140 Chattanooga, TN 37421 Each office is independently owned and operated. Cell: 423-316-4022 Office: 423-664-1600 Email: kcraulston@gmail.com
Monthly Market Watch for Maricopa County An overview of what is happening in the Maricopa County real estate market
 Monthly Market Watch for Maricopa County An overview of what is happening in the Maricopa County real estate market Provided by Susan Kraemer of Prudential Arizona Properties Report overview: This report
MLS of Greater Cincinnati - Charts for the Month: November 2017
 MLS of Greater Cincinnati - Charts for the Month: November 2017 The following charts provide an overview of what has occurred in the MLS over the past month. Each chart provides a historical trend. The
Scott Market Report Stronger Sales Continue
 June 20 Scott Market Report Stronger Sales Continue The Outer Banks real estate market is seeing good signs in most market segments. After a somewhat slow start to 20, sales agreements picked up significantly
2017 RESIDENTIAL REAL ESTATE MARKET REPORT
 2017 RESIDENTIAL REAL ESTATE MARKET REPORT Published January 26, 2018 Our market reports have been focused on the effects of low inventory on our housing market and for good reason. December 2017 marked
Housing Price Forecasts. Illinois and Chicago PMSA, April 2013
 Housing Price Forecasts Illinois and Chicago PMSA, April 2013 Presented To Illinois Association of Realtors From R E A L Regional Economics Applications Laboratory, Institute of Government and Public Affairs
Outlook for Median Home Selling Prices. United States data are useless for us.
 Outlook for Median Home Selling Prices Outline United States Data Unobserved Prices The Future of California s Median Home Price Bill Watkins August 28, 28 2.% Existing Single-family Housing Sales percent
Minneapolis St. Paul Residential Real Estate Index
 University of St. Thomas Minneapolis St. Paul Residential Real Estate Index September 2017 Welcome to the latest edition of the UST Minneapolis St. Paul Residential Real Estate Index. The University of
Monthly Indicators % % %
 Monthly Indicators 2018 Percent changes calculated using year-over-year comparisons. New Listings were down 12.9 percent for single family homes and 21.3 percent for townhouse-condo properties. Pending
Coachella Valley Median Detached Home Price April April 2017
 The Desert Housing Report Median Price $450,000 $400,000 Coachella Valley Median Detached Home Price April 2002 - $349,000 $389,000 $350,000 $300,000 $250,000 $200,000 $150,000 CV Detached Median Price
HOUSING MARKET ANALYSIS
 HOUSING MARKET ANALYSIS NGAN NGUYEN Oregon Association of Realtors Student Fellow & Certificate of Real Estate Development Graduate Student National housing market statistics reflect a decreasing prices
Annual Report on the Charleston Area Housing Market FOR RESIDENTIAL REAL ESTATE ACTIVITY FROM THE CHARLESTON TRIDENT ASSOCIATION OF REALTORS MLS
 Annual Report on the Charleston Area Housing Market FOR RESIDENTIAL REAL ESTATE ACTIVITY FROM THE CHARLESTON TRIDENT ASSOCIATION OF REALTORS MLS FOR RESIDENTIAL REAL ESTATE ACTIVITY FROM THE CHARLESTON
Monthly Indicators % % - 9.2%
 Monthly Indicators 2016 New Listings were down 1.4 percent for single family/duplex homes and 25.0 percent for townhouse-condo properties. Pending Sales increased 58.3 percent for single family/duplex
Provided by Keller Williams Realty Professional Partners Statistics from September 2010 MLS
 Monthly Market Watch for Maricopa County An overview of what is happening in the Maricopa County real estate market (using September 2010 statistics) Report overview: This report includes MLS data for
Housing Price Forecasts. Illinois and Chicago PMSA, December 2015
 Housing Price Forecasts Illinois and Chicago PMSA, December 2015 Presented To Illinois Association of Realtors From R E A L Regional Economics Applications Laboratory, Institute of Government and Public
September 2018 MLS Statistical Report
 September 218 MLS Statistical Report Total Sales Blame it on Hurricane Florence but overall, sales dropped drastically in August - down 17%. Total Sales Sept'18 172-17% Sept'17 26-2% Sept'16 211 7% 3 2
COMMERCIAL PROPERTY PRICES REMAIN IN SLOWDOWN PATTERN AS MARKET REACTS TO INVESTOR PULLBACK
 CCRSI RELEASE MARCH 2016 (With data through February 2016) COMMERCIAL PROPERTY PRICES REMAIN IN SLOWDOWN PATTERN AS MARKET REACTS TO INVESTOR PULLBACK DESPITE DECLINE IN PROPERTY PRICING, LEASING ACTIVITY
FALLON CHURCHILL COUNTY, NEVADA RESIDENTIAL REAL ESTATE TRACKING REPORT
 FALLON CHURCHILL COUNTY, NEVADA RESIDENTIAL REAL ESTATE TRACKING REPORT 1st QUARTER 2016 BOB GETTO, C.R.S. & S.F.R. Nevada real estate broker, Lic # 16039 Council of Residential Specialists certified,
The FortuneBuilders Market Insider. Monthly Newsletter December 2014
 The FortuneBuilders Market Insider Monthly Newsletter December 2014 This month, we look at the job market and check in on unemployment rates. Mortgage delinquencies and non-current loans are declining.
SFR Condo Residential Lot Sales Inventory Sales Inventory Sales Inventory. Month YTD Month Month YTD Month Month YTD Month
 Grand Strand Market Report 2017 capped off a great year for the Grand Strand as full year SFR sales volume and median sales price were up 9.8% and 4.3%, respectively. Condo sales activity increased 3.0%
Housing Price Forecasts. Illinois and Chicago PMSA, August 2017
 Housing Price Forecasts Illinois and Chicago PMSA, August 2017 Presented To Illinois Realtors From R E A L Regional Economics Applications Laboratory, Institute of Government and Public Affairs University
2013 San Diego Economic Outlook. 29 th Annual Economic Roundtable Marney Cox Chief Economist San Diego Association of Governments January 25, 2013
 213 San Diego Economic Outlook 29 th Annual Economic Roundtable Marney Cox Chief Economist San Diego Association of Governments January 25, 213 US The Problem Slow Economic Growth Gross Domestic Product
Housing Price Forecasts. Illinois and Chicago PMSA, October 2014
 Housing Price Forecasts Illinois and Chicago PMSA, October 2014 Presented To Illinois Association of Realtors From R E A L Regional Economics Applications Laboratory, Institute of Government and Public
Record Number of Foreclosures Cancelled Auction investors see fewer deals, better margins
 Record Number of Foreclosures Cancelled Auction investors see fewer deals, better margins Discovery Bay, CA, July 13, 2010 - ForeclosureRadar (www.foreclosureradar.com), the only website that tracks every
Houston Summer Retail. Office. July 2016 Commercial Markets. Independent Valuations for a Variable World Page 1. Summary Q1 Statistics
 July 2016 Commercial Markets In This Issue Commercial Markets Retail Office Industrial Multifamily Housing Trends Single Family Housing Lot Supply & New Home Data % 10% 8% 6% 4% 2% 0% Retail 2007 Q1 2008
REAL ESTATE MARKET REVIEW
 MULTIFAMILY 2014 HAMPTON ROADS REAL ESTATE MARKET REVIEW Author Charles Dalton Data Analysis Real Data Financial Support The E.V. Williams Center for Real Estate and Economic Development (CREED) functions
Housing Price Forecasts. Illinois and Chicago PMSA, April 2018
 Housing Price Forecasts Illinois and Chicago PMSA, April 2018 Presented To Illinois Realtors From R E A L Regional Economics Applications Laboratory, Institute of Government and Public Affairs University
M onthly arket. July Table of Contents. Monthly Highlights
 Table of Contents Market Inventory...2 www.gaar.com Monthly Highlights The median sale price of single-family, detached homes climbed to $190,000 in July 2014, the highest level since August 2008. Market
FALLON CHURCHILL COUNTY, NEVADA RESIDENTIAL REAL ESTATE TRACKING REPORT
 FALLON CHURCHILL COUNTY, NEVADA RESIDENTIAL REAL ESTATE TRACKING REPORT 3rd QUARTER 15 BOB GETTO, C.R.S. & S.F.R. Nevada real estate broker, Lic # 16039 Council of Residential Specialists certified, National
House prices fall in June, but households in most regions optimistic about price rises over next 12 months
 Knight Frank/Markit House Price Sentiment Index (HPSI) JUNE 2012 House prices fall in June, but households in most regions optimistic about price rises over next 12 months Key headlines for June UK households
Housing Health Report Housing supply outlook suggests market high is leveling off
 November 2018 Housing Health Report Housing supply outlook suggests market high is leveling off For the first time since 2011, new and existing housing supply experiences blanket declines. 2018 activity
Market Trends Generated on 04/24/2018 Page 1 of Alpaca St, South El Monte, CA , Los Angeles County.
 9743 Alpaca St, South El Monte, CA 91733-3028, Los Angeles County Pricing Trends Median Sale Price to Current Value - Tax The percentage of properties that have increased or decreased in value based on
The Impact of Distressed Properties on Neighboring Values... 8
 why now is a great time to sell 2nd QUARTER 2011 table of contents 5 Reasons You Should Consider Selling Now... 1 Will I Get More Money If I Wait?... 3 Almost 14,000 Houses Sold Yesterday... 4 What Exactly
MARKET STRATEGY VIEWPOINT U.S. Housing Decelerating
 Jan-01 Oct-01 Jul-02 Apr-03 Jan-0 Oct-0 Jul-05 Apr-0 Jan-07 Oct-07 Jul-08 Apr-09 Jan-10 Oct-10 Jul-11 Apr-12 Jan-13 Oct-13 Jul-1 Apr-15 Jan-1 Oct-1 Jul-17 Apr-18 U.S. Housing Decelerating August 27, 2018
Minneapolis St. Paul Residential Real Estate Index
 University of St. Thomas Minneapolis St. Paul Residential Real Estate Index October 2017 About the Report: The University of St Thomas Residential Real Estate Index has been developed by the Shenehon Center
NOVEMBER 2018 Harrisonburg & Rockingham County Real Estate Market Report
 NOVEMBER 218 Real Estate Market Report An analysis of real estate activity through October 31, 218 provided courtesy of Scott P. Rogers, Funkhouser Real Estate Group Custom-Built Highland Park Home with
MARCH 2019 Harrisonburg & Rockingham County Real Estate Market Report
 MARCH 219 Real Estate Market Report An analysis of real estate activity through February 28, 219 provided courtesy of Scott P. Rogers, Funkhouser Real Estate Group Spacious Four Bedroom Brick Colonial
OCTOBER 2018 Harrisonburg & Rockingham County Real Estate Market Report
 OCTOBER 218 Real Estate Market Report An analysis of real estate activity through September 3, 218 provided courtesy of Scott P. Rogers, Funkhouser Real Estate Group Five Bedroom City Home with Finished
Released: May 7, 2010
 Released: May 7, 2010 Commentary 2 The Numbers That Drive Real Estate 3 Recent Government Action 9 Topics for Home Buyers, Sellers, and Owners 11 Brought to you by: KW Research Commentary The economic
CALIFORNIA ECONOMIC & MARKET OUTLOOK. October 29,2014 Contra Costa Association of REALTORS Leslie Appleton Young, Chief Economist
 2014 2015 CALIFORNIA ECONOMIC & MARKET OUTLOOK October 29,2014 Contra Costa Association of REALTORS Leslie Appleton Young, Chief Economist OVERVIEW Economic Outlook California Housing Market Outlook Housing
Real gross domestic product California vs. United States
 Real gross domestic product California vs. United States Percent change, year ago 6 4 U.S. California 2 0-2 -4-6 2001 2002 2003 2004 2005 2006 2007 2008 2009 2010 2011 Source: Bureau of Economic Analysis.
HOUSING MARKET ANALYSIS
 HOUSING MARKET ANALYSIS EVAN ABRAMOWITZ Joseph Bernard Investment Real Estate Oregon Association of Realtors Student Fellow & Masters of Real Estate Development Graduate Student National housing market
Shadow inventory in Texas
 With the national and local real estate markets turning positive, questions remain about the shadow inventory that was supposed to be holding down the market. Concerns over shadow inventory re-entering
Minneapolis St. Paul Residential Real Estate Index
 University of St. Thomas Minneapolis St. Paul Residential Real Estate Index Welcome to the latest edition of the UST Minneapolis St. Paul Residential Real Estate Index. The University of St Thomas Residential
PropertyShark.com Monthly Foreclosures Report
 PropertyShark.com Monthly Foreclosures Report February, 28 Scope: In this monthly report, PropertyShark.com provides charts, tables, and metrics about residential foreclosures (a.k.a. trustee sales) in
July 2012 was $162,256. ($153,956). was $314,607. was $172,488. ($164,426). Kansas City Region Average Sales Price - Existing Homes
. was $314,607. was $172,488. ($164,426). Kansas City Region Average Sales Price - Existing Homes") July 212 Kansas City Regional Real Estate Market Report Average Sales Price The average exis ng home sale price in July 212 was $162,256. 25 Kansas City Region Average Sales Price - Existing Homes July
July 212 Kansas City Regional Real Estate Market Report Average Sales Price The average exis ng home sale price in July 212 was $162,256. 25 Kansas City Region Average Sales Price - Existing Homes July
AAug ugust 2017
 August 17 17 Housing recovery a balancing act Growth in new listings outpaced sales preventing inventory declines City of Calgary, September 1, 17 Sales posted a modest gain in August, but a rise in new
Housing Price Forecasts. Illinois and Chicago PMSA, July 2016
 Housing Price Forecasts Illinois and Chicago PMSA, July 2016 Presented To Illinois Association of Realtors From R E A L Regional Economics Applications Laboratory, Institute of Government and Public Affairs
DATA FOR MAY Published June 23, Sales are up +11.3% month-over-month. The year-over-year comparison shows an increase of +11.1%.
 Permission is granted only to ARMLS Subscribers for reproduction with attribution on to ARMLS COPYRIGHT 2017. For questions regarding this publication contact Brand@ARMLS.com. DATA FOR MAY 2017 - Published
Public Homebuilders Look to Build in 2010
 Public Homebuilders Look to Build in 21 BY BRIAN J. CURRY, CRE, MAI, SRA PUBLICLY TRADED HOMEBUILDERS, many of which were sellers of production housing lots in 2 and 2, have again become buyers in certain
MULTIFAMILY 2012 MULTI-FAMILY HAMPTON ROADS MARKET REVIEW. Author. Data Analysis. Financial Support. Disclosure. Charles Dalton.
 HAMPTON ROADS MARKET REVIEW MULTIFAMILY Author Data Analysis Financial Support Disclosure Charles Dalton Real Data The E. V. Williams Center for Real Estate and Economic Development (CREED) functions and
Summary Statistics. Closed Sales. Paid in Cash. Median Sale Price. Average Sale Price. Dollar Volume. Median Time to Sale.
 ly Market Detail - November 217 Summary Statistics November 217 November 216 Paid in Cash 139 119 16.8% 84 68 23.5% $177, $175, 1.1% Average Sale Price Dollar Volume $217,48 $222,35-2.2% $3.2 Million $26.5
Summary Statistics. Closed Sales. Paid in Cash. Median Sale Price. Average Sale Price. Dollar Volume. Median Time to Sale.
 ly Market Detail - November 217 Summary Statistics November 217 November 216 Paid in Cash 42 32 31.3% 29 22 31.8% $265, $234, 13.2% Average Sale Price Dollar Volume $293,283 $32,115-2.9% $12.3 Million
Summary Statistics. Closed Sales. Paid in Cash. Median Sale Price. Average Sale Price. Dollar Volume. Median Time to Sale.
 ly Market Detail - December 17 Summary Statistics December 17 December 16 Paid in Cash 1 8.% 7 8-1.% $16, $11, 1.% Average Sale Price Dollar Volume $116,1 $1,83 -.% $1. Million $98,7 18.3% Median Percent
Summary Statistics. Closed Sales. Paid in Cash. Median Sale Price. Average Sale Price. Dollar Volume. Median Time to Sale.
 ly Market Detail - November 17 Summary Statistics November 17 November 16 Paid in Cash.% 3 3.% $137, $11,7 19.8% Average Sale Price Dollar Volume $18,7 $113,6 13.3% $1, $,6 13.3% Median Percent of Original
Summary Statistics. Closed Sales. Paid in Cash. Median Sale Price. Average Sale Price. Dollar Volume. Median Time to Sale.
 ly Market Detail - July 1 Summary Statistics July 1 July 15 Paid in Cash 13-9.% 3 1-75.% $77,75 $,5.% Average Sale Price Dollar Volume $77,1 $7,8 3.% $38, $97,998-8.3% Median Percent of Original List Price
Foreclosure Sales Nearly Double from Prior Year Despite Jump in Sales, Foreclosure Delays Remain at Record Levels
 Foreclosure Sales Nearly Double from Despite Jump in Sales, Foreclosure Delays Remain at Record Levels Discovery Bay, CA, April 13, 2010 - ForeclosureRadar (www.foreclosureradar.com), the only website
THE FACE OF FORECLOSURE
 THE FACE OF FORECLOSURE FLORIDA Contents A review of statewide foreclosures by filing type Demographic profiles of known foreclosed families & individuals Foreclosure trends in selected major metropolitan
Oversupply persists despite improved sales activity for affordable product Mar. 2019
 March 19 MONTHLY STATISTICS PACKAGE Oversupply persists despite improved sales activity for affordable product 19, April 1, 19 March saw a modest decline in city wide sales activity compared to last year.
Minneapolis St. Paul Residential Real Estate Index
 University of St. Thomas Minneapolis St. Paul Residential Real Estate Index Welcome to the latest edition of the UST Minneapolis St. Paul Residential Real Estate Index. The University of St Thomas Residential
2018 Real Estate Forecast Breakfast. Real Estate Market Update
 2018 Real Estate Forecast Breakfast Central Oregon Association of REALTORS Real Estate Market Update Paul C. Bishop, PhD, CBE Vice President, Research NATIONAL ASSOCIATION OF REALTORS February 22, 2018
Summary Statistics. Closed Sales. Paid in Cash. Median Sale Price. Average Sale Price. Dollar Volume. Median Time to Sale.
 ly Market Detail - March 217 Summary Statistics March 217 March 216 Paid in Cash 62 36 72.2% 36 25 44.% $214,5 $192,45 11.5% Average Sale Price Dollar Volume $246,998 $268,499-8.% $15.3 Million $9.7 Million
Summary Statistics. Closed Sales. Paid in Cash. Median Sale Price. Average Sale Price. Dollar Volume. Median Time to Sale.
 ly Market Detail - December 216 Summary Statistics December 216 December 21 Paid in Cash 13 1-13.3% 6 6.% $24, $17, 37.1% Average Sale Price Dollar Volume $2,3 $169,293 47.9% $3.3 Million $2. Million 28.1%
Summary Statistics. Closed Sales. Paid in Cash. Median Sale Price. Average Sale Price. Dollar Volume. Median Time to Sale.
 Summary Statistics June 217 June 216 Paid in Cash 2,2 1,885 7.2% 378 356 6.2% $245, $229,9 6.6% Average Sale Price Dollar Volume $38,695 $286,8 7.6% $623.6 Million $54.6 Million 15.3% Median Percent of
Summary Statistics. Closed Sales. Paid in Cash. Median Sale Price. Average Sale Price. Dollar Volume. Median Time to Sale.
 Summary Statistics June 217 June 216 Paid in Cash 1,692 1,85-6.3% 341 444-23.2% $355, $325, 9.2% Average Sale Price Dollar Volume $426,34 $377,929 12.8% $721.3 Million $682.2 Million 5.7% Median Percent
Housing Market Cycles
 MEGA AGENT Market Update Gary Keller and Jay Papasan 2 The U.S. Housing Market Keller Williams Realty, Inc. Housing Market Cycles 4 The U.S. Housing Market Housing Market Cycles 5 The U.S. Housing Market
Summary Statistics. Closed Sales. Paid in Cash. Median Sale Price. Average Sale Price. Dollar Volume. Median Time to Sale.
 ly Market Detail - June 217 Summary Statistics June 217 June 216 Paid in Cash 1,62 1,635-2.% 93 963-6.2% $16, $149,25 7.2% Average Sale Price Dollar Volume $214,677 $188,27 14.% $343.9 Million $37.8 Million
Summary Statistics. Closed Sales. Paid in Cash. Median Sale Price. Average Sale Price. Dollar Volume. Median Time to Sale.
 ly Market Detail - May 217 Summary Statistics May 217 May 216 Paid in Cash 431 411 4.9% 85 13-17.5% $215, $185, 16.2% Average Sale Price Dollar Volume $238,517 $214,566 11.2% $12.8 Million $88.2 Million
Summary Statistics. Closed Sales. Paid in Cash. Median Sale Price. Average Sale Price. Dollar Volume. Median Time to Sale.
 ly Market Detail - April 216 Summary Statistics April 216 April 215 Paid in Cash 881 914-3.6% 271 316-14.2% $179,9 $155, 16.1% Average Sale Price Dollar Volume $216,31 $193,311 11.8% $19.3 Million $176.7
Summary Statistics. Closed Sales. Paid in Cash. Median Sale Price. Average Sale Price. Dollar Volume. Median Time to Sale.
 ly Market Detail - January 217 Summary Statistics January 217 January 216 Paid in Cash 6 7-14.3% 44 42 4.8% $155,5 $137, 13.5% Average Sale Price Dollar Volume $168,836 $167,937.5% $1.1 Million $11.8 Million
Summary Statistics. Closed Sales. Paid in Cash. Median Sale Price. Average Sale Price. Dollar Volume. Median Time to Sale.
 ly Market Detail - November 216 Summary Statistics November 216 November 215 Paid in Cash 184 159 15.7% 47 45 4.4% $339,95 $329, 3.3% Average Sale Price Dollar Volume $671,917 $521,441 28.9% $123.6 Million
Summary Statistics. Closed Sales. Paid in Cash. Median Sale Price. Average Sale Price. Dollar Volume. Median Time to Sale.
 Summary Statistics September 216 September 215 Paid in Cash 215 21 2.4% 35 62-43.5% $374,186 $379, -1.3% Average Sale Price Dollar Volume $646,345 $574,329 12.5% $139. Million $12.6 Million 15.2% Median
FEBRUARY 2019 Harrisonburg & Rockingham County Real Estate Market Report
 FEBRUARY 219 Real Estate Market Report An analysis of real estate activity through January 31, 219 provided courtesy of Scott P. Rogers, Funkhouser Real Estate Group Immaculate Brick Highland Park Colonial
ECONOMIC CURRENTS. Vol. 3, Issue 1. THE SOUTH FLORIDA ECONOMIC QUARTERLY Introduction
 ECONOMIC CURRENTS THE SOUTH FLORIDA ECONOMIC QUARTERLY Introduction Economic Currents provides an overview of the South Florida regional economy. The report contains current employment, economic and real
Summary Statistics. Closed Sales. Paid in Cash. Median Sale Price. Average Sale Price. Dollar Volume. Median Time to Sale.
 ly Market Detail - July 216 Summary Statistics July 216 July 215 Paid in Cash 41 431-4.9% 151 28-27.4% $178,25 $175,9 1.3% Average Sale Price Dollar Volume $27,771 $21,414 3.2% $85.2 Million $86.8 Million
Summary Statistics. Closed Sales. Paid in Cash. Median Sale Price. Average Sale Price. Dollar Volume. Median Time to Sale.
 ly Market Detail - October 216 Summary Statistics October 216 October 215 Paid in Cash 329 347-5.2% 114 138-17.4% $38, $39, -2.6% Average Sale Price Dollar Volume $67,156 $72,396-7.% $22.5 Million $25.
Summary Statistics. Closed Sales. Paid in Cash. Median Sale Price. Average Sale Price. Dollar Volume. Median Time to Sale.
 ly Market Detail - February 216 Summary Statistics February 216 February 215 Paid in Cash 913 972-6.1% 571 711-19.7% $144,95 $128, 13.2% Average Sale Price Dollar Volume $26,993 $217,41-4.8% $188.4 Million
Summary Statistics. Closed Sales. Paid in Cash. Median Sale Price. Average Sale Price. Dollar Volume. Median Time to Sale.
 ly Market Detail - July 216 Summary Statistics July 216 July 215 Paid in Cash 11 28-6.7% 9 25-64.% $85,5 $76, 12.5% Average Sale Price Dollar Volume $1,5 $79,625 26.2% $1.1 Million $2.2 Million -5.4% Median
Summary Statistics. Closed Sales. Paid in Cash. Median Sale Price. Average Sale Price. Dollar Volume. Median Time to Sale.
 ly Market Detail - July 216 Summary Statistics July 216 July 215 Paid in Cash 22 19 15.8% 2 18 11.1% $71,25 $76, -6.3% Average Sale Price Dollar Volume $82,25 $76,77 7.1% $1.8 Million $1.5 Million 24.%
Regional Housing Foreclosure Summit Foreclosures in the Washington Metropolitan Region
 Regional Housing Foreclosure Summit Foreclosures in the Washington Metropolitan Region John C. McClain, AICP Senior Fellow and Deputy Director Center for Regional Analysis School of Public Policy, George