Joint Center for Housing Studies. Harvard University
|
|
|
- Morris Morgan
- 5 years ago
- Views:
Transcription
1 Joint Center for Housing Studies Harvard University Re-Weighting the Number of Households Undertaking Home Improvements in the 2013 American Housing Survey to Correct for Shifting Data Collection Periods Abbe Will May 2015 N15-1 by Abbe Will. All rights reserved. Short sections of text, not to exceed two paragraphs, may be quoted without explicit permission provided that full credit, including notice, is given to the source. Any opinions expressed are those of the authors and not those of the Joint Center for Housing Studies of Harvard University or of any of the persons or organizations providing support to the Joint Center for Housing Studies.
2
3 Background The Department of Housing and Urban Development (HUD) sponsors a biennial longitudinal survey of the U.S. housing stock and its inhabitants known as the American Housing Survey (AHS). One of the topics covered in the AHS is home improvement projects and spending by homeowners during the two years prior to the interview date. According to a User Note issued by the Census Bureau in December 2014, the home improvement estimates in the 2011 and 2013 American Housing Surveys (AHS) were adversely impacted by shifting data collection periods, which resulted in a likely overestimation of improvement spending in the 2011 survey and underestimation of spending in the 2013 survey. The Bureau warns that researchers comparing remodeling data between 2009 and 2011, and between 2011 and 2013, need to exercise caution in their interpretation of trends and should not derive trends in home improvement project completions (or other associated measures) between 2009, 2011, and 2013 due to the shift in data collection periods. 1 The Census Bureau explains that in a typical survey year, the AHS interview period is from late April through September, and the 2013 data collection period was characteristic of a typical year. However, the 2011 AHS data collection period was delayed three months due to budgetary reasons, and data were collected from late July through December The implication of these shifting data collection periods is that the 2013 survey is likely not reflecting 24 months of remodeling activity, but probably closer to months of activity. Indeed, analysis of the 2013 AHS home improvement module by the Joint Center found the data to be inconsistent with historical AHS trends, as well as other industry measures for remodeling activity during Namely, the project incidence share, or share of homeowners undertaking one or more home improvement projects, in the survey is 1 US Census Bureau. December AHS: User Note Regarding Home Improvement Data. Available: 2 Although Census cautions that the 2011 AHS likely overestimated improvement activity, Joint Center analysis found no obvious inconsistencies with historical trends when the data was initially released, and at this time, no adjustments to the 2011 dataset are planned. 1

4 significantly lower than any previous survey since the remodeling module was last overhauled with the 1995 AHS (Figure 1). Comparison of Improvement Spending Growth in the AHS and C-30 The large decline in project incidence together with a modest decline in average reported spending for improvement projects between the 2011 and 2013 surveys results in a 16.1 percent decline in two-year home improvement market spending from to In contrast, the Census Bureau s alternative measure of homeowner improvement spending from the monthly Construction Spending Value Put in Place series (C-30) estimates national two-year home improvement spending increased 11.5 percent from to (Figure 2a). 2
.")
5 Yet, historically, the rates of change in two-year home improvement spending have matched very closely between the AHS and C-30, which further supports the need for re-weighting the national AHS improvement module to correct for the interviewing timing problem as described in the aforementioned Census User Note (Figure 2b). 3 3 Preliminary Joint Center analysis suggests the 2001 and 2003 AHS also mismeasured improvement spending in similar ways as the 2011 and 2013 surveys. 3

6 Use of 2013 AHS Metropolitan Oversample to Re-Weight In order to correct for the reduced time period over which national home improvement activity was collected in the 2013 AHS, the Joint Center turned to a separate metropolitan oversample survey conducted by Census as part of the 2013 AHS to create a re-weighting methodology. The metropolitan oversample survey (referred to herein as the Metro Oversample) was conducted as a one-time survey in 20 metropolitan markets across the country. Unlike the longitudinal national survey, the Metro Oversample was not impacted by the issue of shifting interview periods since units in the metro sample were not previously interviewed. As expected, the home improvement project incidence and average spending is significantly higher for households surveyed in the one-time 2013 Metro Oversample compared to 4

7 homeowners located within metropolitan areas who were surveyed as part of the longitudinal national AHS (Figure 3). Over 58 percent of homeowners in the 20 oversampled metro markets undertook one or more home improvement projects in compared to less than 51 percent of homeowners in metro areas in the national survey. Average improvement spending for these homeowners in the Metro Oversample survey was also almost 24 percent higher. No meaningful difference was found in the weighted distributions of all homeowners and homeowners undertaking improvement projects along various demographic and socioeconomic measures (e.g. age, race/ethnicity, income, home value) between the pooled metro area oversample and owner households located in metro areas in the national sample. This finding provides some confidence that the metro oversamples are fairly representative of all metro areas in the nation even though the metros were not drawn randomly or to be nationally-representative. However, the Metro Oversample does differ in one critical way for home improvement activity: regional geography. The metro areas included in the 2013 oversample survey are significantly 5
8 skewed toward southern metros, particularly in Florida (see Appendix A). This matters for improvement activity because, historically, owners in the South have had much lower project incidence shares and average improvement spending than owners in other regions of the country (Figures 4a and 4b). For these reasons, using the Metro Oversample to re-weight households in the national survey may result in more conservative project incidence shares and average spending than if the metro areas in the Metro Oversample had been more regionally representative of all metros in the nation. 6

9 Two-Step Re-Weighting Methodology: Applying Project Incidence Shares and Spending Distributions from the Metro Oversample Survey The following is a description of a two-step re-weighting methodology to adjust the 2013 National AHS for the reduced period over which improvement activity was collected. This methodology specifically makes use of the improvement project incidence shares and spending distributions from the 2013 Metro Oversample survey as benchmarks for adjusting the household weights of homeowners with improvement activity in the National Survey. The main goals of this re-weighting are to increase the household weights of (1) homeowners undertaking projects and (2) higher-spending owners in the National AHS to reflect the project incidence shares and spending level distributions found in the Metro Oversample. The first-step re-weighting shifts weight from non-remodeling homeowners to homeowners with remodeling 7
10 activity to reflect the increased share of homeowners undertaking home improvements in the Metro Oversample file by householder age, household income, mobility (i.e. recent mover) status and metro/non-metro status. The second-step re-weighting further shifts household weight from lower-spending homeowners to higher-spending homeowners according to the distribution of improvement spending levels in the Metro Oversample file. Household Weights Used: National File: Metro Oversample File: WGT90GEO WGTMETRO Household Weights Produced: National File: REWEIGHT1 (intermediary or first-step re-weight) REWEIGHT2 (second-step or final re-weight) STEP 1: INCREASING PROJECT INCIDENCE AND SHARE A. In the National File: Compare the weighted average project incidence share for homeowners located in the 18 metro areas that are included in the Metro Oversample File to homeowners in all metro areas and non-metro areas. 4 The difference in project incidence share among these three groups will roughly indicate how over- or underrepresentative the 18 oversampled metros are in the National File because they were not selected randomly to be part of the 2013 Metro Oversample or to be necessarily representative of all metro areas in the nation (Table 1). i. The collective project incidence share for the 18 metros included in the Metro Oversample File that are also identifiable in the National File (50.4%) was found to be under-representative of all metro areas (50.9%) by 0.87 percent and overrepresentative of all non-metro areas (46.4%) by 8.1 percent. 4 Louisville, KY-IN and Richmond-Petersburg, VA were oversampled as part of the 2013 Metro Oversample survey, but these metros are not identifiable in the 2013 National AHS and were therefore left out of the analysis. 8
11 Table 1: Calculation of Improvement Project Incidence Shares in the 2013 National AHS for Units in Metro Areas Included in the Metro Oversample, All Metro Areas and Non- Metro Areas Metropolitan Areas Included in the Metro Oversample Survey ALL OWNERS OWNERS WITH PROJECTS Number Percent Number Percent Project Incidence Share (Percent) Austin, TX 132, % 72, % 54.9% Baltimore, MD 377, % 187, % 49.7% Boston, MA 634, % 332, % 52.4% Hartford, CT 12, % 10, % 77.5% Houston, TX 646, % 310, % 48.1% Jacksonville, FL 164, % 58, % 35.7% Las Vegas, NV 208, % 108, % 51.8% Louisville, KY-IN NA NA NA NA NA Miami Hialeah, FL 401, % 104, % 26.1% Minneapolis St. Paul, MN 562, % 342, % 60.8% Nashville, TN 125, % 75, % 60.3% Oklahoma City, OK 205, % 124, % 60.8% Orlando, FL 203, % 77, % 38.1% Richmond-Petersburg,VA NA NA NA NA NA Rochester, NY 160, % 78, % 48.7% San Antonio, TX 270, % 135, % 50.3% Seattle, WA 433, % 265, % 61.2% Tampa, FL 396, % 185, % 46.7% Tucson, AZ 168, % 81, % 48.1% Washington, DC MD VA 714, % 383, % 53.7% Metros in Oversample 5,819, % 2,935, % 50.4% All Metro Areas in US 56,441,756 28,714, % All NonMetro Areas in US 19,208,517 8,903, % All Homeowners 75,650,274 37,618, % Percent Difference in Shares Under-representation of Project Incidence for Metros in Oversample Compared to All Metro Areas in US 0.87% Over-representation of Project Incidence for Metros in Oversample Compared to All NonMetro Areas in US -8.10% Note: Tabulations use WGT90GEO household weights. 9
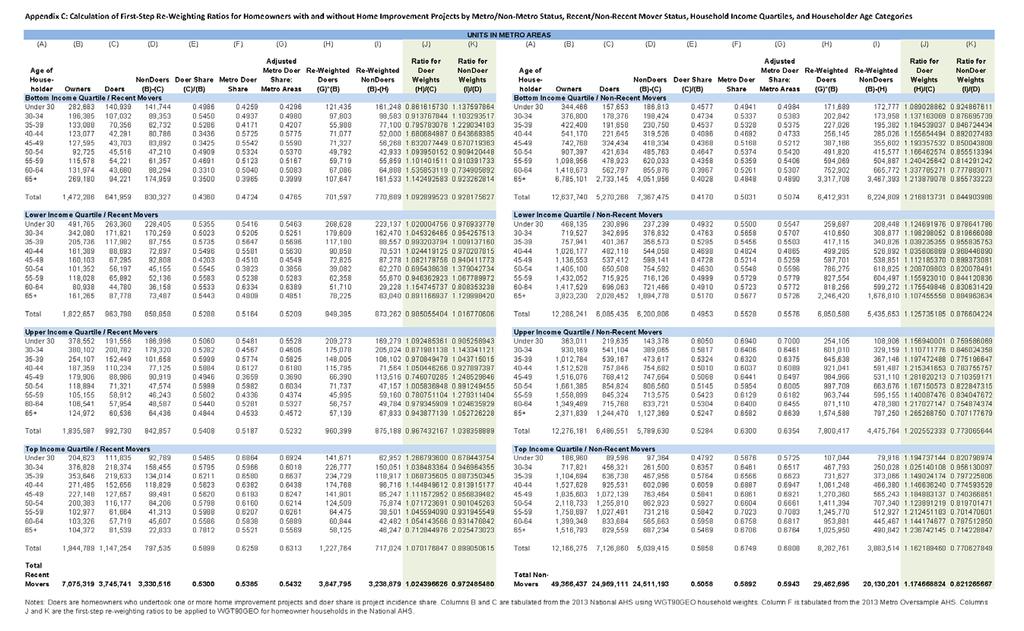
12 B. In the Metro File: Calculate the weighted average project incidence share by householder age categories, household income quartiles and mobility status (recent mover/non-recent mover), 5 excluding Louisville and Richmond metro areas since these oversampled metros are not identifiable in the national AHS. Household age, income and mobility status were chosen because these measures are historically strong drivers of remodeling activity and in particular the likelihood of homeowners to undertake a project. 6 Adjust the weighted project incidence share of the 18 metros that are also identifiable in the National File by percent to be applied to metro area units in the National File and -8.1 percent to be applied to non-metro area units in the National File. C. In the National File: Calculate the weighted (using WGT90GEO) number of all owners, owners undertaking one or more improvement projects and project incidence share by the same householder age categories, household income quartiles, and mobility status as in part 2, as well as by metro/non-metro status. Apply the adjusted incidence shares from the Metro File (as calculated in step 1, part B) to the weighted number of homeowners by age, income, mobility and metro status to produce re-weighted numbers of owners undertaking projects. Calculate the ratio of the re-weighted number of owners undertaking projects to the original weighted number of owners undertaking projects. Then proportionally decrease the number of owners without projects by subtracting the re-weighted owners with projects from total owner counts. Finally, calculate the ratio of re-weighted owners with projects to original weighted owners without projects (Appendix C). Apply the calculated ratios of the number of owners with and without projects to the original household weights (WGT90GEO) for homeowners by age, income, mobility and metro status to produce adjusted household weights with a higher project incidence share. These adjusted household weights are the intermediary or first-step re-weighting (REWEIGHT1). 5 See Appendix B for a description of the variable categories used in the analysis. 6 Peng, R A Comparison of the Determinants of Housing Improvement and the Determinants of Maintenance and Repair. Joint Center for Housing Studies of Harvard University, Working Paper W
13 STEP 2: INCREASING IMPROVEMENT SPENDING LEVELS A. In the National File: Compare the re-weighted (using REWEIGHT1) frequency distribution of owners undertaking projects by spending level categories for units located in the 18 metro areas that are included in the Metro Oversample File to units located in all metro areas and units in non-metro areas in the National File. The difference in frequency distributions among these three groups will roughly indicate how over- or under-representative the 18 oversampled metros might be along the spending levels measure because they were not selected randomly or to be representative of all metro areas in the nation (Table 2). i. The frequency distribution of owners with projects by improvement spending levels for the 18 metros included in the Metro Oversample File that are also identifiable in the National File was found to be over/under-representative of owners in all metro and non-metro areas by the percentages in columns (F) and (I) in Table 2: 11
14 Table 2: Calculation of Distribution of Improvement Spending in 2013 National AHS for Units in Metro Areas Included in the Metro Oversample, All Metro Areas and Non-Metro Areas (A) (B) (C) (D) (E) (F) (G) (H) (I) Per-Owner Improvement Spending METROS IN METRO OVERSAMPLE Number of Owners with Projects Incidence Share (%) ALL METRO AREAS Number of Owners with Projects Incidence Share (%) Over/Under- Representation of Metro Areas (% Difference in Share) ALL NONMETRO AREAS Number of Owners with Projects Incidence Share (%) Over/Under- Representation of NonMetro Areas (% Difference in Share) $ , ,431, ,292, $500-1, , ,079, ,179, $1,500-2, , ,651, ,568, $3,000-4, , ,859, ,207, $5,000-9, , ,650, ,556, $10,000-19, , ,329, , $20,000-34, , ,759, , $35, , ,427, , Total 3,398, ,189, ,347, Notes: Tabulations use REWEIGHT1 (first-step re-weights based on WGT90GEO) household weights. Per-owner improvement spending is tabulated only for homeowners undertaking projects. See Table 1 for the list of metro areas that are included in the Metro Oversample file. 12
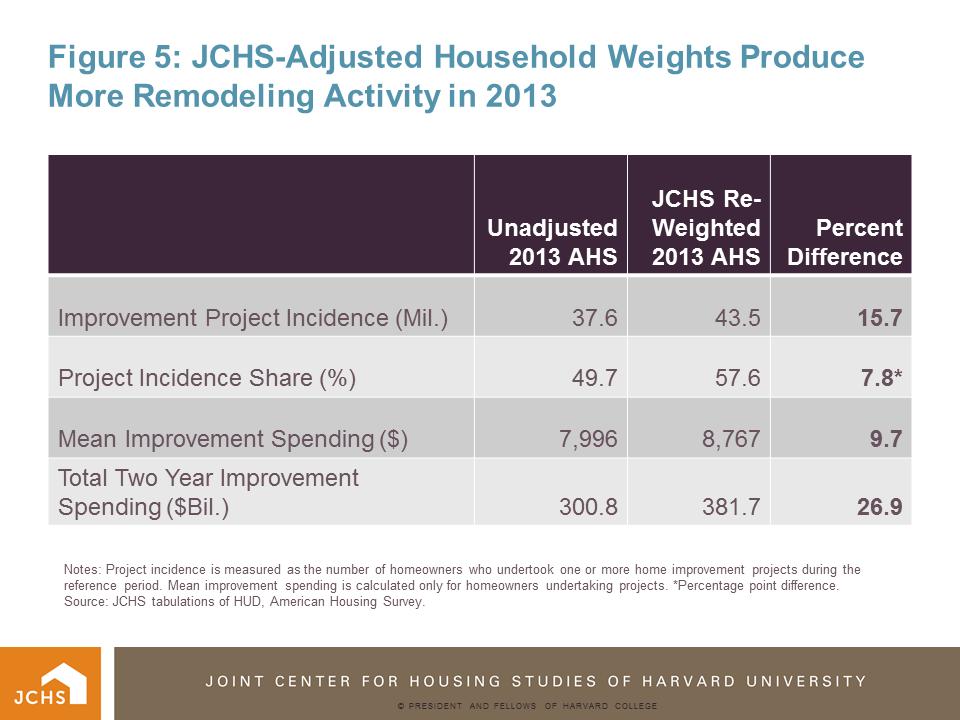
15 B. In the Metro File: Calculate the weighted frequency distribution of spending by spending level categories and home value quartiles individually for each metro area (except Louisville and Richmond, which are not identifiable in the National File). Home value was chosen because it is historically a strong driver of remodeling spending, but also varies significantly across metro areas. Calculate the simple average of the frequency spending distributions for each spending level category. Adjust the simple average spending distributions by adjustment factors from step 2, part A. Proportionally redistribute the share of owners with projects by spending categories to equal 100 percent. C. In the National File: Apply the adjusted and re-distributed Metro File spending distributions to total number of owners with projects by per-owner spending categories, home value quartiles and metro/non-metro areas in the National File. Calculate the ratio of second-step re-weighted number of owners with projects by spending distribution to the first-step re-weighted number of owners with projects (Appendix D). Apply this ratio to the first-step re-weights (REWEIGHT1) to produce the final homeowner household weight to be used with the 2013 AHS remodeling module (REWEIGHT2). Impact of the Re-Weighting Methodology The two-step re-weighting of homeowner households in the 2013 national AHS results in an increase of 5.9 million owners undertaking projects to 43.5 million and an increase in project incidence share from 49.7 to 57.6 percent (Figure 5). Average improvement spending by homeowners with projects increases 9.7 percent to $8,767 and the total two year home improvement market size increases by $80.9 billion or 26.9 percent. Whereas the originalweighted national AHS estimates that total two-year home improvement spending declined by 16.1 percent from to , the JCHS re-weighted data estimates healthy market growth of 6.5 percent between the two survey periods. 13
16 14
17 Appendix A: Metropolitan Areas Included in the 2013 AHS Metropolitan File By Region NORTHEAST Boston-Cambridge-Quincy, MA-NH Hartford-West Hartford-East Hartford, CT Rochester, NY MIDWEST Minneapolis-St. Paul-Bloomington, MN-WI SOUTH Austin-Round Rock, TX Baltimore-Towson, MD Houston-Sugar Land-Baytown, TX Jacksonville, FL Louisville-Jefferson County, KY-IN Miami-Fort Lauderdale-Miami Beach, FL Oklahoma City, OK Orlando-Kissimmee, FL Richmond, VA San Antonio, TX Tampa-St. Petersburg-Clearwater, FL Nashville-Davidson--Murfreesboro--Franklin, TN Washington-Arlington-Alexandria, DC-VA-MD-WV WEST Las Vegas-Paradise, NV Seattle-Tacoma-Bellevue, WA Tucson, AZ Note: Metropolitan boundaries match 2003 OMB metropolitan area definitions. 15
18 Appendix B: Re-Weighting Variable Categories Used in Step 1: Householder Age Based on AHS Variable: HHAGE Under Household Income Quartiles Based on AHS Variable: ZINC2 Bottom Lower Upper Top Mobility Status Based on AHS Variable: HHMOVE Recent Mover: Moved to current home in 2011, 2012 or 2013 Non-Recent Mover: Moved to current home before 2011 Metro Status Based on AHS Variable: METRO3 Metro: NonMetro: Central city of MSA Inside MSA, but not in central city - urban Inside MSA, but not in central city - rural Outside MSA, urban Outside MSA, rural 16
19 Used in Step 2: Per-Owner Home Improvement Spending, Based on AHS Variable: RAD $0-499 $500-1,499 $1,500-2,999 $3,000-4,999 $5,000-9,999 $10,000-19,999 $20,000-34,999 $35,000+ Home Value Quartiles Based on AHS Variable: VALUE Bottom Lower Upper Top 17
20 18

21 19

22 20
23 References Peng, R A Comparison of the Determinants of Housing Improvement and the Determinants of Maintenance and Repair. Joint Center for Housing Studies of Harvard University, Working Paper W US Census Bureau. December AHS: User Note Regarding Home Improvement Data. Available: 21
The U.S. Housing Confidence Index
 March 2018 www.pulsenomics.com 2014-2018 Pulsenomics LLC Pulsenomics, Housing Confidence Survey, and Housing Confidence Index are trademarks of Pulsenomics LLC. HCI Each Housing Confidence Index (HCI)
MAMA Risk Summary Data through 2011 Q3
 MAMA Risk Summary Data through 2011 Q3 Table of Contents Report Contents... 2 Summary... 3 MAMA Risk Summary Indicators for Largest 50 Metro Areas... 4 Home Prices Risk Indicator Summary Map... 6 Employment
VSIP POSITION LISTING American Federation of Government Employees
 HQ Washington, DC Office of Public Housing Investments Public Housing Revitalization Specialist GS 15 11 Public Housing Revitalization Specialist GS 14 14 Public Housing Revitalization Specialist GS 13
Housing Affordability: Local and National Perspectives
 University of Pennsylvania ScholarlyCommons 2018 ADRF Network Research Conference Presentations ADRF Network Research Conference Presentations 11-2018 Housing Affordability: Local and National Perspectives
NATIONAL ASSOCIATION OF REALTORS RESEARCH DIVISION
 NATIONAL ASSOCIATION OF REALTORS RESEARCH DIVISION COMMERCIAL REAL ESTATE Positive Demand Overcomes Weak Economic Performance in 2014.Q1 George Ratiu Director, Quantitative & Commercial Research First
Market Trends and Outlook
 Residential Remodeling Market Trends and Outlook Kermit Baker Remodeling Futures Conference April 3, 2012 Remodeling Market Overview 1. Home improvement spending totaled an estimated $290 billion last
Estimating National Levels of Home Improvement and Repair Spending by Rental Property Owners
 Joint Center for Housing Studies Harvard University Estimating National Levels of Home Improvement and Repair Spending by Rental Property Owners Abbe Will October 2010 N10-2 2010 by Abbe Will. All rights
FY 2013 Fair Market Rent Documentation System
 Page 1 of 8 FY 2013 Fair Market Documentation System The Final FY 2013 Fort Bend County FMRs for All Sizes The following table shows the Final FY 2013 FMRs by unit bedrooms for Fort Bend County, Texas.
Guide for Estimating Affordability and Cap Exclusions for 2018 Deliveries
 Guide for Estimating Affordability and Exclusions for 2018 Deliveries This is a reference guide for how the percentage excluded from the scorecard cap for an individual deal is calculated. The Multifamily
LUXURY MARKET REPORT. - May
 LUXURY MARKET REPORT - May 2018 - www.luxuryhomeing.com THIS IS YOUR LUXURY MARKET REPORT MAP OF LUXURY RESIDENTIAL MARKETS Welcome to the Luxury Report, your guide to luxury real estate market data and
The Gains from Right to Rent
 The Gains from Right to Rent Dean Baker and Hye Jin Rho July 2009 Center for Economic and Policy Research 1611 Connecticut Avenue, NW, Suite 400 Washington, D.C. 20009 202-293-5380 www.cepr.net CEPR The
Housing Supply Restrictions Across the United States
 Housing Supply Restrictions Across the United States Relaxed building regulations can help labor flow and local economic growth. RAVEN E. SAKS LABOR MOBILITY IS the dominant mechanism through which local
A SIMULATION: MEASURING THE EFFECT OF HOUSING STIMULUS PROGRAMS ON FUTURE HOUSE PRICES
 Research Brief April 2010 First American CoreLogic A SIMULATION: MEASURING THE EFFECT OF HOUSING STIMULUS PROGRAMS ON FUTURE HOUSE PRICES www.facorelogic.com 800.345.7334 2009 First American CoreLogic,
Housing, Construction, and Remodeling Update. Toby Morrison Director of Insights Metrostudy October 12, 2013
 Housing, Construction, and Remodeling Update Toby Morrison Director of Insights Metrostudy October 12, 2013 New Home Sales (Units) "Pro-Worthy" R&R Projects New Homes Sales and Remodeling Are Firmly on
Changing Geography of Improvement Spending
 Changing Geography of Improvement Spending The areas of the country hardest hit by the broader housing market slowdown where house prices and home sales have collapsed and where mortgage defaults and foreclosures
Investor Presentation September 2014
 Investor Presentation September 2014 1 Forward-Looking Statements In addition to historical information, this presentation contains forward-looking statements under the federal securities law. These statements
SHIMBERG CENTER FOR AFFORDABLE HOUSING
 A F F O R D A B L E H O U S I N G ISSUES SHIMBERG CENTER FOR AFFORDABLE HOUSING M.E. Rinker, Sr., School of Building Construction College of Design, Construction & Planning PO Box 115703, University of
The Link Between Middle-Income Housing Affordability and Affordable Housing
 REBIC 2017 FORUM UNCC Downtown Charlotte Campus Wendell Cox 1 February 2017 The Link Between Middle-Income Housing Affordability and Affordable Housing The Link Between Middle-Income Housing Affordability
MANAGEMENT PRESENTATION JUNE Bear Creek Apartments, Dallas, TX
 MANAGEMENT PRESENTATION JUNE 2014 Bear Creek Apartments, Dallas, TX AGENDA Valley Ranch Apartments, Dallas, TX 1. PURE ADVANTAGE Who we are 2. PURE PLAY What we do 3. PURE STRATEGY How we do it 4. PURE
Citi Global Property CEO Conference March 2016
 Citi Global Property CEO Conference March 2016 1 Table of Contents Company Overview 3 6 Multifamily Fundamentals 7 11 Camden s Portfolio 12 18 Real Estate Transactions 19 25 Capital Structure & Liquidity
Rural Development Single Family Housing Guaranteed Loan Program Indiana Income Limits per Household Size
 Rural Development Single Family Housing Guaranteed Loan Program Indiana Income Limits per Household Size WA ME OR CA NV ID AZ UT MT WY CO NM ND SD NE KS MN WI IA MO OK AR IL MS MI OH IN KY TN AL GA WV
More Savings for More Residents: Progress in Multifamily Housing Energy Efficiency
 More Savings for More Residents: Progress in Multifamily Housing Energy Efficiency Stefen Samarripas, Dan York, and Lauren Ross February 2017 Report U1702 American Council for an Energy-Efficient Economy
Do Family Wealth Shocks Affect Fertility Choices?
 Do Family Wealth Shocks Affect Fertility Choices? Evidence from the Housing Market Boom Michael F. Lovenheim (Cornell University) Kevin J. Mumford (Purdue University) Purdue University SHaPE Seminar January
MANAGEMENT PRESENTATION
 MANAGEMENT PRESENTATION SEPTEMBER 2014 RUF.U (USD) RUF.UN (CAD) RUF.DB.U (USD) Bear Creek Apartments, Dallas, TX AGENDA Valley Ranch Apartments, Dallas, TX 1. PURE ADVANTAGE Who we are 2. PURE PLAY What
Foreclosures Continue to Bring Home Prices Down * FNC releases Q Update of Market Distress and Foreclosure Discount
 Foreclosures Continue to Bring Home Prices Down * FNC releases Q4 2011 Update of Market Distress and Foreclosure Discount The latest FNC Residential Price Index (RPI), released Monday, indicates that U.S.
Relationship Between Building Permits, Housing Starts, and Housing Completions
 Relationship Between Building Permits, Housing Starts, and Housing Completions We are frequently asked why the building permits, housing starts, and housing completions series do not match over time, both
Investor Presentation February 2015
 Investor Presentation February 2015 1 Forward-Looking Statements In addition to historical information, this presentation contains forward-looking statements under the federal securities law. These statements
Naturally Occurring Affordable Housing
 Naturally Occurring Affordable Housing NAAHL Annual Conference December 1, 2016 page 1 Slicing And Dicing Rental Housing U.S. Rental Housing Inventory By Units Rent Subsidized 3.3 Million 8% Market Rate
Municipal Finance: Conditions, Local Responses, and Outlook for the Future
 Municipal Finance: Conditions, Local Responses, and Outlook for the Future Chris Hoene, Director, Policy & Research, National League of Cities Michael A. Pagano, Dean, College of Urban Planning & Public
APPENDIX TABLES. Table A-1 Income and Housing Costs, US Totals: Table A-2 Housing Market Indicators:
 APPENDIX TABLES Table A-1 Income and Housing Costs, US s: 1975 2005 Table A-2 Housing Market Indicators: 1975 2005 Table A-3 Terms on Conventional Single-Family Mortgages: 1980 2005 Table A-4 Mortgage
County of Sonoma Agenda Item Summary Report
 Revision No. 20151201-1 County of Sonoma Agenda Item Summary Report Agenda Item Number: 32 (This Section for use by Clerk of the Board Only.) Clerk of the Board 575 Administration Drive Santa Rosa, CA
U.S. GDP (2012 Q Q2)
") U.S. GDP (2012 Q3 2014 Q2) U. S. Employment Employment Recovery Following the Last Two Downturns Rail Traffic: Containers Rail Traffic: Commodities Select Rail Traffic Residential Mortgages Pipeline of
U.S. GDP (2012 Q3 2014 Q2) U. S. Employment Employment Recovery Following the Last Two Downturns Rail Traffic: Containers Rail Traffic: Commodities Select Rail Traffic Residential Mortgages Pipeline of
RETAIL REPORT VIEWPOINT 2018 / COMMERCIAL REAL ESTATE TRENDS. By: Hugh F. Kelly, PhD, CRE IRR.COM AN INTEGRA REALTY RESOURCES PUBLICATION
 RETAIL REPORT VIEWPOINT 2018 / COMMERCIAL REAL ESTATE TRENDS By: Hugh F. Kelly, PhD, CRE Nowhere do we hear more discussion of disruption as in the retail property sector. Ecommerce has a powerful effect,
Investor Presentation March 2017
 Investor Presentation March 2017 1 Table of Contents Company Overview & 2016 Highlights 3 6 Multifamily Fundamentals 7 11 Camden s Portfolio 12 21 Real Estate Transactions 22 28 Capital Structure & Liquidity
STOCKTON, DETROIT, RIVERSIDE-SAN BERNARDINO POST TOP METRO FORECLOSURE RATES ACCORDING TO REALTYTRAC Q METROPOLITAN FORECLOSURE MARKET REPORT
 STOCKTON, DETROIT, RIVERSIDE-SAN BERNARDINO POST TOP METRO FORECLOSURE RATES ACCORDING TO REALTYTRAC Q3 2007 METROPOLITAN FORECLOSURE MARKET REPORT California, Florida and Ohio Cities Account for 17 of
OUR DETAIL IS RETAIL.
 OUR DETAIL IS RETAIL. GILBERT GROUP ADVANTAGE Rooted with local knowledge and experience strengthened by national reach. PROPERTY MANAGEMENT PROJECT LEASING TENANT REPRESENTATION GILBERT GROUP ABOUT US
LUXURY MARKET REPORT. - January
 LUXURY MARKET REPORT - January 2018 - www.luxuryhomemarketing.com THIS IS YOUR LUXURY MARKET REPORT MAP OF LUXURY RESIDENTIAL MARKETS Welcome to the Luxury Market Report, your guide to luxury real estate
Is US Housing Over- or Under-Priced?
 January 4, 2011 Is US Housing Over- or Under-Priced? Some Historical Perspective by Gleb Nechayev CBRE Econometric Advisers Boston, Mass. Gleb.Nechayev@CBRE.com William C. Wheaton Department of Economics
California s Housing Market: How Much Froth Is Out There?
 California s Housing Market: How Much Froth Is Out There? Conference Underwriter Polling Question: What Will Most Likely Occur to California s Housing Prices in the Next 2 Years? 1. Bubble Bursts 15% or
WEBINAR SERIES. Southeast Multifamily Market Assessment. July 21, Southeast Energy Efficiency Alliance
 WEBINAR SERIES Southeast Multifamily Market Assessment July 21, 2016 1 SEEA Serves the Southeast The Southeast Energy Efficiency Alliance (SEEA) promotes energy efficiency as a catalyst for economic growth,
BuildZoom & Urban Economics Lab Index. Quarterly Report: 2015 Q1
 BuildZoom & Urban Economics Lab Index Quarterly Report: 2015 Q1 BuildZoom & Urban Economics Lab Index: First Quarter 2015 Remodeling of existing homes is an indicator of economic health whose importance
Post-Katrina housing affordability challenges continue in 2008, worsening among Orleans Parish very low income renters
 Post-Katrina housing affordability challenges continue in 2008, worsening among Orleans Parish very low income renters Based on 2004, 2007 and 2008 American Community Survey data from the U.S. Census Bureau
LUXURY MARKET REPORT. - November
 LUXURY MARKET REPORT - November 2018 - www.luxuryhomeing.com THIS IS YOUR LUXURY MARKET REPORT MAP OF LUXURY RESIDENTIAL MARKETS Welcome to the Luxury Report, your guide to luxury real estate market data
Release Date: May 21, 2009 March Key Characteristics
 Release Date: May 21, 2009 March 2009 Key Characteristics The RPX 25-MSA Composite has stabilized since January 2009, after being in virtual freefall for much of 2008. The Composite declined only 0.3 percent
Impact of Tax Reform and Jobs Act on Affordable Housing
 WWW.REIS.COM Impact of Tax Reform and Jobs Act on Affordable Housing 1 By Barbara Byrne Denham What does the future look like for the Affordable Housing market? Introduction There are close to 132,000
American Community Survey 5-Year Estimates
 DP04 SELECTED HOUSING CHARACTERISTICS 2006-2010 American Community Survey 5-Year s Supporting documentation on code lists, subject definitions, data accuracy, and statistical testing can be found on the
LUXURY MARKET REPORT. - March
 LUXURY MARKET REPORT - March 2018 - www.luxuryhomemarketing.com THIS IS YOUR LUXURY MARKET REPORT MAP OF LUXURY RESIDENTIAL MARKETS Welcome to the Luxury Market Report, your guide to luxury real estate
ECONOMIC CURRENTS. Vol. 5 Issue 2 SOUTH FLORIDA ECONOMIC QUARTERLY. Key Findings, 2 nd Quarter, 2015
 ECONOMIC CURRENTS THE Introduction SOUTH FLORIDA ECONOMIC QUARTERLY Economic Currents provides an overview of the South Florida regional economy. The report presents current employment, economic and real
HOUSING DISCRIMINATION SURVEY
 HOUSING DISCRIMINATION SURVEY 1. Which part of the United States does your organization serve? (Feel free to check off more than one box.) Northwest (AK, WA, OR and ID). 11.7% 64 West (HI, CA, NV and AZ).
LUXURY MARKET REPORT. - March
 LUXURY MARKET REPORT - March 2018 - www.luxuryhomeing.com THIS IS YOUR LUXURY MARKET REPORT MAP OF LUXURY RESIDENTIAL MARKETS Welcome to the Luxury Report, your guide to luxury real estate market data
Residential Real Estate, Demographics, and the Economy
 Residential Real Estate, Demographics, and the Economy Presented to: Regional & Community Bankers Conference Yolanda K. Kodrzycki Senior Economist and Policy Advisor Federal Reserve Bank of Boston October
Rental Housing Finance Survey* *and a few observations about gubment data. Rich Levy US Census Bureau Washington, DC April 2014
 Rental Housing Finance Survey* *and a few observations about gubment data Rich Levy US Census Bureau Washington, DC April 2014 1 Gubment CYB The views expressed here do not necessarily reflect those of
Rental Housing Affordability in the Southeast: Data from the Sixth District
 NO. 2-18 JULY 218 COMMUNITY & ECONOMIC DEVELOPMENT DISCUSSION PAPER Rental Housing Affordability in the Southeast: Data from the Sixth District Ann Carpenter Federal Reserve Bank of Atlanta Douglas White
LUXURY MARKET REPORT. - February
 LUXURY MARKET REPORT - February 2018 - www.luxuryhomeing.com THIS IS YOUR LUXURY MARKET REPORT MAP OF LUXURY RESIDENTIAL MARKETS Welcome to the Luxury Report, your guide to luxury real estate market data
American Community Survey 5-Year Estimates
 DP04 SELECTED HOUSING CHARACTERISTICS 2011-2015 American Community Survey 5-Year Estimates Note: This is a modified view of the original table. Supporting documentation on code lists, subject definitions,
VERMONT S RENTAL HOUSING AFFORDABILITY GAP CONTINUES TO GROW The Average Vermont Renter Can t Afford a Modest 2-Bedroom Apartment
 vermont affordable housing coalition FOR IMMEDIATE RELEASE: June 13, 2016 CONTACT: Erhard Mahnke, 802.233.2902, erhardm@vtaffordablehousing.org Renée Sarao, 802.660.9484, renee.vahc@gmail.com VERMONT S
TEXAS LUXURY HOME SALES REPORT Edition
 TEXAS LUXURY HOME SALES REPORT 2018 Edition ABOUT THE TEXAS LUXURY HOME SALES REPORT The 2018 edition of the Texas Luxury Home Sales Report is provided by the Data Relevance Project, a partnership among
U.S. Foreclosure Activity Increases 2 Percent in July Boosted by 6 Percent Increase in Foreclosure Starts
 August 13, 2013 By RealtyTrac Staff U.S. Foreclosure Activity Increases 2 Percent in July Boosted by 6 Percent Increase in Foreclosure Starts Bank Repossessions Up 4 Percent From Previous Month, 29 States
U.S. Economic and Institutional Apartment Market Overview and Outlook. January 7, 2015
 U.S. Economic and Institutional Apartment Market Overview and Outlook January 7, 2015 Emerging Economic Trends Inflation Adjusted Crude Oil Prices In Alignment with Long-Term Average Price per Barrel (Nov.
The State of the Commercial Real Estate Industry: Mid-Year 2010 Retail Review & Outlook
 The State of the Commercial Real Estate Industry: Mid-Year 2010 Retail Review & Outlook Copyright 2010 CoStar Realty Information, Inc. No reproduction or distribution without permission. The following
List of 2009 Round Allocations
 List of 2009 Round Allocations CDFI 601 Thirteenth Street, NW, Suite 200, South, Washington, DC 20005 (202) 622-8662 9 10 CDFI 601 Thirteenth Street, NW, Suite 200, South, Washington, DC 20005 (202) 622-8662
Fannie Mae Affordable Lender Meeting
 Fannie Mae Affordable Lender Meeting MAH Madness November 13, 2017 2017 Fannie Mae. Trademarks of Fannie Mae. Millions Our Stat Sheet Team Name: Multifamily Affordable Housing (MAH) $5,000 $4,500 $4,000
Increasing Foreclosures Could Hurt Demand for Homes, Slowing Housing Recovery
 Release Date: April 22, 2010 February 2010 Quinn W. Eddins, Director of Research New Radar Logic data packages are available at /productsservices_analytics.html Increasing Foreclosures Could Hurt Demand
OFFICE OF PERSONNEL MANAGEMENT. 5 CFR Part 531 RIN: 3206-AM88. General Schedule Locality Pay Areas
 This document is scheduled to be published in the Federal Register on 10/27/2015 and available online at http://federalregister.gov/a/2015-27380, and on FDsys.gov 6325-39 OFFICE OF PERSONNEL MANAGEMENT
2015 New York City. Housing Security Profile and Affordable Housing Gap Analysis
 2015 New York City Housing Security Profile and Affordable Housing Gap Analysis 1 Contents: Housing Insecurity in New York City 3 A City of Renters. 6 Where the Housing Insecure Population Lives 16 Housing
Cost of Living Comparisons: Valdosta, Georgia, and the Nation Third Quarter 2009 October 23, 2009
 Overview In the third quarter of 2009, survey data suggest that the cost of living for middle management households in Georgia communities is about 8.3 percent less, on average, than in the rest of the
SPECIAL REPORT. Single-Family Rent Index: H Review
 SPECIAL REPORT Rent Index: H1 2018 Review FEBRUARY 2018 1 National Overview Single-family rentals make up one-half of all residential rentals but are an overlooked segment of the housing market. Much like
George Mason and Hofstra Universities July 2011
 The American Housing Survey Suburbs and the 2010 Census George Mason and Hofstra Universities July 2011 Topics About the American Housing Survey (AHS) Accessing the AHS Public versus Internal Use Files
Recovery? Growth? Jobs? Capital Investment?
 Recovery? Growth? Jobs? Capital Investment? Turning the Corner? Presented by Dr. Ivan Miestchovich, Jr., Director Institute for Economic Development & Real Estate Research The University of New Orleans
High-priced homes have a unique place in the
 Livin' Large Texas' Robust Luxury Home Market Joshua G. Roberson December 3, 218 Publication 2217 High-priced homes have a unique place in the overall housing market. Their buyer pool, home characteristics,
ECONOMIC CURRENTS. Vol. 4, Issue 3. THE Introduction SOUTH FLORIDA ECONOMIC QUARTERLY
 ECONOMIC CURRENTS THE Introduction SOUTH FLORIDA ECONOMIC QUARTERLY Vol. 4, Issue 3 Economic Currents provides an overview of the South Florida regional economy. The report presents current employment,
National Housing Trends
 National Housing Trends 34% America s Choice of Best Long Term Investment 26% 17% 15% 6% Real Estate Stocks / Mutual Funds Gold Savings Accounts / CDs Bonds Gallup 2018 Total Existing Home Sales in thousands
American Community Survey 5-Year Estimates
 DP04 SELECTED HOUSING CHARACTERISTICS 2007-2011 American Community Survey 5-Year Estimates Supporting documentation on code lists, subject definitions, data accuracy, and statistical testing can be found
The State of the Nation s Housing 2007: A Sneak Peek
 The State of the Nation s Housing 2007: A Sneak Peek Eric Belsky Remodeling Futures Conference April 10, 2007 Do Not Distribute Embargoed Until June 11, 2007 www.jchs.harvard.edu The Homebuilding Correction
The Subject Section. Chapter 2. Property Address
 Chapter 2 The Subject Section The SUBJECT section of the URAR introduces the appraisal assignment by presenting important information about the subject property. The SUBJECT section provides spaces for
State of the Nation s Housing 2008: A Preview
 State of the Nation s Housing 28: A Preview Eric S. Belsky Remodeling Futures Conference April 15, 28 www.jchs.harvard.edu The Housing Market Has Suffered Steep Declines Percent Change Median Existing
SELECTED HOUSING CHARACTERISTICS American Community Survey 5-Year Estimates
 DP04 SELECTED HOUSING CHARACTERISTICS 2008-2012 American Community Survey 5-Year Estimates Supporting documentation on code lists, subject definitions, data accuracy, and statistical testing can be found
(904) (904)
 (904)") Press Release For more information: Media contact: Investor contact: Michelle Kersch Nancy Murphy (904) 854-5043 (904) 854-8640 michelle.kersch@lpsvcs.com nancy.murphy@lpsvcs.com LPS Home Price Index Report:
Press Release For more information: Media contact: Investor contact: Michelle Kersch Nancy Murphy (904) 854-5043 (904) 854-8640 michelle.kersch@lpsvcs.com nancy.murphy@lpsvcs.com LPS Home Price Index Report:
Real Estate Investor Market Research Report. Real Estate IRA Investment Trends & Insights
 2017 Real Estate Investor Market Research Report Real Estate IRA Investment Trends & Insights Contents Introduction... 2 Entrust IRA Real Estate Investment Trends... 3 Where Investors Bought Real Estate...
ULI Houston Suburban Trends Marketplace Gadi Kaufmann, CEO RCLCO
 ULI Houston Suburban Trends Marketplace 2016 Gadi Kaufmann, CEO RCLCO April 7, 2016 gkaufmann@rclco.com www.rclco.com BEST MINDS IN REAL ESTATE Best Minds in Real Estate : A multidisciplinary team The
STATE OF THE MULTIFAMILY MARKET MACRO VIEW
 STATE OF THE MULTIFAMILY MARKET MACRO VIEW JEANETTE I. RICE, CRE AMERICAS HEAD OF MULTIFAMILY RESEARCH APRIL 19, 2018 Westchester/ Fairfield 2 JEANETTE I. RICE STATE OF U.S. MULTIFAMILY MARKET KEY INVESTMENT
Apartments: A $1.3 Trillion Market
 Apartments: A $1.3 Trillion Market A Research Report from the National Multi Housing Council Prepared by the Rosen Consulting Group Kenneth T. Rosen Susan U. Persin Daniel T. VanDyke Jeanine Kranitz This
HOUSING MARKETS IN CASEY METROS: WHAT HAS HAPPENED SINCE 2000?
 ANNIE E. CASEY FOUNDATION MAKING CONNECTIONS INITIATIVE HOUSING MARKETS IN CASEY METROS: WHAT HAS HAPPENED SINCE 2000? G. Thomas Kingsley and Beata Bajaj January 2005 THE URBAN INSTITUTE WASHINGTON, DC
Briefing Book. State of the Housing Market Update San Francisco Mayor s Office of Housing and Community Development
 Briefing Book State of the Housing Market Update 2014 San Francisco Mayor s Office of Housing and Community Development August 2014 Table of Contents Project Background 2 Household Income Background and
April 4, p.m. Eastern
 April 4, 2017 2 p.m. Eastern Worldwide ERC would like to thank today s sponsor: 2017 Worldwide ERC Tips and Tools for Understanding the U.S. Real Estate Market, and Its Impact on Your Relocation Program
MANAGEMENT PRESENTATION
 MANAGEMENT PRESENTATION NOVEMBER 2014 RUF.U (USD) RUF.UN (CAD) RUF.DB.U (USD) Bear Creek Apartments, Dallas, TX WHY PURE MULTI-FAMILY REIT LP Fairways at Prestonwood, Dallas, TX 1 2 Significant organic
By several measures, homebuilding made a comeback in 2012 (Figure 6). After falling another 8.6 percent in 2011, single-family
. After falling another 8.6 percent in 2011, single-family") 2 Housing Markets With sales picking up, low inventories of both new and existing homes helped to firm prices and spur new single-family construction in 212. Multifamily markets posted another strong year,
2 Housing Markets With sales picking up, low inventories of both new and existing homes helped to firm prices and spur new single-family construction in 212. Multifamily markets posted another strong year,
MULTIFAMILY REPORT VIEWPOINT 2018 / COMMERCIAL REAL ESTATE TRENDS. By: Hugh F. Kelly, PhD, CRE IRR.COM AN INTEGRA REALTY RESOURCES PUBLICATION
 MULTIFAMILY REPORT VIEWPOINT 2018 / COMMERCIAL REAL ESTATE TRENDS By: Hugh F. Kelly, PhD, CRE Just when the upcycle for rental apartments seemed to be approaching its peak, along came the Tax Act of 2017,
TARRANT COUNTY HOUSING ASSISTANCE OFFICE 2018 LANDLORD SEMINAR
 TARRANT COUNTY HOUSING ASSISTANCE OFFICE 2018 LANDLORD SEMINAR 1 HUD UPDATES 2 UNIFORM PHYSICAL CONDITION STANDARDS FOR VOUCHERS UPCS-V Improved method for Inspecting housing unit Reduce subjectivity to
DEPARTMENT OF HOUSING AND URBAN DEVELOPMENT. [Docket No. FR-]
![DEPARTMENT OF HOUSING AND URBAN DEVELOPMENT. [Docket No. FR-]](/thumbs/85/92577953.jpg "DEPARTMENT OF HOUSING AND URBAN DEVELOPMENT. [Docket No. FR-]") DEPARTMENT OF HOUSING AND URBAN DEVELOPMENT [Docket No. FR-] Proposed Fair Market Rents for the Housing Choice Voucher Program, Moderate Rehabilitation Single Room Occupancy Program and Other Programs
DEPARTMENT OF HOUSING AND URBAN DEVELOPMENT [Docket No. FR-] Proposed Fair Market Rents for the Housing Choice Voucher Program, Moderate Rehabilitation Single Room Occupancy Program and Other Programs
federal register Department of Housing and Urban Development Part II Friday October 1, 1999
 federal register Friday October 1, 1999 Part II Department of Housing and Urban Development 24 CFR Part 888 Fair Market Rents for the Section 8 Housing Assistance Payments Program Fiscal Year 2000; Final
Pennsbury Professional Center 201 Woolston Drive Morrisville, PA
 Pennsbury Professional Center 201 Woolston Drive Morrisville, PA A VALUE-ADD MEDICAL OFFICE OPPORTUNITY WITH CONVENIENT ACCESS TO ROUTE 1 AND DENSE SURROUNDING POPULATION INVESTMENT SUMMARY Page 1 EXECUTIVE
April 2015, Volume 24 Issue 4. Q Round Up
 April 2015, Volume 24 Issue 4 Q1 2015 Round Up Wayne Williams President, ALN Apartment Data, Inc. Wayne@alndata.com Evan Takacs Account Executive 1.800.643.6416 x 220 Evan@alndata.com Laura Reese-Williams,
Investor Presentation December 2017
 Investor Presentation December 2017 Cautionary Statement This presentation includes statements concerning our expectations, beliefs, plans, objectives, goals, strategies, future events or performance and
Slicing, Dicing, and Scoping the Size of the U.S. Commercial Real Estate Market
 Slicing, Dicing, and Scoping the Size of the U.S. Commercial Real Estate Market Executive Summary. We use a Census approach to calculate the size of the built commercial real estate market in the United
Modeling Housing Affordability in Corpus Christi, Texas
 Modeling Housing Affordability in Corpus Christi, Texas December 13, 2018 Overview I. Background II. Owner-Occupied Housing Affordability III. Renter-Occupied Housing Affordability IV. Future Housing Needs
The Housing Bust and Housing Affordability: Where do we stand?
 The Housing Bust and Housing ffordability: Where do we stand? Robert Clifford, Policy nalyst New England Public Policy Center ederal Reserve Bank of Boston Bringing Workers Home 2011 Regional orum on Workforce
DEPARTMENT OF HOUSING AND URBAN DEVELOPMENT. [Docket No. FR-6125-N-02]
![DEPARTMENT OF HOUSING AND URBAN DEVELOPMENT. [Docket No. FR-6125-N-02]](/thumbs/94/120788953.jpg "DEPARTMENT OF HOUSING AND URBAN DEVELOPMENT. [Docket No. FR-6125-N-02]") This document is scheduled to be published in the Federal Register on 03/14/2019 and available online at https://federalregister.gov/d/2019-04691, and on govinfo.gov DEPARTMENT OF HOUSING AND URBAN DEVELOPMENT
This document is scheduled to be published in the Federal Register on 03/14/2019 and available online at https://federalregister.gov/d/2019-04691, and on govinfo.gov DEPARTMENT OF HOUSING AND URBAN DEVELOPMENT
Welcome. Introductions Nature Expectations Agenda Timing. Home Sweet Home 2
 Welcome Introductions Nature Expectations Agenda Timing Home Sweet Home 2 Objectives Role of Relocation Program Role of Housing Programs Budgeting Research Neighborhood Rent vs. Buy Decision Making Rental
Department of Housing and Urban Development
 Monday, September 30, 2002 Part II Department of Housing and Urban Development Fair Market Rents for the Housing Choice Voucher Program and Moderate Rehabilitation Single Room Occupancy Program Fiscal