REALTORS CONFIDENCE INDEX SURVEY Report on the April 2017 Survey
|
|
|
- Meredith Gregory
- 5 years ago
- Views:
Transcription

1
2 REALTORS CONFIDENCE INDEX SURVEY Report on the April 2017 Survey The REALTORS Confidence Index (RCI) report provides monthly information about real estate market conditions and expectations, buyer/seller traffic, price trends, buyers characteristics, and issues affecting real estate transactions based on a monthly survey of REALTORS. The April 2017 report is based on the responses of 3,472 REALTORS, 1,883 of whom closed a sale. 1 Respondents reported on local market conditions experienced in April and the characteristics of their most recent sale for the month. The National Association of REALTORS (NAR) collects the data from a random sample of REALTORS and the data is viewed to be representative of the sales for the month. NAR conducted the online survey from May 2 10, To correct for over- or under- response at the state level, NAR weights the responses by a factor that aligns the sample distribution of responses to the distribution of NAR membership. All real estate is local: conditions in specific markets vary from the overall national trends presented in this report. REALTORS may be interested in comparing their markets against the national summary. The RCI report is an output of the Research Division of the NATIONAL ASSOCIATION of REALTORS. 2 For questions or information about this report, please dhale@realtors.org. Lawrence Yun, Senior Vice President and Chief Economist Danielle Hale, Managing Director, Housing Research Gay Cororaton, Research Economist Meredith Dunn, Research Communications Manager Research Division NATIONAL ASSOCIATION of REALTORS 500 New Jersey Avenue, NW Washington, DC The survey is sent to 50,000 REALTORS who are selected through simple random sampling. To increase the response rate, the survey is also sent to respondents in the previous three surveys who provided their addresses. The number of responses to a specific question varies because the question may not be applicable to the respondent or because of non-response. To encourage survey participation, ten REALTORS are randomly selected to receive a gift card. 2 The team acknowledges Jessica Lautz, Managing Director, Survey Research and Communications, Amanda Riggs, Research Survey Analyst, and Brandi Snowden, Research Survey Analyst, for their inputs in improving the survey and in editing and disseminating the report. Acknowledgement also goes to Lisa Herceg, Director, Marketing Research, who sends out the survey to members. 1
3 Table of Contents Summary... 3 I. Market Conditions... 4 REALTORS Reported Strong Buyer Traffic and Tight Supply... 4 REALTORS Are Generally Optimistic Over the Next Six Months... 7 REALTORS Reported More Properties Were Sold at or Above the Asking Price... 9 REALTORS Expect Sustained Price Growth in the Next 12 Months Properties Typically on the Market for 29 Days II. Buyer and Seller Characteristics Sales to First-Time Buyers: 34 Percent of Sales Distressed Sales: Five Percent of Sales Sales for Investment Purposes: 15 Percent of Sales Cash Sales: 21 Percent of Sales Fewer First-time Buyers Are Making a Low Downpayment III. Issues Affecting Transactions Contract Settlement: Financing, Home Inspection, and Appraisals Are Major Issues Issues Reported by REALTORS
4 Summary While local conditions vary, the REALTORS Buyer Traffic Index and the REALTORS Confidence Index Current Conditions for single-family homes, townhomes, and condominiums remained above 50 in April 2017, indicating that more respondents reported strong than weak conditions. Both indices were higher than their levels one year ago and in the previous month, except the condominium index which was at the same level as the previous month. 3 The REALTORS Seller Traffic Index was unchanged from its level one year ago, but it increased from its level in the previous month. It has remained below 50 since March 2008, indicating that seller activity is still weak. First-time homebuyers accounted for 34 percent of sales. 4 Amid sustained job creation, the share of firsttime homebuyers has been on a modest rise, up from 29 percent in With fewer new foreclosures, distressed properties accounted for five percent of sales, purchases for investment purposes made up 15 percent of sales, and cash sales accounted for 21 percent of sales. Amid tight supply, half of properties that sold in April 2017 were on the market for 29 days or less compared to 39 days in April The April median days on market measure is a new low in this history of the series which goes back to Lack of homes for sale was the main issue reported by REALTORS. Respondents reported a mixed effect from the uptick in mortgage rates since November 2016; some buyers are encouraged to act quickly while others are discouraged by diminished affordability. With sales typically strong in the summer, more respondents expect the outlook to be strong than weak in the next six months compared to current conditions in the single-family, townhome, and condominium markets. April 2017 REALTORS Confidence Index Survey Highlights Apr-17 Mar-17 Apr-16 RCI Buyer Traffic Index RCI Seller Traffic Index RCI Current Conditions: Single-Family Sales RCI Six-Month Outlook: Single-Family Sales First-Time Home Buyers, as Percent of Sales Sales to Investors, as Percent of Sales Cash Sales, as Percent of Sales Distressed Sales, as Percent of Sales Median Days on Market Sold at Original List Price or Premium, as Percent of Sales Median Expected Price Growth in Next 12 Months (%) An index greater than 50 indicates the number of respondents who reported strong (index=100) outnumbered those who reported weak (index=0). An index equal to 50 indicates an equal number of respondents reporting strong and weak market conditions. The index is not adjusted for seasonality effects. 4 NAR s 2016 Profile of Home Buyer and Sellers (HBS) reports that among primary residence home buyers, 35 percent were first-time home buyers, up from 32 percent in The HBS surveys primary residence home buyers, while the monthly RCI Survey surveys REALTORS and captures purchases for investment purposes and vacation/second homes. 3
5 I. Market Conditions REALTORS Reported Strong Buyer Traffic and Tight Supply The REALTORS Buyer Traffic Index registered at 75 in April 2017 (74 in March 2017; 70 in April 2016), indicating that more respondents viewed buyer traffic conditions as strong rather than weak. 5 Homebuying demand is likely being bolstered by sustained job growth, with 2.2 million jobs added in the last 12 months and 16.3 million jobs generated since February The unemployment rate fell to 4.4 percent in April 2017, the lowest rate since the economic recovery from the recession. Future interest rate increases may also be prompting first-time homebuyers to take advantage of the current mortgage rates. In the week of May 11, the 30-year fixed mortgage rate averaged 4.05 percent; rates have held above four percent since the week of November 24, 2016, except during the week of April 20 when they dipped briefly to 3.97 percent. 7 Mortgage rates are likely to continue to rise modestly to an average of 4.3 percent in 2017 and 5.0 percent in The REALTORS Seller Traffic Index registered at 46 in April 2017 (43 in March 2017; 46 in April 2016), indicating that more respondents viewed seller traffic conditions as weak rather than strong. Supply conditions have remained largely tight in many areas, with the index registering below 50 since March REALTORS Buyer and Seller Traffic Indexes as of April Buyer Traffic Index Seller Traffic Index 5 The REALTORS Buyer Traffic Index provides information on the level of homebuying demand or interest, which may materialize as a contract to purchase or closed sale after two or three months. 6 The last 12 months refers to April 2016 to April Nearly 8.7 million jobs were lost from February 2008 February 2010, so the gain above previous peak employment is 7.6 million jobs. 7 Mortgage rates in this report refer to the average contract rates on 30-year conventional mortgages reported by Freddie Mac. 8 NAR forecast. See pdf. 4
6 Local conditions vary in each state, but the REALTORS Buyer Traffic Index indicates that buyer traffic conditions can be characterized as moderate to very strong in all states and in the District of Columbia. 9 The REALTORS Seller Traffic Index indicates seller traffic conditions were very weak to weak in many states, but conditions were moderate to strong in the District of Columbia and in 22 states, which includes oil-producing states that have been impacted by the collapse in oil prices since the middle of Respondents reported that demand is strong, but supply is lacking, especially homes that are affordable to buyers. This is consistent with available data on the affordability of active housing inventory To increase the number of observations for each state, NAR computes the index based on data for the last three months. Small states such as AK, ND, SD, MT, VT, WY, WV, DE, and D.C., may have fewer than 30 observations. The survey asks, How do you rate the past month's buyer/seller traffic in the neighborhood(s) or area(s) where you make most of your sales? Respondents rated conditions or expectations as Strong (100), Moderate (50), and Weak (0). NAR compiles the responses into a diffusion index. For graphical purposes, index values 25 and lower are labeled Very Weak, values greater than 25 to 45 are labeled Weak, values greater than 45 to 55 are labeled Moderate, values greater than 55 to 75 are labeled Strong, and values greater than 75 are labeled Very Strong. The range of +/-5 around 50 approximates the historical margins of error at the 95 percent confidence level for small states. 10 Oil prices refer to the West Texas Intermediate average spot price. While the price of oil has picked up in the last year, the April 2017 price was roughly half the price that prevailed in Summer 2014 before the collapse, so oil-dependent economies may see some improvement, but generally remain at a low level. 11 See for example: and 5

7 Employment conditions affect the supply and demand for housing. Nationally, employment rose 1.6 percent in April 2017 compared to April Employment growth was strongest in Utah, Georgia, and Florida. In these states, buyer traffic was strong to very strong. Non-farm employment contracted in the oil-producing states of Alaska, Wyoming, Oklahoma, Louisiana, Mississippi, as well as in West Virginia. 12 In some of these states, the job cutbacks have led to moderate seller traffic conditions, based on the REALTORS Seller Traffic Index. Texas, which has a more diversified economy, has been more resilient than other oil-producing states, with employment growing slightly above the national average. 12 Source: U.S. Department of Energy. See 6
8 Major Oil Producers Based on Share of State's Oil Production to State GDP 70% 60% 50% 40% 30% 20% 10% 0% Source: NAR Calculations REALTORS Are Generally Optimistic Over the Next Six Months With spring and summer rolling in, the REALTORS Confidence Index Six-Month Outlook for singlefamily homes, townhomes, and condominiums each registered above 50, indicating that more REALTOR respondents expected market conditions to be strong than weak over the next six months compared to current conditions REALTORS Confidence Index Six-Month Outlook as of April Single-family Townhome Condominium 13 The survey asks, What are your expectations for the housing market over the next six months compared to the current state of the market in the neighborhood(s) or area(s) where you make most of your sales? NAR compiles the responses into a diffusion index. An index of 50 indicates a balance of respondents having weak (index=0) and strong (index=100) expectations or all respondents having moderate (=50) expectations. The index is not adjusted for seasonality. 7
9 The index for condominiums was at 59 in April 2017 (61 in March 2017; 53 in April 2016). The approval of H.R. 3700, the Housing Opportunity Through Modernization Act of 2016, appears to be bolstering homebuying in the condominium market. 14 Among other measures, the law eases access to FHA condominium financing by reducing the FHA condominium owner occupancy ratio from 50 to 35 percent, directing the FHA to streamline the condominium re-certification process, and providing more flexibility for mixed-use buildings. In the single-family homes market, the outlook in the next six months compared to current conditions is strong to very strong in all states and moderate in the District of Columbia. 15 In the townhomes market, the outlook is moderate to very strong except in Oklahoma and West Virginia where the outlooks are weak. The outlook in the condominiums market is more mixed, with a very weak outlook in West Virginia, a weak outlook in eight states and the District of Columbia, and a moderate to very strong outlook in the other states The bill, which was championed by NAR, passed the House of Representatives and the Senate under unanimous consent on July 14, 2016 and was signed by President Obama on July 29, See 15 To increase the number of observations for each state, the index is based on data for the last three months. Small states such as AK, ND, SD, MT, VT, WY, WV, DE, and D.C., may have fewer than 30 observations. Respondents rated conditions or expectations as Strong (100), Moderate (50), and Weak (0). NAR compiles the responses into a diffusion index. A diffusion index greater than 50 means that more respondents rated conditions as Strong than Weak. For graphical purposes, index values 25 and lower are labeled Very Weak, values greater than 25 to 45 are labeled Weak, values greater than 45 to 55 are labeled Moderate, values greater than 55 to 75 are labeled Strong, and values greater than 75 are labeled Very Strong. The range of +/-5 around 50 approximates the historical margins of error at the 95 percent confidence level for small states. 16 See for example this review: 8
.")
10 REALTORS Reported More Properties Were Sold at or Above the Asking Price As conditions are competitive for buyers, offers continue to be high relative to asking price; 45 percent of properties sold at or above the original listing price (42 percent in March 2017; 41 percent in April 2016). Eighteen percent of properties sold above the asking price (15 percent in March 2017; 15 percent in April 2016). When this survey first gathered this information in April 2012, only 28 percent of properties sold at or above the original list price. This measure tends to reach its peak sometime between April and June each year. 9
11 Percent of Properties Sold at Original Price or at Net Premium from the Listing Price as of April % 45% 40% 45% 35% 30% 25% 20% REALTORS Expect Sustained Price Growth in the Next 12 Months Among REALTORS who responded to the April 2017 survey, the median expected home price change in the next 12 months was 4.2 percent (4.0 percent in March 2017; 3.8 percent in April 2016). 17 Lack of supply amid strong demand has continued to push up home prices. The map below shows the median expected price change of the respondents in the next 12 months at the state level. 18 In 10 West states, led by Washington, Utah, and Colorado, the median expected price growth is in the range of five to seven percent. The oil-producing states have the lowest median expected price change in the next 12 months at two to three percent. 17 The median expected price change is a measure that represents the middle value of the distribution of responses. 18 To increase the number of observations for each state, NAR uses data from the last three surveys. 10

12 Looking at the values over time in selected states, the median expected price change appears to be increasing again, indicating that respondents expect demand to remain strong, even as home prices continue to rise. 19 In 39 states, the expected price change in the next 12 months is higher than the expected price change one year ago Oct2012-Dec2012 REALTORS Median Expected Price Change Over the Next 12 Months in Selected West States Jan2013-Mar2013 Apr2013-Jun2013 Jul2013-Sep2013 Oct2013-Dec2013 Jan2014-Mar2014 Apr2014-Jun2014 Jul2014-Sep2014 Oct2014-Dec2014 Jan2015-Mar2015 Apr2015-Jun2015 Jul2015-Sep2015 Oct2015-Dec2015 Jan2016-Mar2016 Apr2016-Jun2016 Jul2016-Sep2016 Oct2016-Dec2016 Jan2017-Mar2017 CA OR WA AZ CO 19 The selected states shown in these charts are those with approximately 150 observations. 11
13 REALTORS Median Expected Price Change Over the Next 12 Months in Selected South States Oct2012-Dec2012 Jan2013-Mar2013 Apr2013-Jun2013 Jul2013-Sep2013 Oct2013-Dec2013 Jan2014-Mar2014 Apr2014-Jun2014 Jul2014-Sep2014 Oct2014-Dec2014 Jan2015-Mar2015 Apr2015-Jun2015 Jul2015-Sep2015 Oct2015-Dec2015 Jan2016-Mar2016 Apr2016-Jun2016 Jul2016-Sep2016 Oct2016-Dec2016 Jan2017-Mar2017 FL GA NC SC TN VA TX Oct2012-Dec2012 REALTORS Median Expected Price Change Over the Next 12 Months in Selected Midwest States Jan2013-Mar2013 Apr2013-Jun2013 Jul2013-Sep2013 Oct2013-Dec2013 Jan2014-Mar2014 Apr2014-Jun2014 Jul2014-Sep2014 Oct2014-Dec2014 Jan2015-Mar2015 Apr2015-Jun2015 Jul2015-Sep2015 Oct2015-Dec2015 Jan2016-Mar2016 Apr2016-Jun2016 Jul2016-Sep2016 Oct2016-Dec2016 Jan2017-Mar2017 IL MI OH WI 12
14 Oct2012-Dec2012 REALTORS Median Expected Price Change Over the Next 12 Months in Selected Northeast States Jan2013-Mar2013 Apr2013-Jun2013 Jul2013-Sep2013 Oct2013-Dec2013 Jan2014-Mar2014 Apr2014-Jun2014 Jul2014-Sep2014 Oct2014-Dec2014 Jan2015-Mar2015 Apr2015-Jun2015 Jul2015-Sep2015 Oct2015-Dec2015 Jan2016-Mar2016 Apr2016-Jun2016 Jul2016-Sep2016 Oct2016-Dec2016 Jan2017-Mar2017 MA NJ NY PA Properties Typically on the Market for 29 Days Properties stayed on the market for fewer days in April 2017 compared to one year ago, amid strong demand and tight supply. Nationally, properties sold in April 2017 were typically on the market for 29 days (34 days in March 2017; 39 days in April 2016). 20 This is the shortest time on market since the survey began tracking this measure in The length of time properties are on the market has fallen as demand has outpaced the inventory of homes for sale. In 2011, properties were typically on the market for 97 days Median Days on Market of Sales Reported by REALTOR Respondents as of April 2017 All: 29 Foreclosed: 46 Short sale: 88 Non-distressed: All Foreclosed Short sale Non-distressed 20 The survey asks, For the last house that you closed in the past month, how long was it on the market from listing time to the time the seller accepted the buyer s offer? The median is the number of days at which half of the properties stayed on the market. 13
15 Nationally, 52 percent of properties that sold in April 2017 were on the market for less than a month (48 percent in March 2017; 45 percent in April 2016). 21 Only 10 percent of properties were on the market for six months or longer (11 percent in March 2017; 13 percent in April 2016). 60% 50% Percentage Distribution of Time on Market of Sales Reported by REALTOR Respondents as of April 2017 (In Months) 52% 45% 40% 30% 20% 10% 0% 15% 15% 11% 9% 8% 7% 4% 4% 4% 3% 6% 4% 3% 4% 3% 3% <1 1 to <2 2 to <3 3 to <4 4 to <5 5 to <6 6 to <9 9 to < The chart below shows the median days on market by state. 22 Properties that sold in February April 2017 were typically on the market for less than 31 days in 18 states and in the District of Columbia. Looking at the values over the last few years, in most states the median length of time that properties stay on the market has trended downwards, though the graphs also show that days on market in some states fluctuate seasonally Days on market usually refers to the time from listing date to contract date. 22 In generating the median days on market at the state level, NAR uses data for the last three surveys to have close to 30 observations. Small states such as AK, ND, SD, MT, VT, WY, WV, DE, and D.C., may have fewer than 30 observations. 23 To increase the number of observations for each state, NAR uses data from the last three surveys. The selected states shown in these charts are those with approximately 150 observations. 14

16 Median Days on Market of Sales Reported by REALTORS in Selected West States AZ CA CO WA 15
17 Median Days on Market of Sales Reported by REALTORS in Selected South States FL GA NC VA TX Median Days on Market of Sales Reported by REALTORS in Selected Midwest States IL MI OH WI 16
18 Median Days on Market of Sales Reported by REALTORS in Selected Northeast States MA NJ NY PA Sales to First-Time Buyers: 34 Percent of Sales II. Buyer and Seller Characteristics Sales to first-time homebuyers accounted for 34 percent of residential sales in April 2017 (32 percent in March 2017; 32 percent in April 2016). Sustained job and income growth are likely supporting the increase in purchases from first-time homebuyers. The anticipation of further increases in interest rates may also have prompted first-time buyers to enter the market. 24 The aging of the Millennial generation may additionally be underpinning the continued, albeit modest, increase in homebuying by first-time buyers. The chart below shows the population most likely to be first-time home buyers those aged 25 to 34 is projected to continue to increase through 2024 at which point many Millennials will have aged out of this age group. The population in the 25 to 34 years old group will remain stable as the Gen Z cohort moves into this age group Mortgage rates in this report refer to the average contract rates on 30-year conventional mortgages reported by Freddie Mac. The average 30-year mortgage rate was 3.54 percent in the week of November 3, It broke above four percent, to 4.03 percent, in the week of November 24, and it climbed to 4.30 percent in the week of March 16. The average rate stood at 4.05 percent in the week of May 11, The U.S. Census Bureau identifies Millennials as those born from 1982 to The Gen Z group are those born after
19 First-time Buyers as Percent of Residential Market as of April % 50% 40% 30% 32% 20% 10% 0% Population Age Years Old Millions Source: U.S. Census Bureau Population Projections Buyers 34 years old and younger, who are likely to be first-time buyers, accounted for 30 percent of residential buyers in April 2017 (31 percent in March 2017; 30 percent in April 2016). The share of buyers 34 years and younger appears to be on a gradual uptrend from the 26 percent share in July 2013 when this information was first collected in the survey NAR s 2016 Profile of Home Buyer and Sellers (HBS) reports that among primary residence home buyers, 28 percent were years old. The HBS surveys primary residence home buyers, while the monthly RCI Survey surveys REALTORS and captures purchases for investment purposes and vacation/second homes. 18
20 60% 50% 40% 30% 20% 10% 0% 52% 26% 22% Age Distribution of Buyers for Sales Reported by REALTOR Respondents as of April % 30% 22% Age 34 and under Age 35 to 55 Age 56 and over Homebuyers who were renting prior to their recent home purchase accounted for 43 percent of sales in April 2017 (43 percent in March 2017; 40 percent in April 2016). The fraction of buyers who were renting prior to their recent home purchase has increased from the 36 percent share in March 2014 when this information was first collected. 27 At the same time, the share of buyers who were living in their own home at the time of their recent home purchase has decreased. 60% 50% 40% 30% 20% 10% 0% Living Status of Homebuyers at Time of Home Purchase as of April % 48% 36% 43% 9% Rents an apartment or house Lives in own home Lives with parents, relatives, or friends 10% 27 NAR s 2016 Profile of Home Buyer and Sellers (HBS) reports that among primary residence home buyers, 41 percent rented an apartment or house prior to their home purchase. The HBS surveys primary residence home buyers, while the monthly RCI Survey surveys REALTORS and captures purchases for investment purposes and vacation/second homes. 19
21 Distressed Sales: Five Percent of Sales Distressed sales accounted for five percent of sales in April 2017 (six percent in March 2017; seven percent in April 2016). Foreclosed properties were three percent of residential sales, while short sales were two percent of residential sales. 28 With rising home values, improved economic conditions, and fewer foreclosures, the share of distressed property sales has generally continued to decline. Distressed sales accounted for about a third to half of sales until 2012 when they began to fall below this level. 60% 50% 40% Distressed Sales as Percent of Residential Sales as of April 2017 Foreclosed: 3% Short sale: 2% 30% 20% 10% 0% Foreclosed Short sale Sales for Investment Purposes: 15 Percent of Sales Investment sales made up 15 percent of sales in April 2017 (15 percent in March 2017; 13 percent in April 2016). 29 Purchases for investment purposes have generally been on the decline since when investment sales accounted for 20 percent of sales. Purchasing for investment has become less attractive, with fewer distressed sales on the market and with home prices rising, but a seasonal pick-up in the share of investment purchases can often be seen from November to April. 28 The survey asks respondents who had a sale in the month to report on the characteristics of the most recent sale closed. 29 The 2016 NAR Investment and Vacation Homes Survey reports that among home buyers, 19 percent purchased the property for investment purposes, to rent out or for asset diversification. 20
22 30% Sales for Investment Purpose as Percent of Residential Sales as of April % 20% 15% 15% 10% 5% 0% Cash Sales: 21 Percent of Sales In April 2017, 21 percent of sales were cash sales (23 percent in March 2017; 24 percent in April 2016). Buyers of homes for investment purposes, distressed sales, second homes, and foreign clients are more likely to pay cash than first-time home buyers. As the shares of investment and distressed sales have declined, so has the share of cash sales. Cash Sales as Percent of Residential Sales as of April % 35% 30% 25% 20% 15% 10% 5% 0% % 21
23 60% 50% 40% 30% 20% 10% 57% Percent of All-Cash Sales Across Types of Buyer in April % 44% 0% Investor Distressed Second Home International Relocation First-time Sale Buyer *The RCI survey captures only non-u.s. citizens whose permanent residence is in another country (Type A). NAR has a separate survey on foreign buyers that captures both Type A buyers and non-u.s. citizens who reside in the United States on work, student, or other types of visas (Type B). 32% 19% 7% Fewer First-time Buyers Are Making a Low Downpayment Among first-time homebuyers, 63 percent put down a zero to six percent downpayment, a decrease from the 74 percent share in June 2009 when NAR started collecting this information in the RCI Survey. The Federal Housing Administration (FHA) and the Government Sponsored Enterprises (GSEs) have implemented policies to make credit more widely available, such as FHA s reduction of its annual mortgage insurance premiums and the Government Sponsored Enterprises (GSEs) acceptance of three percent downpayment mortgages. However, the impact of these measures in attracting first-time homebuyers appears to be modest for a variety of reasons. Lack of information about these products may be one reason. In fact, NAR s 2016 Q3 Housing Opportunities and Market Experience (HOME) Survey found that only 13 percent of those aged 34 years or under believe they need a downpayment of five percent or less. 30 Additionally, although low downpayment loans are available, some buyers may want to save for a bigger downpayment to meet underwriting standards (e.g., debt-to-income ratios), save on mortgage insurance, or get a lower interest rate. 30 See: 22
24 80% 75% 70% 65% 60% 55% 50% Share of First-time Buyers Obtaining a Mortgage Who Put in a Zero to Six Percent Downpayment as of April 2017* % *The data reported for the month is a rolling three-month figure. Still, first-time homebuyers are more likely to take advantage of a low downpayment loan compared to all homebuyers. Among first-time homebuyers who obtained a mortgage and whose transactions closed in February 2017 April 2017, 79 percent made a downpayment of less than 20 percent. 31 Among all buyers whose transaction closed in April 2017, 63 percent of those who obtained a mortgage made a downpayment of less than 20 percent. 90% 85% 80% 75% 70% 65% 60% 55% 50% Share of Buyers Obtaining a Mortgage Who Put in Less than 20 Percent Downpayment as of April 2017* % 63% All Buyers First-time Buyers* *The data reported for the month is a rolling three-month figure. 31 To increase the sample size for first-time homebuyers, NAR uses information from the last three surveys. 23
25 III. Issues Affecting Transactions Contract Settlement: Financing, Home Inspection, and Appraisals Are Major Issues Most contracts are settled on time. Among respondents who reported they had a contract that went into settlement or was terminated over the period February April 2017, 72 percent reported that the contracts were settled on time, 23 percent had a delayed settlement, and five percent reported that the contract was terminated. 100% 80% 60% 40% 20% 0% How Sales Contracts Were Settled Contract was terminated Contract was delayed but eventually went into settlement Contract was settled on time * Based on the respondent's most recent contract that went into settlement or was terminated during this three-month period. 5% 23% 72% 24
26 Among contracts that had a delayed settlement (23 percent), 32 percent faced issues related to obtaining financing and 18 percent had appraisal issues. Problems Encountered for Contracts That Were Delayed But Eventually Went Into Settlement in February April 2017* (Delayed Contracts Represent 23 Percent of Closed or Terminated Contracts) Issues Related to Obtaining Financing Appraisal Issues Home inspection/environmental issues Contingencies stated in the contract Titling/deed issues No problems encountered Issues in buy/sell distressed property Home/hazard/flood insurance issues Buyer lost job 4% 1% 1% 9% 9% 7% Other 23% *Based on the respondent's most recent contract that went into settlement or was terminated during this period. Percentages will not sum to 100 percent because multiple responses are allowed. "Other" includes buyer or seller backing out, price disagreement, non-price disagreement, HOA issues, builder delays, delays related to complying with regulation, etc. 14% 18% 32% While they are still the top cause of delay, issues related to obtaining financing have been cited by fewer respondents than when NAR first began tracking this indicator. Forty percent of those reporting a delay cited a financing issue. The decline may reflect the improvement in the economic environment, better credit histories from borrowers, and improvement in the loan evaluation processes of mortgage originators. 50% 45% 40% 35% 30% 25% 20% 15% 10% 18% Percent of Contracts with Delayed Settlement Which Had Issues Related to Obtaining Financing and Appraisal 40% % 21% Appraisal Issues Issues Related to Obtaining Financing 25
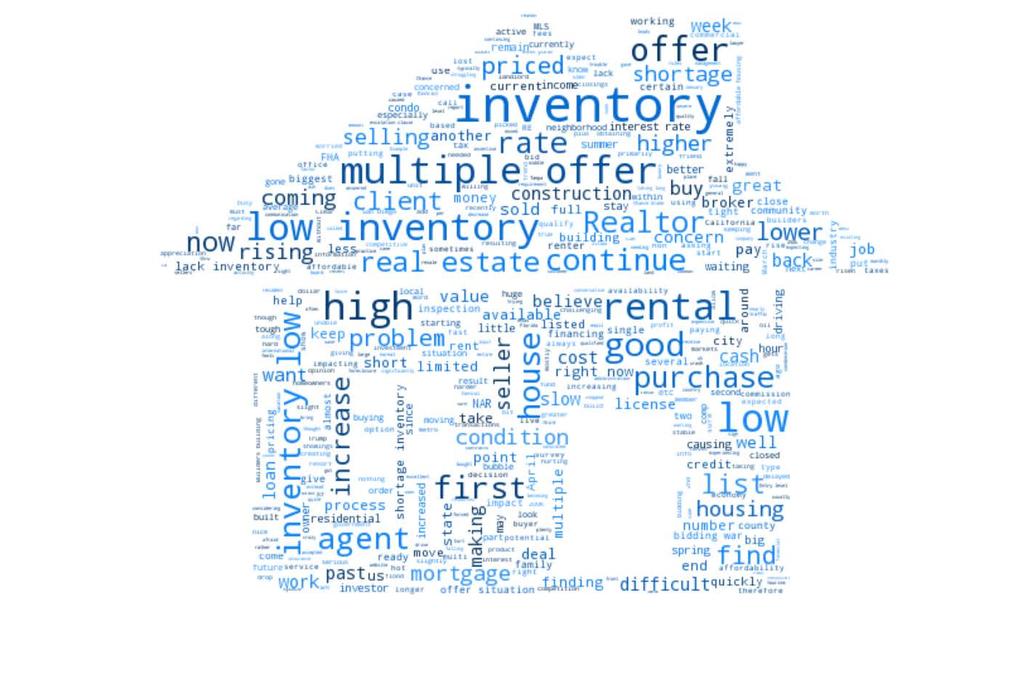
27 Regarding appraisal issues, respondents reported facing appraisal delays due to a shortage of appraisers, valuations that are not in line with market conditions, and out-of-town appraisers who are not familiar with local conditions. In NAR s Survey of Mortgage Originators, 55 percent who took part in the survey reported some level of issue in getting appraisals. 32 Other specific issues that led to delays involved titling, sale contingencies, problems related to distressed sales, home/hazard/flood insurance issues, and the buyer losing a job. Among contracts that were terminated (five percent), 35 percent faced issues related to home inspections and 21 percent had issues related to the buyer s ability to obtain financing. Problems Encountered for Contracts That Were Terminated in February April 2017* (Terminated Contracts Represent Five Percent of Closed or Terminated Contracts) Home inspection/environmental issues Issues Related to Obtaining Financing Appraisal Issues Contingencies stated in the contract Titling/deed issues Issues in buy/sell distressed property No problems encountered Buyer lost job Home/hazard/flood insurance issues Other *Based on the respondent's most recent contract that went into settlement or was terminated during this period. Percentages will not sum to 100 percent because multiple responses are allowed. "Other" includes buyer or seller backing out, price disagreement, non-price disagreement, HOA issues, builder delays, etc. 1% 0% 2% 4% 6% 6% 12% 21% 24% 35% Issues Reported by REALTORS In the monthly REALTORS Confidence Index Survey, the National Association of REALTORS asks members if they have additional comments or information regarding the demand, demand-supply conditions, changing buyer profile and preferences, mortgage/credit issues, or other issues impacting the market in their own words. The word cloud below shows the most popular words and/or phrases from the respondents in the April 2017 survey 33. Word frequency is represented by the size of the word. The most frequent words and phrases in the April 2017 survey were low inventory and multiple offer, which indicates that continued tightness in supply, particularly relative to strong demand, is the primary issue affecting the real estate market. 32 Ken Fears, 2016 Survey of Mortgage Originators, Fourth Quarter, Economists Outlook Blog. See 33 Created by Karen Belita, Data Scientist, NAR Research 26
28 27


29 The NATIONAL ASSOCIATION of REALTORS, The Voice for Real Estate, is America s largest trade association, representing over 1 million members, including NAR s institutes, societies, and councils, involved in all aspects of the real estate industry. NAR membership includes brokers, salespeople, property managers, appraisers, counselors and others engaged in both residential and commercial real estate. The term REALTOR is a registered collective membership mark that identifies a real estate professional who is a member of the National Association of REALTORS and subscribes to its strict Code of Ethics. Working for America's property owners, the National Association provides a facility for professional development, research, and exchange of information among its members, and to the public and government for preserving the free enterprise system and the right to own real property. The Mission of the NATIONAL ASSOCIATION of REALTORS Research Division is to collect and disseminate timely, accurate, and comprehensive real estate data and to conduct economic analysis to inform and engage members, consumers, policy makers, and the media in a professional and accessible manner. To find out about other products from NAR s Research Division, visit Also, follow NAR Research on NATIONAL ASSOCIATION of REALTORS Research Division 500 New Jersey Avenue, NW Washington, DC
REALTORS CONFIDENCE INDEX SURVEY Report on the March 2017 Survey
 REALTORS CONFIDENCE INDEX SURVEY Report on the March 2017 Survey The REALTORS Confidence Index (RCI) report provides monthly information about real estate market conditions and expectations, buyer/seller
REALTORS CONFIDENCE INDEX SURVEY Report on the December 2015 Survey
 REALTORS CONFIDENCE INDEX SURVEY Report on the December 2015 Survey The REALTORS Confidence Index (RCI) report provides monthly information about real estate market conditions and expectations, buyer/seller
REALTORS CONFIDENCE INDEX SURVEY
 REALTORS CONFIDENCE INDEX SURVEY NATIONAL ASSOCIATION OF REALTORS RESEARCH GROUP Summary The REALTORS Confidence Index (RCI) survey gathers monthly information from REALTORS about local real estate market
REALTORS CONFIDENCE INDEX SURVEY
 REALTORS CONFIDENCE INDEX SURVEY NATIONAL ASSOCIATION OF REALTORS RESEARCH GROUP Summary The REALTORS Confidence Index (RCI) survey gathers monthly information from REALTORS about local real estate market
REALTORS CONFIDENCE INDEX SURVEY
 REALTORS CONFIDENCE INDEX SURVEY RESEARCH GROUP The REALTORS Confidence Index (RCI) survey gathers monthly information from REALTORS about local real estate market conditions, characteristics of buyers
REALTORS CONFIDENCE INDEX SURVEY
 REALTORS CONFIDENCE INDEX SURVEY RESEARCH GROUP The REALTORS Confidence Index (RCI) survey gathers monthly information from REALTORS about local real estate market conditions, characteristics of buyers
2017 Land Market Survey
 2017 Land Market Survey Presented By National Association of REALTORS Research Division Lawrence Yun, Ph.D. Senior Vice President & Chief Economist Danielle Hale, MS, Managing Director, Housing Research
National Association of REALTORS Member Profile National Association of realtors
 National Association of REALTORS 2013 Member Profile 2013 National Association of realtors National Association of REALTORS Introduction In 2012, many areas of the country started to see both home sales
The 2018 Land Market Survey
 The 2018 Land Market Survey REALTORS Land Institute National Association ofrealtors Released in January 2019 President s Message As the 2018-2019 National President of the REALTORS Land Institute (RLI),
2017 Profile of Home Buyers and Sellers
 New Jersey Report Prepared for: New Jersey REALTORS Prepared by: Research Division December 2017 New Jersey Report Table of Contents Introduction... 2 Highlights... 4 Methodology... 8 Report Prepared by:
Business Creation Index
 Business Creation Index December 2016 National Association of REALTORS Research Department Introduction The new Business Creation Index (BCI) was created to monitor local economic conditions from the perspective
HOME Survey. Housing Opportunities and Market Experience. June National Association of REALTORS Research Group
 HOME Survey Housing Opportunities and Market Experience June 2018 National Association of REALTORS Research Group Introduction The Housing Opportunities and Market Experience (HOME) report was created
New Hampshire Report. Prepared for: New Hampshire Association of REALTORS. Prepared by: NATIONAL ASSOCIATION OF REALTORS.
 New Hampshire Report Prepared for: New Hampshire Association of REALTORS Prepared by: Research Division January 2016 New Hampshire Report Table of Contents Introduction... 2 Highlights... 3 Methodology..8
Charlotte Report. Prepared for: Greater Regional Charlotte Association of REALTORS. Prepared by: NATIONAL ASSOCIATION OF REALTORS.
 Charlotte Report Prepared for: Greater Regional Charlotte Association of REALTORS Prepared by: Research Division January 2016 Charlotte Report Table of Contents Introduction... 2 Highlights... 3 Methodology..8
Released: June 7, 2010
 Released: June 7, 2010 Commentary 2 The Numbers That Drive Real Estate 3 Recent Government Action 9 Topics for Home Buyers, Sellers, and Owners 11 Brought to you by: KW Research Commentary The housing
Aspiring Home Buyers Profile
 Aspiring Home Buyers Profile January 2019 National Association of REALTORS Research Group Introduction The Aspiring Home Buyer Profile is an in depth examination of the consumer preferences of non-homeowners,
REALTORS CONFIDENCE INDEX Report on the October 2014 Survey
 REALTORS CONFIDENCE INDEX Report on the October 2014 Survey NATIONAL ASSOCIATION OF REALTORS Research Department Lawrence Yun, Senior Vice President and Chief Economist The REALTORS Confidence Index (RCI)
2018 Profile of Home Buyers and Sellers
 Massachusetts Report Prepared for: Massachusetts Association of REALTORS Prepared by: Research Division December 2018 Massachusetts Report Table of Contents Introduction... 2 Highlights... 4 Methodology...
National Association of REALTORS 2015 PROFILE OF HOME BUYERS AND SELLERS. The Voice for Real Estate
 National Association of REALTORS 2015 PROFILE OF HOME BUYERS AND SELLERS The Voice for Real Estate 2015 OFFICERS President Chris Polychron, CIPS, CRS, GRI President-Elect Tom Salomone First Vice President
REALTORS CONFIDENCE INDEX
 REALTORS CONFIDENCE INDEX Report on the May 2014 Survey Conducted June 2-6, 2014 NATIONAL ASSOCIATION OF REALTORS Research Department Lawrence Yun, Senior Vice President and Chief Economist Table of Contents
National Association of REALTORS
 National Association of REALTORS 2017 Profile of Home Buyers and Sellers The Voice for Real Estate 2017 LEADERSHIP TEAM President Bill Brown President-Elect Elizabeth Mendenhall, ABR, ABRM, CIPS, CRB,
Housing Price Forecasts. Illinois and Chicago PMSA, October 2014
 Housing Price Forecasts Illinois and Chicago PMSA, October 2014 Presented To Illinois Association of Realtors From R E A L Regional Economics Applications Laboratory, Institute of Government and Public
Housing Price Forecasts. Illinois and Chicago PMSA, June 2012
 Housing Price Forecasts Illinois and Chicago PMSA, June 2012 Presented To Illinois Association of REALTORS From R E A L Regional Economics Applications Laboratory, Institute of Government and Public Affairs
1200 Premier Drive, Suite 140 Chattanooga, TN Each office is independently owned and operated.
 THIS MONTH IN REAL ESTATE K im aulston R REALTOR 1200 Premier Drive, Suite 140 Chattanooga, TN 37421 Each office is independently owned and operated. Cell: 423-316-4022 Office: 423-664-1600 Email: kcraulston@gmail.com
Foreclosures Continue to Bring Home Prices Down * FNC releases Q Update of Market Distress and Foreclosure Discount
 Foreclosures Continue to Bring Home Prices Down * FNC releases Q4 2011 Update of Market Distress and Foreclosure Discount The latest FNC Residential Price Index (RPI), released Monday, indicates that U.S.
2017 Moving with Kids
 2017 Moving with Kids National Association of REALTORS Research Department Introduction Home buyers and sellers that have children living at home under the age of 18 have unique needs when they purchase
National Association of REALTORS 2014 MEMBER PROFILE. The Voice for Real Estate
 National Association of REALTORS 2014 MEMBER PROFILE The Voice for Real Estate 2014 OFFICERS President Steve Brown, ABR, CIPS, CRS, GREEN President-Elect Chris Polychron, CRS, GRI First Vice President
2017 Profile of Home Staging
 2017 Profile of Home Staging National Association of REALTORS Research Department Executive Summary Buyers Agent Perspective: Forty-nine percent of buyers agents cited that homes staging had an effect
2017 RESIDENTIAL REAL ESTATE MARKET REPORT
 2017 RESIDENTIAL REAL ESTATE MARKET REPORT Published January 26, 2018 Our market reports have been focused on the effects of low inventory on our housing market and for good reason. December 2017 marked
Released: May 7, 2010
 Released: May 7, 2010 Commentary 2 The Numbers That Drive Real Estate 3 Recent Government Action 9 Topics for Home Buyers, Sellers, and Owners 11 Brought to you by: KW Research Commentary The economic
Housing and Economy Market Trends
 Housing and Economy Market Trends Mainstreet Organization Prices of single-family, detached homes in suburban Chicago increased 12.1 percent in May 2014 compared with the same period a year ago. Overall,
Economic Highlights. Payroll Employment Growth by State 1. Durable Goods 2. The Conference Board Consumer Confidence Index 3
 August 26, 2009 Economic Highlights Southeastern Employment Payroll Employment Growth by State 1 Manufacturing Durable Goods 2 Consumer Spending The Conference Board Consumer Confidence Index 3 Real Estate
Housing Price Forecasts. Illinois and Chicago PMSA, December 2015
 Housing Price Forecasts Illinois and Chicago PMSA, December 2015 Presented To Illinois Association of Realtors From R E A L Regional Economics Applications Laboratory, Institute of Government and Public
Federal Government Shutdown Survey
 Federal Government Shutdown Survey January 2019 National Association of REALTORS Research Group Executive Summary Introduction As of midnight on December 21, 2018, the President and Congress were unable
2018 Real Estate Forecast Breakfast. Real Estate Market Update
 2018 Real Estate Forecast Breakfast Central Oregon Association of REALTORS Real Estate Market Update Paul C. Bishop, PhD, CBE Vice President, Research NATIONAL ASSOCIATION OF REALTORS February 22, 2018
Connecticut Report. Prepared for: Connecticut Association of REALTORS. Prepared by: NATIONAL ASSOCIATION OF REALTORS. Research Division.
 2015 Profile of Home Buyers and Sellers Report Prepared for: Association of REALTORS Prepared by: NATIONAL ASSOCIATION OF REALTORS Research Division January 2016 2015 Profile of Home Buyers and Sellers
This Month in Real Estate
 Keller Williams Research This Month in Real Estate Released: September 14, 2009 Commentary. The Numbers That Drive Real Estate Recent Government Action. Research for Buyers and Sellers. 2 4 10 14 1 Green
Profile of Home Buyers and Sellers
 NATIONAL ASSOCIATION OF REALTORS Profile of Home Buyers and Sellers 2011 The Voice for Real Estate 1 2011 OFFICERS President Ron Phipps, ABR, CRS, GRI, GREEN, e-pro, SFR President-Elect Maurice Moe Veissi
2015 Member Profile Florida REALTORS Report
 2015 Member Profile REALTORS Report Prepared for: REALTORS Prepared by: NATIONAL ASSOCIATION OF REALTORS Research Division July 2015 2015 Member Profile Report Table of Contents Introduction... 2 Highlights...
Austin-area home prices set August record, outpace household income growth in August 2015
 Austin-area home prices set August record, outpace household income growth in August 2015 Market Reports Austin Board of REALTORS releases real estate statistics for August 2015 AUSTIN, Texas September
Phoenix, Central and Northern Arizona
 Phoenix, Central and Northern Arizona End of Year Housing Report 1-8-354-5664 LongRealty.com 217 End of Year Housing Report SALES & INVENTORY Housing market trends For the overall real estate market in
2012 Profile of Home Buyers and Sellers New Jersey Report
 Prepared for: New Jersey Association of REALTORS Prepared by: Research Division December 2012 Table of Contents Introduction... 2 Highlights... 4 Conclusion... 7 Report Prepared by: Jessica Lautz 202-383-1155
Real Estate Investor Market Research Report. Real Estate IRA Investment Trends & Insights
 2017 Real Estate Investor Market Research Report Real Estate IRA Investment Trends & Insights Contents Introduction... 2 Entrust IRA Real Estate Investment Trends... 3 Where Investors Bought Real Estate...
Contents. off the fence. It s a good life!
 I hope you enjoy the latest edition of Brian Buffini s Real Estate Report. The goal of this piece is to help you stay educated on today s market and position yourself as a true professional and your clients
Appraiser Trends Study
 Appraiser Trends Study March 2017 National Association of REALTORS Research Department The National Association of REALTORS, The Voice for Real Estate, is America s largest trade association, representing
Profile of Home Buyers and Sellers
 National Association of Realtors Profile of Home Buyers and Sellers 2011 The Voice for Real Estate 1 2011 Officers President Ron Phipps, ABR, CRS, GRI, GREEN, e-pro, SFR President-Elect Maurice Moe Veissi
MARCH 2019 Harrisonburg & Rockingham County Real Estate Market Report
 MARCH 219 Real Estate Market Report An analysis of real estate activity through February 28, 219 provided courtesy of Scott P. Rogers, Funkhouser Real Estate Group Spacious Four Bedroom Brick Colonial
Housing Price Forecasts. Illinois and Chicago PMSA, August 2017
 Housing Price Forecasts Illinois and Chicago PMSA, August 2017 Presented To Illinois Realtors From R E A L Regional Economics Applications Laboratory, Institute of Government and Public Affairs University
2013 Housing Market Forecast. SILVAR: Los Gatos/Saratoga District October 10, 2012 Leslie Appleton-Young, Vice President & Chief Economist
 2013 Housing Market Forecast SILVAR: Los Gatos/Saratoga District October 10, 2012 Leslie Appleton-Young, Vice President & Chief Economist What we saw from the roof.. C.A.R. NAR THE ECONOMY Recent Housing
TUCSON and SOUTHERN ARIZONA
 TUCSON and SOUTHERN ARIZONA End of Year Housing Report (52) 818-454 Stephen@TeamWoodall.com 217 End of Year Housing Report SALES & INVENTORY Housing market trends For the overall real estate market in
Single Family Sales Maine: Units
 Maine Home Connection 19 Commercial St Portland, Maine 04101 MaineHomeConnection.com Office: (207) 517-3100 Email: Info@MaineHomeConnection.com For the fourth consecutive year, Maine home sales set a new
Released: June Commentary 2. The Numbers That Drive Real Estate 3. Recent Government Action 9. Topics for Home Buyers, Sellers, and Owners 11
 Released: June 2011 Commentary 2 The Numbers That Drive Real Estate 3 Recent Government Action 9 Topics for Home Buyers, Sellers, and Owners 11 Brought to you by: KW Research Commentary The U.S. housing
Minneapolis St. Paul Residential Real Estate Index
 University of St. Thomas Minneapolis St. Paul Residential Real Estate Index September 2017 Welcome to the latest edition of the UST Minneapolis St. Paul Residential Real Estate Index. The University of
RESIDENTIAL MARKET ANALYSIS
 RESIDENTIAL MARKET ANALYSIS EVAN ABRAMOWITZ Joseph Bernard Investment Real Estate Oregon Association of Realtors Student Fellow Masters of Real Estate Development Graduate Student National housing market
Housing Price Forecasts. Illinois and Chicago PMSA, April 2013
 Housing Price Forecasts Illinois and Chicago PMSA, April 2013 Presented To Illinois Association of Realtors From R E A L Regional Economics Applications Laboratory, Institute of Government and Public Affairs
2015 Member Profile Texas Association of REALTORS Report
 2015 Member Profile Association of REALTORS Report Prepared for: Assocation of REALTORS Prepared by: NATIONAL ASSOCIATION OF REALTORS Research Division July 2015 2015 Member Profile / National Association
Housing Price Forecasts. Illinois and Chicago PMSA, January 2018
 Housing Price Forecasts Illinois and Chicago PMSA, January 2018 Presented To Illinois Realtors From R E A L Regional Economics Applications Laboratory, Institute of Government and Public Affairs University
Connecticut First Nine Months Housing Report 2014
 Connecticut First Nine Months Housing Report 2014 First Nine Months of 2014 Highlight Positive Outlook for Multi-family Home Construction Millennial buyers are finally increasing their rate of household
FOR IMMEDIATE RELEASE Contact: David B. Bennett President & CEO Phone:
 FOR IMMEDIATE RELEASE Contact: David B. Bennett President & CEO Phone: 727-216-32 Email: dbennett@tampabayrealtor.com Real Estate Statistics for September 216 At this time of year everyone starts to get
Rx for Real Estate. elearning series. Upcoming elearning series
 Upcoming elearning series Kevin Russell Senior Vice President, Sales & Account Management Cartus Home Loans Donna Barber Manager, Sales/Account Management Support, Global Implementation Services, Cartus
Real Estate Update. elearning series. Upcoming elearning series. Year-End Planning. September 16
 Real Estate Update Upcoming elearning series Year-End Planning September 16 Kevin Russell Senior Vice President, Sales & Account Management, Cartus Home Loans Renee Carnes-Rook Vice President, Real Estate
Annual Report On Our National Real Estate Market
 A TWINCITIESPROPERTYFINDER.COM RESOURCE Annual Report On Our National Real Estate Market 1 Contents Industry Facts 3 Mortgage Stats 4 Distressed Properties & Price Information 5 Today s Buyer 6 First-Time
FOR IMMEDIATE RELEASE Contact: David B. Bennett President & CEO Phone:
 FOR IMMEDIATE RELEASE Contact: David B. Bennett President & CEO Phone: 727-216-32 Email: dbennett@tampabayrealtor.com Real Estate Statistics for September 217 September s numbers are out, and it comes
Housing Bulletin Monthly Report
 February 21 1 Housing Bulletin Monthly Report Housing Starts 25, 2, 15, 1, 5, Alberta Housing Starts up 5 per cent from 29 From February 29 to 21, preliminary housing starts increased 82.7 per cent across
Housing Price Forecasts. Illinois and Chicago PMSA, May 2018
 Housing Price Forecasts Illinois and Chicago PMSA, May 2018 Presented To Illinois Realtors From R E A L Regional Economics Applications Laboratory, Institute of Government and Public Affairs University
San Francisco Bay Area to Napa County Housing and Economic Outlook
 San Francisco Bay Area to 019 Napa County Housing and Economic Outlook Bay Area Economic Forecast Summary Presented by Pacific Union International, Inc. and John Burns Real Estate Consulting, LLC On Nov.
Housing Bulletin Monthly Report
 October 21 1 Housing Bulletin Monthly Report Housing Starts show Slight improvement in September CANADA Housing Starts 2, 15, 1, 5, Sep 8 Oct 8 Nov 8 Dec 8 Preliminary Housing Starts in Alberta and Canada
Housing and Mortgage Market Update
 Housing and Mortgage Market Update Views from the Top Frank E. Nothaft Vice President and Chief Economist January 8, 2015 Summary: Housing & Mortgage Market Outlook for 2015 Interest rates expected to
MARKET OUTLOOK FOR SAN MATEO
 MARKET OUTLOOK FOR SAN MATEO Jonathan Smoke Chief Economist August 2, 2016 NATIONAL TRENDS 2 JOB CREATION REBOUNDED IN JUNE 229,000 jobs created by month in 2015; 172,000 average this year Employment and
The state of the nation s Housing 2011
 The state of the nation s Housing 2011 Fact Sheet PURPOSE The State of the Nation s Housing report has been released annually by Harvard University s Joint Center for Housing Studies since 1988. Now in
FOR IMMEDIATE RELEASE Contact: David B. Bennett President & CEO Phone:
 FOR IMMEDIATE RELEASE Contact: David B. Bennett President & CEO Phone: 727-216-32 Email: dbennett@tampabayrealtor.com Real Estate Statistics for December 217 wrapped up a sizzling 217 with a steady month
Housing Price Forecasts. Illinois and Chicago PMSA, April 2018
 Housing Price Forecasts Illinois and Chicago PMSA, April 2018 Presented To Illinois Realtors From R E A L Regional Economics Applications Laboratory, Institute of Government and Public Affairs University
Housing Bulletin Monthly Report
 January 21 1 Housing Bulletin Monthly Report Most new homes built in second half of 29 25, 2, 15, 1, 5, Dec 7 Jan 8 Feb 8 mar 8 apr 8 Alberta s 29 housing starts increased 72.8 per cent over 28, suggesting
2016 Member Profile Florida REALTORS Report
 2016 Member Profile REALTORS Report Prepared for: REALTORS Prepared by: NATIONAL ASSOCIATION OF REALTORS Research Division July 2016 2016 Member Profile Report Table of Contents Introduction... 2 Highlights...
2018 Member Profile Charlotte Regional REALTOR Association Report
 Charlotte Regional REALTOR Association Report Prepared for: Charlotte Regional REALTOR Association Prepared by: Research Division August 2018 Charlotte Report Table of Contents Introduction... 2 Highlights...
The supply of single-family homes for sale remains
 Oh Give Me a (Single-Family Rental) Home Harold D. Hunt and Clare Losey December, 18 Publication 2218 The supply of single-family homes for sale remains tight in many markets across the United States.
REALTORS and Sustainability
 REALTORS and Sustainability 2017 Report National Association of REALTORS Research Department NAR Sustainability Program In order to position NAR as a leader in real estate sustainability topics with real
FEBRUARY 2019 Harrisonburg & Rockingham County Real Estate Market Report
 FEBRUARY 219 Real Estate Market Report An analysis of real estate activity through January 31, 219 provided courtesy of Scott P. Rogers, Funkhouser Real Estate Group Immaculate Brick Highland Park Colonial
Austin-Round Rock Area Local Market Report, Fourth Quarter 2017
 -Round Rock Area Local Market Report, Fourth Quarter 2017 Today's Market $350,000 Median Price (Red Line) and One-year Price Growth 12% $300,000 $250,000 10% 8% 6% $200,000 4% $150,000 2% $100,000 $50,000
2013 Profile of Home Buyers and Sellers Metro Indianapolis Report
 Prepared for: Metro Indianapolis Board of REALTORS Prepared by: Research Division December 2013 Table of Contents Introduction... 2 Highlights... 3 Conclusion... 6 Methodology..7 Report Prepared by: Jessica
Housing Bulletin Monthly Report
 December 21 1 Housing Bulletin Monthly Report Alberta Housing Starts Fall in November 21 Canada Housing Starts 25 2 15 1 5 8 NOV 8 DEC 8 Preliminary Housing Starts in Alberta* and Canada* November 28 to
With last month's gain, sales are now up 4.5% from May 2015 and are at their highest annual pace since February 2007.
 JULY 2016 With last month's gain, sales are now up 4.5% from May 2015 and are at their highest annual pace since February 2007. - Lawrence Yun NAR s Chief Economist Now in its seventh year, the US economic
LUXURY MARKET REPORT. - March
 LUXURY MARKET REPORT - March 2018 - www.luxuryhomeing.com THIS IS YOUR LUXURY MARKET REPORT MAP OF LUXURY RESIDENTIAL MARKETS Welcome to the Luxury Report, your guide to luxury real estate market data
Pikes Peak area housing Market Statistics (As of: 9/30/2018)
") $156,25 $184, $174,697 $177,2 $21,53 $185,83 $173, $178,29 $172,25 $212,75 $21,95 $226,692 $197,5 $199, $196, $28, $25, $223,95 $216,75 $29,527 $234,9 $218,82 $229,74 $235,518 $231,457 $255, $259,11 $269,98
$156,25 $184, $174,697 $177,2 $21,53 $185,83 $173, $178,29 $172,25 $212,75 $21,95 $226,692 $197,5 $199, $196, $28, $25, $223,95 $216,75 $29,527 $234,9 $218,82 $229,74 $235,518 $231,457 $255, $259,11 $269,98
San Francisco Bay Area to Santa Clara & San Benito Counties Housing and Economic Outlook
 San Francisco Bay Area to 019 Santa Clara & San Benito Counties Housing and Economic Outlook Bay Area Economic Forecast Summary Presented by Pacific Union International, Inc. and John Burns Real Estate
NOVEMBER 2018 Harrisonburg & Rockingham County Real Estate Market Report
 NOVEMBER 218 Real Estate Market Report An analysis of real estate activity through October 31, 218 provided courtesy of Scott P. Rogers, Funkhouser Real Estate Group Custom-Built Highland Park Home with
Marijuana and Real Estate: A Budding Issue
 Marijuana and Real Estate: A Budding Issue November 2018 National Association of REALTORS Research Group Residential Real Estate and growing in home or common areas. Six percent report that homeowner associations
2012 Profile of Home Buyers and Sellers Texas Report
 2012 Profile of Home and Sellers Report Prepared for: Association of REALTORS Prepared by: NATIONAL ASSOCIATION OF REALTORS Research Division December 2012 2012 Profile of Home and Sellers Report Table
Housing Bulletin Monthly Report
 August 21 Housing Bulletin Monthly Report 1 C a n a da s P r e li m i n a ry H o u s i n g S ta r t s s l i p i n J u ly Preliminary Housing St arts in Albert a* and Canada* July 28 to July 21 25, Canada
Economic and Housing Market Outlook ( ) October 31, Contra Costa AOR
 October 31, Contra Costa AOR") Economic and Housing Market Outlook (2012 2013) Contra Costa AOR October 31, 2012 Oscar Wei Senior Research Analyst California Association of REALTORS Overview US and California Economies California Housing
Economic and Housing Market Outlook (2012 2013) Contra Costa AOR October 31, 2012 Oscar Wei Senior Research Analyst California Association of REALTORS Overview US and California Economies California Housing
OCTOBER 2018 Harrisonburg & Rockingham County Real Estate Market Report
 OCTOBER 218 Real Estate Market Report An analysis of real estate activity through September 3, 218 provided courtesy of Scott P. Rogers, Funkhouser Real Estate Group Five Bedroom City Home with Finished
Monthly Market Watch for the Prescott Quad City Area. Provided by Keller Williams Check Realty Statistics from August 2012 Prescott MLS
 August 2012 Monthly Market Watch for the Prescott Quad City Area Provided by Keller Williams Check Realty Statistics from August 2012 Prescott MLS Report Overview: This report includes MLS data for the
Pikes Peak area housing Market Statistics (As of: 2/28/2018)
") Jan-1-1 -1-1 Jan-2-2 -2-2 Jan-3-3 -3-3 -4-4 -4-5 -5-5 -6-6 -6-7 -7-7 -8-8 -8-9 -9-9 -1-1 -1-11 -11-11 -12-12 -12-13 -13-13 -14-14 -14-15 -15-15 -16-16 -16-17 -17-17 Jan-1-1 -1-1 Jan-2-2 -2-2 Jan-3-3 -3-3
Jan-1-1 -1-1 Jan-2-2 -2-2 Jan-3-3 -3-3 -4-4 -4-5 -5-5 -6-6 -6-7 -7-7 -8-8 -8-9 -9-9 -1-1 -1-11 -11-11 -12-12 -12-13 -13-13 -14-14 -14-15 -15-15 -16-16 -16-17 -17-17 Jan-1-1 -1-1 Jan-2-2 -2-2 Jan-3-3 -3-3
Florida Report. Prepared for: Florida REALTORS. Prepared by: NATIONAL ASSOCIATION OF REALTORS. Research Division. January 2016
 2015 Profile of Home and Sellers Report Prepared for: REALTORS Prepared by: NATIONAL ASSOCIATION OF REALTORS Research Division January 2016 2015 Profile of Home and Sellers NATIONAL ASSOCIATION OF REALTORS
Sep September 2018
 18 September 18 MONTHLY STATISTICS PACKAGE City of Calgary Persistent buyers market continues 18 City of Calgary, October 1, 18 With no change in the economic climate, Calgary s sales activity totaled
Beaumont-Port Arthur Area Local Market Report, First Quarter 2017
 -Port Arthur Area Local Market Report, First Quarter 2017 Today's Market $180,000 Median Price (Red Line) and One-year Price Growth 20% $160,000 $140,000 $120,000 15% 10% $100,000 5% $80,000 0% $60,000
NAR Survey Shows Consumers Very Satisfied With Agent Performance
 For more information, contact: Walt Molony 702/981-8592 wmolony@realtors.org NAR Survey Shows Consumers Very Satisfied With Agent Performance LAS VEGAS, November 13, 2007 A new consumer survey shows that
LUXURY MARKET REPORT. - March
 LUXURY MARKET REPORT - March 2018 - www.luxuryhomemarketing.com THIS IS YOUR LUXURY MARKET REPORT MAP OF LUXURY RESIDENTIAL MARKETS Welcome to the Luxury Market Report, your guide to luxury real estate
National Foreclosure Report
 National Foreclosure Report OCTOBER 20 1.5% In October, the foreclosure inventory was down 1.5 percent from September 20, representing 48 months of consecutive year-overyear declines. Improved economic
REALTORS and Sustainability 2018 Report
 REALTORS and Sustainability 2018 Report National Association of REALTORS Research Group REALTOR Sustainability Program The National Association of REALTORS (NAR) is a leader in the dialogue on real estate