CONGRESSIONAL DISTRICT REPORT For the 113th Congress. Texas District 20. Representative Joaquin Castro (D)
|
|
|
- Ann Walters
- 5 years ago
- Views:
Transcription
 National Association of REALTORS 500 New Jersey Avenue, NW Washington,")
1 CONGRESSIONAL DISTRICT REPORT For the 113th Congress Texas District 20 Representative Joaquin Castro (D) National Association of REALTORS 500 New Jersey Avenue, NW Washington, D.C.
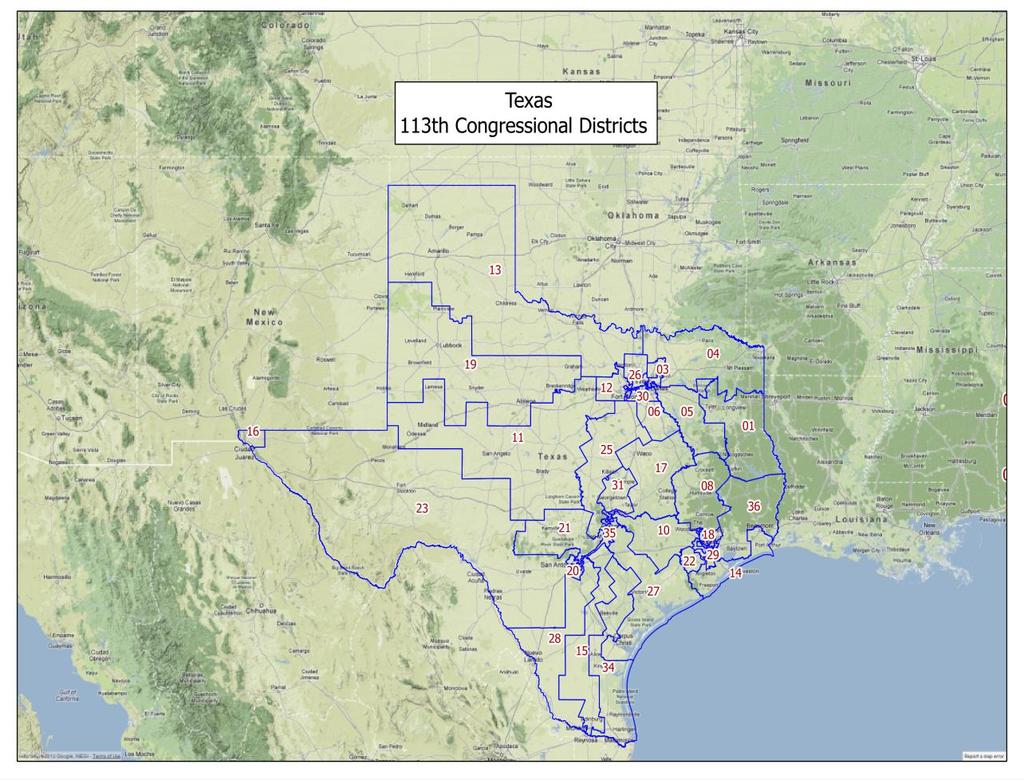
2 Texas Congressional Districts 113th Congress
3 CONGRESSIONAL DISTRICT REPORT For the 113th Congress This Report presents the most recent and relevant data that is available for the Districts of the 113th Congress as related to housing issues. Real estate, demographic, and economic data are presented to provide information about the status of homeownership, trends in the real estate market, and the economic conditions that underlie the demand for housing. NAR's goal in providing this Report is to sustain and strengthen public policy support for homeownership which offers tremendous social and economic benefits to American neighborhoods. Additional information on housing issues is available at Sections of the NAR website of particular interest in economic and housing analysis include Existing Home Sales REALTORS Confidence Index Research and Statistics NAR's political advocacy information is available at Information for News and Blogs may be found at This Report provides District information as well as overall State information on the following pages.
4 HOUSING STATISTICS FOR THE 113TH CONGRESS National Association of Texas District 20 REALTORS District Level Information Representative Joaquin Castro (D) Home Ownership in Total Housing Units 264,027 Homeownership Rate (% Owned to Occupied) 57.1% Occupied Housing Units 240,903 Units With Mortgage, as % of Owner Occupied 64.9% Owner Occupied Units 137,508 Vacant, as % of Total Housing Units 8.8% With Mortgage 89,209 Without Mortgage 48,299 Renter Occupied Units 103,395 Vacant Units 23,124 Median Income, Owner Cost, and Rent in Median Household Annual Income $45,338 Occupied With Mortgage $71,798 Occupied Without Mortgage $40,323 Rented Units $30,072 Median Value of Owner Occupied Unit $109,300 % to Income Median Selected Monthly Owner Cost, Units with Mortgage $1,205 2 Median Selected Monthly Owner Cost, Units without Mortgage $369 11% Median Monthly Gross Rent $802 32% Employment in In the Labor Force, 16 years and up 365,173 Labor Force Participation Rate 66 % Number of Unemployed 32,317 Unemployment Rate 6 % 15% Employment, by Type Private Wage & Salary 5% Government 8 SelfEmployed Unpaid Source: American Community Survey,, 1 year estimates. U.S. Census Bureau. Tables DP03, DP04,B25119, B25099.
5 HOUSING STATISTICS FOR THE 113TH CONGRESS National Association of Texas REALTORS State Level Information Senator John Cornyn(R) Senator Ted Cruz(R) Homeownership in Total Housing Units 10,154,835 Occupied Housing Units 8,970,959 Owner Occupied Units 5,586,856 Homeownership Rate 62.3% With Mortgage 3,412,384 % of Owned Units With Mortgage 61.1% Without Mortagage 2,174,472 Renter Occupied Units 3,384,103 Vacant Units 1,183,876 Median Household Income $ 50,740 Selected Monthly Owner Costs For Owner Occupied $ 65,502 Owned With Mortgage $ 1,374 For Renter Occupied $ 32,834 Owned Without Mortgage $ 432 Renter Occupied $ 831 Median Value of Home $ 129,200 Home Ownership Rate (in %)* 62% Asian 58.8 African American/Black 41.9 American Indian/Alaskan Native 56.3 Native Hawaiian/Pacific Islander #N/A White 66.3 Hispanic, any ethnicity Homeownership Rate ( in%) Source: Census Bureau. CPS/VHS Texas U.S. Sources of data: Census Bureau, ACS (Tables DP04,S0201,B25119; HMDA Loan Application Register, ; Census BureauCPS * Alone or in combination with other race; N/A= not reported in the ACS tabulation
6 Q1:04 Q4:04 Q3:05 Q2:06 Q1:07 Q4:07 Q3:08 Q2:09 Q1:10 Q4:10 Q3:11 Q2:12 Q1:13 Q4:13 Q1:04 Q4:04 Q3:05 Q2:06 Q1:07 Q4:07 Q3:08 Q2:09 Q1:10 Q4:10 Q3:11 Q2:12 Q1:13 Q4:13 HOUSING STATISTICS FOR THE 113TH CONGRESS National Association of Texas REALTORS Mortgages in Foreclosure as of 2013 Q4 70,000 60,000 50,000 40,000 30,000 20,000 10,000 Foreclosure Inventory, End of Quarter Percent of Loans in Foreclosure Inventory Source of data: Haver/MBA Texas Texas Source of data: Haver/MBA U.S. Mortgage Financing Trends in Conventional Home Purchase First Lien Loans for 1 to 4 Family Units FHA Home Purchase First Lien Loans for 1 to 4 Family Units 400, , , , ,000 40, ,000 1 Number Pct to Total Loans Source of data: HMDALAR. NAR Tabulation 25,000 20,000 15,000 10,000 5,000 VA Home Purchase First Lien Loans for 1 to 4 Family Units 12% 1 8% 6% 4% 2% Number Pct to Total Loans Source of data: HMDALAR. NAR Tabulation 8,000 6,000 4,000 2,000 FSA/RHS Home Purchase First Lien Loans for 1 to 4 Family Units Source of data: HMDALAR. NAR Tabulation Source of data: HMDALAR. NAR Tabulation
7 HOUSING STATISTICS FOR THE 113TH CONGRESS National Association of Texas REALTORS 500, , , , ,000 0 Number of Home Purchase First Lien Loans for 1 to 4 Family Units Loans Originated for Home Purchase First Lien Loans for 14 Family Units in All 238,029 Conventional Loans 134,821 57% FHAInsured Loans 73,565 31% VAGuaranteed Loans 22,604 9% FHS/RHS Loans 7,039 3% Source of data: HMDALAR/NAR tabulation. Source of data: HMDALAR Home Purchase Loans Originated in, by Income of Household Number of Median Loan Median Income Mortgages ($'000) ($'000) Lower Income Households 53,634 $ 112 $ 40 Middle Income Households 52,939 $ 147 $ 64 Higher Income Households 125,359 $ 208 $ 120 Unspecified Income Households 6,097 $ 111 $ 67 Source of data: HMDA Loan Application Register,. NAR Tabulation. * Lower income households were defined as those with incomes of 80 percent or less of the HUD median family income for the census tract. Higher income are those with 12 of HUD median family income. Middle income households fall in between.
Congressional District Report for the 115th Congress
 Congressional District Report for the 115th Congress New York District 22 Honorable Claudia Tenney (R) Congressional Districts of New York August 2018 Report National Association of REALTORS Q1/1980 Q3/1981
FEDERAL ECONOMIC AREA REPORT. Maryland: Congressional District 5
 FEDERAL ECONOMIC AREA REPORT Maryland: Congressional District 5 Informationis not guaranteed. Equal Housing Opportunity. Congressional District Report For the 115th Congress Maryland District 5 Honorable
Housing and Mortgage Market Update
 Housing and Mortgage Market Update Views from the Top Frank E. Nothaft Vice President and Chief Economist January 8, 2015 Summary: Housing & Mortgage Market Outlook for 2015 Interest rates expected to
Little Haiti Community Needs Assessment: Housing Market Analysis December 2015
 Little Haiti Community Needs Assessment: Housing Market Analysis December 2015 Prepared by: EXECUTIVE SUMMARY Background The Little Haiti Housing Needs Assessment provides a current market perspective
Update of U.S. Residential Real Estate Trends: Including economic data, current sales, new construction,
 THE WRIGHT REPORT Update of U.S. Residential Real Estate Trends: Including economic data, current sales, new construction, interest rates, new construction, and foreclosures. January to June, 2017 www.thewrightinsight.net
America s Rental Housing
 America s Rental Housing The Key to a Balanced National Policy Bill Apgar Remodeling Futures Conference April 15, 2008 www.jchs.harvard.edu The Mortgage Market Meltdown Collides with Ongoing Rental Affordability
Ventura County. Economic Profile. November 2008
 Ventura County Economic Profile November 2008 The copyright laws of the United States (Title 17 U.S. Code) forbid the unauthorized reproduction of this report by any means, including facsimile or computerized
State of the Nation s Housing 2011: A Preview
 State of the Nation s Housing 2011: A Preview Christopher Herbert Remodeling Futures Conference April 5, 2011 www.jchs.harvard.edu No Signs of a Recovery Yet % Change % Change Description: 2008 2009 2010
Residential Real Estate Market Overview: September 2017 Data
 Residential Real Estate Market Overview: September 2017 Data 2017 Mark A. Melikian Chief Valuation Officer mark.melikian@summitvaluations.com 2800 River Road, Suite 460 The following is a market data summary
Section 1 - Current Metro Rent Details. Asking Rent by Age Asking Rent Distribution Asking Rent Growth Rate Distribution $788 $859 $860 $931
 Section 1 - Current Metro Rent Details Asking Rent by Age Asking Rent Distribution Asking Rent Growth Rate Distribution Year Built Rent Before 1970 $516 1970-1979 $484 1980-1989 $602 1990-1999 $702 After
H12 Economic Impact Analysis: Hickory Creek
 H12 Economic Impact Analysis: Hickory Creek 2012 Executive Summary $5.3 million of local income generated from Dallas Habitat s construction efforts in Hickory Creek 117 new jobs generated in construction
APPENDIX TABLES. Table A-1 Income and Housing Costs, US Totals: Table A-2 Housing Market Indicators:
 APPENDIX TABLES Table A-1 Income and Housing Costs, US s: 1975 2005 Table A-2 Housing Market Indicators: 1975 2005 Table A-3 Terms on Conventional Single-Family Mortgages: 1980 2005 Table A-4 Mortgage
2015 New York City. Housing Security Profile and Affordable Housing Gap Analysis
 2015 New York City Housing Security Profile and Affordable Housing Gap Analysis 1 Contents: Housing Insecurity in New York City 3 A City of Renters. 6 Where the Housing Insecure Population Lives 16 Housing
Monthly Indicators - 8.0% + 4.2% - 3.4% Activity Overview New Listings Pending Sales. Closed Sales. Days on Market Until Sale. Median Sales Price
 Monthly Indicators 2018 If the last few months are an indication of the temperature of housing markets across the country, a period of relative calm can be expected during the last three months of the
Monthly Indicators % + 8.2% % Market Overview New Listings Pending Sales. Closed Sales. Days on Market Until Sale. Median Sales Price
 Monthly Indicators 2017 We can comfortably consider the first quarter to have been a good start for residential real estate in 2017. There was certainly plenty to worry over when the year began. Aside
Modeling Housing Affordability in Corpus Christi, Texas
 Modeling Housing Affordability in Corpus Christi, Texas December 13, 2018 Overview I. Background II. Owner-Occupied Housing Affordability III. Renter-Occupied Housing Affordability IV. Future Housing Needs
Monthly Indicators - 4.9% - 0.7% % Market Overview New Listings Pending Sales. Closed Sales. Days on Market Until Sale. Median Sales Price
 Monthly Indicators 2018 If the last few months are an indication of the temperature of housing markets across the country, a period of relative calm can be expected during the last three months of the
Monthly Indicators. January Quick Facts + 1.8% + 9.8% %
 Monthly Indicators 2018 Last month we checked 2017 off as another strong year for Indiana housing markets; and, 2018 is in step so far. Existing-home sales activity held steady in with buyers closing 4,571
Description. Neighboring Retailers
 EXECUTIVE SUMMARY FOR LEASE Lakewood Forest Shopping Center Description Overview AVAILABLE GLA LEASE RATES 1,127-10,220 SF 107,224 SF Call for Rates Cross-access parking lot with Target. Located in affluent,
State of the Nation s Housing 2008: A Preview
 State of the Nation s Housing 28: A Preview Eric S. Belsky Remodeling Futures Conference April 15, 28 www.jchs.harvard.edu The Housing Market Has Suffered Steep Declines Percent Change Median Existing
CITY OF VALDOSTA, GEORGIA ANALYSIS OF IMPEDIMENTS TO FAIR HOUSING CHOICE
 CITY OF VALDOSTA, GEORGIA ANALYSIS OF IMPEDIMENTS TO FAIR HOUSING CHOICE Prepared for: City of Valdosta, Georgia Ms. Mara S. Register, Assistant to the City Manager Public Involvement Department 300 North
Analysis of Impediments to Fair Housing Choice
 STATE OF ARKANSAS Analysis of Impediments to Fair Housing Choice Final Report November 6, 2014 Submitted by: J-QUAD Planning Group, LLC 14683 Midway Rd. Suite # 210 Addison, TX 75001 Office: (972) 458-0600
Monthly Indicators. June Monthly Snapshot + 5.0% % + 6.6%
 Monthly Indicators 2017 Although sales have been robust locally, there has been a general slowdown in sales across much of the country, and this cannot be blamed on negative economic news. Wage growth,
Quick Facts. For Week Ending July 14, 2018 Publish Date: July 23, 2018 All comparisons are to % - 2.7% - 14.
 Weekly Market Report A RESEARCH TOOL FROM THE SAINT PAUL AREA ASSOCIATION OF REALTORS. BROUGHT TO YOU BY THE UNIQUE DATA-SHARING TRADITIONS OF THE REALTOR COMMUNITY For Week Ending July 14, 2018 Publish
Overview AVAILABLE Lot 5: $352,000 Lot 6: $352,000. Area Retailers Demographics 1 MILE 2 MILE 3 MILE. Traffic Counts Contact
 MARKETING PACKAGE FOR SALE Overview AVAILABLE Lot 5: $352,000 Lot 6: $352,000 Description Sites for sale as part of condo regime in Tallgrass Office Park Pflugerville Heights, a D.R. Horton project, expansion
Monthly Indicators. Monthly Snapshot. March % % 0.0%
 Monthly Indicators 2017 We can comfortably consider the first quarter to have been a good start for residential real estate in 2017. There was certainly plenty to worry over when the year began. Aside
HOME Survey. Housing Opportunities and Market Experience. June National Association of REALTORS Research Group
 HOME Survey Housing Opportunities and Market Experience June 2018 National Association of REALTORS Research Group Introduction The Housing Opportunities and Market Experience (HOME) report was created
NORTH DALLAS PREMIUM RETAIL LAND COMPRISED OF THREE SEPARATE SITES
 INTERMANDECO GP, LLC IS PLEASED TO ANNOUNCE THE OFFERING OF NORTH DALLAS PREMIUM RETAIL LAND COMPRISED OF THREE SEPARATE SITES LOCATED IN ONE OF THE NATION'S FASTEST GROWTH MARKETS FRISCO, COLLIN COUNTY,
Housing Affordability: Local and National Perspectives
 University of Pennsylvania ScholarlyCommons 2018 ADRF Network Research Conference Presentations ADRF Network Research Conference Presentations 11-2018 Housing Affordability: Local and National Perspectives
University Town Center
 Retail Space For Lease Property Highlights Estimated 1st Quarter 2016 delivery date Excellent access and visibility from University Drive East Close proximity to high end retail, Texas A&M University,
Monthly Indicators % + 3.1% %
 Monthly Indicators A RESEARCH TOOL PROVIDED BY NORTH TEXAS REAL ESTATE INFORMATION SYSTEMS, INC. 2018 The booming U.S. economy continues to prop up home sales and new listings in much of the nation, although
Weekly Market Activity Report
 X0A0T Weekly Market Report A RESEARCH TOOL FROM THE MINNEAPOLIS AREA ASSOCIATION OF REALTORS BROUGHT TO YOU BY THE UNIQUE DATA-SHARING TRADITIONS OF THE REALTOR COMMUNITY For Week Ending July 14, 2018
Monthly Indicators % % % Activity Overview New Listings Pending Sales. Closed Sales. Days on Market Until Sale. Median Sales Price
 Monthly Indicators 2018 Residential real estate activity has been relatively slow in the first quarter of 2018, yet housing is proving its resiliency in a consistently improving economy. Some markets have
Rental Housing Finance Survey* *and a few observations about gubment data. Rich Levy US Census Bureau Washington, DC April 2014
 Rental Housing Finance Survey* *and a few observations about gubment data Rich Levy US Census Bureau Washington, DC April 2014 1 Gubment CYB The views expressed here do not necessarily reflect those of
REALTOR.COM MARKET OUTLOOK
 REALTOR.COM MARKET OUTLOOK Realtor.com Economics January 2019 2019 Move, Inc. All rights reserved. Do not copy or distribute. AGENDA Economic and housing data and insights from realtor.com National Forecast
Monthly Indicators % + 9.4% % Activity Overview New Listings Pending Sales. Closed Sales. Days on Market Until Sale. Median Sales Price
 Monthly Indicators 2017 The number of homes for sale, days on market and months of supply were all down in year-over-year comparisons in a majority of the country for the entirety of 2017, as was housing
McAllen,TX Development Land S. 35 th Street, McAllen, TX 78501
 McAllen,TX Development Land S. 35 th Street, McAllen, TX 78501 FOR SALE Rio Grande Valley PROPERTY OVERVIEW This great piece of property sits ideally in the path of McAllen s growth and has excellent proximity
Market Profile -- Near North Side [8]
![Market Profile -- Near North Side [8]](/thumbs/71/66007439.jpg "Market Profile -- Near North Side [8]") Market Profile -- Near North Side [8] Demographic Profile Total Population in 2009 82,949 Children (Under 18) 10,138 Seniors (65+) 10,633 Total Population in 2000 72,811 Population Density in 2009 30,836
Market Profile -- Near North Side [8] Demographic Profile Total Population in 2009 82,949 Children (Under 18) 10,138 Seniors (65+) 10,633 Total Population in 2000 72,811 Population Density in 2009 30,836
SJC Comprehensive Plan Update Housing Needs Assessment Briefing. County Council: October 16, 2017 Planning Commission: October 20, 2017
 SJC Comprehensive Plan Update 2036 Housing Needs Assessment Briefing County Council: October 16, 2017 Planning Commission: October 20, 2017 Overview GMA Housing Element Background Demographics Employment
Monthly Indicators % % % Market Overview New Listings Pending Sales. Closed Sales. Days on Market Until Sale. Median Sales Price
 Monthly Indicators 2017 We can comfortably consider the first quarter to have been a good start for residential real estate in 2017. There was certainly plenty to worry over when the year began. Aside
MARKET OUTLOOK FOR SAN MATEO
 MARKET OUTLOOK FOR SAN MATEO Jonathan Smoke Chief Economist August 2, 2016 NATIONAL TRENDS 2 JOB CREATION REBOUNDED IN JUNE 229,000 jobs created by month in 2015; 172,000 average this year Employment and
& Duplexes Real Estate Properties
 2011 Business Plan for Acquisition of Condos Table of Contents & Duplexes Real Estate Properties 1. Overview State: California 1.1 Executive Summary County s: Sacramento County s 1.2 Investor Background
National Association of REALTORS Member Profile National Association of realtors
 National Association of REALTORS 2013 Member Profile 2013 National Association of realtors National Association of REALTORS Introduction In 2012, many areas of the country started to see both home sales
Manufactured Housing in Minnesota
 Manufactured Housing in Minnesota Overview and Policy Challenges Study authors: Kim Skobba & Leigh Rosenberg Presenters: Chip Halbach & Leigh Rosenberg Why manufactured housing? Important source of unsubsidized
Monthly Indicators + 1.2% - 2.1% % Activity Overview New Listings Pending Sales. Closed Sales. Days on Market Until Sale. Median Sales Price
 Monthly Indicators 2017 We can comfortably consider the first quarter to have been a good start for residential real estate in 2017. There was certainly plenty to worry over when the year began. Aside
Monthly Indicators + 0.4% + 8.5% - 0.8%
 Monthly Indicators A RESEARCH TOOL PROVIDED BY NORTH TEXAS REAL ESTATE INFORMATION SYSTEMS, INC. 2017 The number of homes for sale, days on market and months of supply were all down in year-over-year comparisons
Housing Price Forecasts. Illinois and Chicago PMSA, August 2016
 Housing Price Forecasts Illinois and Chicago PMSA, August 2016 Presented To Illinois Association of Realtors From R E A L Regional Economics Applications Laboratory, Institute of Government and Public
CITY OF MEDFORD OREGON
 CITY OF MEDFORD OREGON ANALYSIS OF IMPEDIMENTS TO FAIR HOUSING CHOICE Submitted: May 15, 2015 Contact: Parks and Recreation Department Grants Administrator 701 North Columbus Avenue Medford, Oregon 97504
Monthly Indicators % - 0.2% - 9.5% Activity Overview New Listings Pending Sales. Closed Sales. Days on Market Until Sale. Median Sales Price
 Monthly Indicators 2015 Home prices were up during summer across the nation in year-over-year comparisons. With the economy on full mend, Federal Reserve Chair Janet Yellen has predicted a fine-tuning
Description. Demographics 1 MILE 3 MILE 5 MILE. Traffic Counts
 MARKETING PACKAGE FOR SALE Walmart Outparcels Overview AVAILABLE Lot 1: +/- 0.71 AC, Lot 2: +/- 1.22 AC SALES PRICE Lot 1: $750,000, Lot 2: $800,000 Description Walmart opening Summer 2017 Completion of
Monthly Indicators + 3.3% + 1.9% % Market Overview New Listings Pending Sales. Closed Sales. Days on Market Until Sale. Median Sales Price
 Monthly Indicators 2017 How long can the residential real estate market go on like this? We are about two years into a national trend of dropping housing supply and increasing median sales prices. There
Residential Real Estate Market Overview: April 2017 Data
 Residential Real Estate Market Overview: April 2017 Data 2017 Mark A. Melikian Chief Valuation Officer mark.melikian@summitvaluations.com 2800 River Road, Suite 460 The following is a market data summary
Oakland s Housing Equity Roadmap Presentation to Oakland Planning Commission
 Oakland s Housing Equity Roadmap Presentation to Oakland Planning Commission 3.4.15 Goals of the Oakland Housing Equity Roadmap 1. Provide comprehensive policy framework: Provide strategies to address
Town of Frisco 2015 Land Use Profile
 Town of Frisco 2015 Land Use Profile I. Introduction The 2015 Land Use Profile correlates closely with several of the quality of life direction statements from the 2011 Frisco Community Plan. This study
The text of this publication, or any part thereof, may not be reproduced or transmitted in any form or by any means, electronic or mechanical,
 PROPERTY INFORMATION LOCATION 24 & 26 Arcadia Terrace, Santa Monica, CA 90401 PROPERTY DESCRIPTION LOCATION DESCRIPTION LAND SIZE This is an incredible opportunity for a multi-family developer looking
Demographic and Housing Trends
 Demographic and Housing Trends In the New Orleans Metro Presented by: Allison Plyer www.gnocdc.org A product of Nonprofit Knowledge Works 1 Housing Production 2 Demographic and Housing Trends Katrina dramatically
Monthly Indicators - 5.1% + 3.6% % Market Overview New Listings Pending Sales. Closed Sales. Days on Market Until Sale. Median Sales Price
 Monthly Indicators 2015 In 2015, national residential real estate, by and large, had a good year. Supply and demand were healthy in an environment rife with low interest rates and improved employment.
Key Findings on the Affordability of Rental Housing from New York City s Housing and Vacancy Survey 2008
 Furman Center for real estate & urban policy New York University school of law n wagner school of public service 110 West 3rd Street, Suite 209, New York, NY 10012 n Tel: (212) 998-6713 n www.furmancenter.org
Washoe County. Quarterly Revenue and Economic Review
 Washoe County S p e c i a l p o i n t s o f i n t e r e s t : Property taxes were 5.3% lower than they were in the previous year Single Family Home permits were up 28.5% from last year Consolidated Taxes
Jackson County Residental Market Trends. October Pending Sales New Listings
 Jackson County Residental Market Trends October 2015 Pending Sales..2 New Listings..3 Overall activity trends are not a measure of pricing or value for individual properties. Small Sampling sizes can lead
City of New Albany. Analysis of Impediments to Fair Housing Choice Draft. January 16, 2015
 January 16, 2015 City of New Albany Analysis of Impediments to Fair Housing Choice Draft Redevelopment Department 311 Hauss Square, Room 325 New Albany, Indiana 47150 Table of Contents I: Introduction,
Monthly Indicators. Quick Facts. June % + 8.5% + 6.4%
 Monthly Indicators A RESEARCH TOOL PROVIDED BY NORTH TEXAS REAL ESTATE INFORMATION SYSTEMS, INC. 2017 There has been a general slowdown in sales across the country, and this cannot be blamed on negative
Monthly Indicators + 2.0% + 5.5% + 1.0%
 Monthly Indicators A RESEARCH TOOL PROVIDED BY NORTH TEXAS REAL ESTATE INFORMATION SYSTEMS, INC. 2017 The facts of residential real estate have remained consistent in 2017. In year-overyear comparisons,
Friendswood HEB. SWC of FM 518 and FM 528 Friendswood, Texas. Brad Elmore Retail Space Available
 Brad Elmore 281.477.4300 Retail Space Available Leasing Tenant Representation Development Land Brokerage Acquisition Property Management Located at FM 518 and FM 528 the main commercial intersection of
Monthly Indicators + 9.9% - 1.7% % Activity Overview New Listings Pending Sales. Closed Sales. Days on Market Until Sale. Median Sales Price
 Monthly Indicators 2015 All expectations in 2015 are for a healthy and energetic selling season. National stories have been highlighting an increase in new construction sales and pending sales, but national
City of San José. Produced by of San Jose Department of Housing. Housing Market Update Q2 2014
 City of San José Produced by of San Jose Department of Housing Housing Market Update Q2 2014 San José Housing Market 1,280+ multi-family residential permits issued in Q2 2014, thrice the number of permits
2018 Real Estate Forecast Breakfast. Real Estate Market Update
 2018 Real Estate Forecast Breakfast Central Oregon Association of REALTORS Real Estate Market Update Paul C. Bishop, PhD, CBE Vice President, Research NATIONAL ASSOCIATION OF REALTORS February 22, 2018
For Lease Poplar Creek Business Center 7505 Richmond Road Williamsburg, Virginia
 For Lease Poplar Creek Business Center 7505 Richmond Road Williamsburg, Virginia FOR ADDITIONAL INFORMATION, PLEASE CONTACT: Campana Waltz Commercial Real Estate, LLC Ron A. Campana, Jr. 11832 Fishing
Housing Price Forecasts. Illinois and Chicago PMSA, August 2017
 Housing Price Forecasts Illinois and Chicago PMSA, August 2017 Presented To Illinois Realtors From R E A L Regional Economics Applications Laboratory, Institute of Government and Public Affairs University
Young-Adult Housing Demand Continues to Slide, But Young Homeowners Experience Vastly Improved Affordability
 Young-Adult Housing Demand Continues to Slide, But Young Homeowners Experience Vastly Improved Affordability September 3, 14 The bad news is that household formation and homeownership among young adults
PAN AMERICAN PROFESSIONAL CENTER
 PAN AMERICAN PROFESSIONAL CENTER 5690 PAN AMERICAN NORTH PORT, FL 34287 Ray Brunner, MBA CoStar Power Broker Senior Advisor 415.608.1942 ray.brunner@svn.com Randall Dunn Senior Advisor 306.547.4968 randy.dunn@svn.com
Montana Housing Outlook 2015
 Montana Housing Outlook 2015 Paul Olson Home Loans Manager First Interstate Bank Sue Larew Retail Delivery Manager First Interstate Bank Housing Outlook Home is the most important financial asset for a
Champion Auto Wash Pad
 Heather Nguyen John Nguyen 281.477.4300 Pad Site For Sale Leasing Tenant Representation Development Land Brokerage Investment Sales Property Management 8827 W. Sam Houston Parkway N. Suite 200 Houston,
Monthly Indicators - 6.1% + 6.6% + 4.3% Activity Overview New Listings. Closed Sales Median Sales Price
 Monthly Indicators 2017 The number of homes for sale, days on market and months of supply were all down in year-over-year comparisons in a majority of the country for the entirety of 2017, as was housing
Monthly Indicators + 8.8% + 9.0% % Market Overview New Listings Pending Sales. Closed Sales. Days on Market Until Sale. Median Sales Price
 Monthly Indicators 2017 The facts of residential real estate have remained consistent in 2017. In year-overyear comparisons, the number of homes for sale has been fewer in most locales, and homes have
CONTENTS. Executive Summary 1. Southern Nevada Economic Situation 2 Household Sector 5 Tourism & Hospitality Industry
 CONTENTS Executive Summary 1 Southern Nevada Economic Situation 2 Household Sector 5 Tourism & Hospitality Industry Residential Trends 7 Existing Home Sales 11 Property Management Market 12 Foreclosure
BELMONT HOUSING AUTHORITY Application for Public Housing Instructions for Completing and Submitting the Application
 BELMONT HOUSING AUTHORITY Application for Public Housing Instructions for Completing and Submitting the Application The completed application can be either: Completed in its entirety and mailed to the
FOR SALE 6405 WILKINSON BLVD BELMONT, NC $1,075,000. Property Information
 OFFICE FOR SALE $1,75, MECA 645 WILKINSON BLVD BELMONT, NC Property Information SF 16, SF Price $1,75, Features Iconic office building in Belmont for sale. Great investment opportunity. Current gross revenue
Monthly Indicators + 8.7% - 1.6% % Activity Overview New Listings Pending Sales. Closed Sales. Days on Market Until Sale. Median Sales Price
 Monthly Indicators 2018 Residential real estate activity has been relatively slow in the first quarter of 2018, yet housing is proving its resiliency in a consistently improving economy. Some markets have
Monthly Indicators. Monthly Snapshot. April % % + 4.7%
 Monthly Indicators For residential real estate activity in the state of New Jersey 2018 Monthly Snapshot Many sellers and builders are in a good position for financial gains, as the economy continues to
Monthly Indicators % % % Activity Overview New Listings Pending Sales. Closed Sales. Days on Market Until Sale. Median Sales Price
 Monthly Indicators 2017 tends to mark the waning of housing activity ahead of the school year. Not all buyers and sellers have children, but there are enough parents that do not want to uproot their children
Greater Lansing Association of REALTORS Regional Economic Update HOUSING MARKET OUTLOOK FOR 2018
 Greater Lansing Association of REALTORS Regional Economic Update HOUSING MARKET OUTLOOK FOR 2018 Paul C. Bishop, PhD, CBE Vice President, Research NATIONAL ASSOCIATION OF REALTORS January 11, 2018 Today
Section 5: Fair Housing Index
 Section 5: Fair Housing Index Introduction The Fair Housing Index is a measure developed specifically for Analyses of Impediments to Fair Housing. The index combines the effects of several demographic
TENNESSEE HOUSING MARKET
 1st Quarter 212 TENNESSEE HOUSING MARKET David A. Penn, Director Business and Economic Research Center Jennings A. Jones College of Business Middle Tennessee State University This quarterly series is supported
Galveston Station. NWC/SWC of 61st & Avenue L Galveston, Texas. David Meyers Ronnie Miranda CCIM, SIOR
 Galveston Station David Meyers Ronnie Miranda CCIM, SIOR 281.477.4300 Galveston Station Retail Space Available Leasing Tenant Representation Development Land Brokerage Acquisition Property Management 6
9.55 Acres Mills Rd. at Gessner Rd.
 9.55 Acres Mills Rd. at Gessner Rd. Mills Road between Hwy 249 & Gessner Road Houston, TX Brad LyBrand 281.477.4300 9.55 Acres For Sale West Greens Extension W. Greens Road Cutten Road Industrial Area
CITY OF CORPUS CHRISTI, TEXAS ANALYSIS OF IMPEDIMENTS TO FAIR HOUSING CHOICE
 CITY OF CORPUS CHRISTI, TEXAS ANALYSIS OF IMPEDIMENTS TO FAIR HOUSING CHOICE Prepared for: City of Corpus Christi, Texas City of Corpus Christi Community Development Division of Neighborhood Services Department
MARKET AREA UPDATE Year: 2017 Report as of: 1Q 2Q 3Q 4Q
 MARKET AREA UPDATE Year: 2017 Report as of: 1Q 2Q 3Q 4Q Market Area (City, State): Essex, Hunterdon, Middlesex, Morris, Somerset & Union Provided by (Company / Companies): BHHS New Jersey Properties Provided
Former Gordmans N 90th St, Omaha, NE NOW AVAILABLE - FOR SALE OR LEASE
 Former Gordmans NOW AVAILABLE - FOR SALE OR LEASE Agent: Sara Hanke Rick Quinlevan Phone: 402-502-4709 Phone: 402-502-4711 Email: shanke@lernerco.com Email: rquinlevan@lernerco.com 10855 W. Dodge Rd.,
WEST PALMDALE PLAZA VALLEY REALTY
 WEST PALMDALE PLAZA Coldwell Banker Commercial Valley Realty is pleased to present the West Palmdale Plaza located in the city of Palmdale s highly sought after, Trade and Commerce Center! This project
DO NOT DISTURB TENANT
 FORMER RESTAURANT COMMERCIAL BUILDING FOR LEASE 3200 FREDERICKSBURG ROAD SAN ANTONIO, TX 78201 DO NOT DISTURB TENANT LOCATION: This property is located on a corner at Fredericksburg Road and Fresno. DESCRIPTION:
THE OUTLOOK FOR HOUSING IN ILLINOIS
 THE OUTLOOK FOR HOUSING IN ILLINOIS Jonathan Smoke Chief Economist January 25, 2017 NATIONAL TRENDS 2 2000.01 2000.05 2000.09 2001.01 2001.05 2001.09 2002.01 2002.05 2002.09 2003.01 2003.05 2003.09 2004.01
OFFICE OR MEDICAL SPACE FOR LEASE
 OFFICE OR MEDICAL SPACE FOR LEASE www.kowitrealestate.com OFFICE OR MEDICAL SPACE FOR LEASE 14701-14725 Detroit Avenue Lakewood, Ohio Property Highlights Property Photos: Available immediately: 400-20,000
Fairmont Parkway Shopping Center
 Bob Conwell 281.477.4300 Space For Lease Leasing Tenant Representation Development Land Brokerage Acquisition Property Management Located at the southeast quadrant of Beltway 8 & Fairmont Parkway in Pasadena,
FOR SALE/LEASE 202 WEST TRADE STREET DALLAS, NC $375,000 $12.00/SF NNN. Property Information
 OFFICE FOR SALE/LEASE $375, $1./SF NNN MECA WEST TRADE STREET DALLAS, NC Property Information SITE SF,5 SF Price $375, Lease Rate $1./SF NNN Features Former Bank of America Building for sale or lease.
Revised Texas Housing Affordability Index
 Revised Texas Housing Affordability Index James P. Gaines Research Economist Texas A&M University October 2005 2005, Real Estate Center. All rights reserved. Revised Texas Housing Affordability Index Beginning
5 Acres 1958 FM 1463 Rd.
 5 Acres 1958 FM 1463 Rd. FM 1463 and Cane Island Blvd Katy, TX Glenn Dickerson 281.477.4300 5 Acres of Land Available in Greater Katy Area Leasing Tenant Representation Development Land Brokerage Acquisition
Monthly Indicators % + 2.1% %
 Monthly Indicators A RESEARCH TOOL PROVIDED BY NORTH TEXAS REAL ESTATE INFORMATION SYSTEMS, INC. 2019 Despite a strong U.S. economy, historically low unemployment and steady wage growth, home sales began
The Shops at Timberland Crossing
 Josh Friedlander 281.477.4300 100% Leased Leasing Tenant Representation Development Land Brokerage Acquisition Property Management Location (Future Expansion) 170 Keller Haslet Rd. The Shops at Timberland
Moorestown, NJ 08057
 ( 467-2 N D S NEIGHBORHOOD REPORT Moorestown, NJ P r e s e n t e d b y Ricardo Silva REALTOR F a x : 215 ) 2892 R E / M A X O n e R e a l t y 513 S. T P h i l a d e l p h i a, P A 19147 Neighborhood: Housing