FIBRA Macquarie México (BMV:FIBRAMQ) Fourth Quarter 2015 Supplementary Information. 25 February 2016
|
|
|
- Matthew McCarthy
- 5 years ago
- Views:
Transcription
1 FIBRA Macquarie México (BMV:FIBRAMQ) Fourth Quarter 2015 Supplementary Information 25 February 2016
2 Important Information This document has been prepared by Macquarie México Real Estate Management, S.A. de C.V. ( MMREM ), as manager, acting in the name and on behalf of Deutsche Bank México, S.A., Institución de Banca Múltiple, División Fiduciaria ( Deutsche Bank ), as trustee, of FIBRA Macquarie México ( FIBRA Macquarie ). As used herein, the name "Macquarie" or "Macquarie Group" refers to Macquarie Group Limited and its worldwide subsidiaries, affiliates and the funds that they manage. Unless otherwise noted, references to we us, our and similar expressions are to MMREM, as manager, acting in the name and on behalf of Deutsche Bank, as trustee, of FIBRA Macquarie. This document does not constitute an offer to sell or a solicitation of an offer to buy any securities in the United States, and securities may not be offered or sold in the United States absent registration or an exemption from registration under the U.S. Securities Act of 1933, as amended. This document is an outline of matters for discussion only and no representations or warranties are given or implied. This document does not contain all the information necessary to fully evaluate any transaction or investment, and you should not rely on the contents of this document. Any investment decision should be made based solely upon appropriate due diligence and, if applicable, upon receipt and careful review of any offering memorandum or prospectus. This document includes forward-looking statements that represent our opinions, expectations, beliefs, intentions, estimates or strategies regarding the future, which may not be realized. These statements may be identified by the use of words like anticipate, believe, estimate, expect, intend, may, plan, will, should, seek, and similar expressions. The forward-looking statements reflect our views and assumptions with respect to future events as of the date of this document and are subject to risks and uncertainties. Actual and future results and trends could differ materially from those described by such statements due to various factors, including those beyond our ability to control or predict. Given these uncertainties, you should not place undue reliance on the forwardlooking statements. We do not undertake any obligation to update or revise any forward-looking statements, whether as a result of new information, future events or otherwise. No risk control mitigant is failsafe. Notwithstanding the mitigants described herein, losses may occur as a result of identified or unidentified risks. Past performance is no indication of future performance. Certain information in this document identified by footnotes has been obtained from sources that we consider to be reliable and is based on present circumstances, market conditions and beliefs. We have not independently verified this information and cannot assure you that it is accurate or complete. The information in this document is presented as of its date. It does not reflect any facts, events or circumstances that may have arisen after that date. We do not undertake any obligation to update this document or correct any inaccuracies or omissions in it. Any financial projections have been prepared and set out for illustrative purposes only and do not in any manner constitute a forecast. They may be affected by future changes in economic and other circumstances and you should not place undo reliance on any such projections. Recipients of this document should neither treat nor rely on the contents of this document as advice relating to legal, taxation or investment matters and are advised to consult their own professional advisers. No member of the Macquarie Group accepts any liability whatsoever for a direct, indirect, consequential or other loss arising from any use of this document and/or further communication in relation to this document. Any discussion in this document of past or proposed investment opportunities should not be relied upon as any indication of future deal flow. None of the entities noted in this document is an authorized deposit-taking institution for the purposes of Banking Act 1959 (Commonwealth of Australia). The obligations of these entities do not represent deposits or other liabilities of Macquarie Bank Limited ABN ( MBL ). MBL does not guarantee or otherwise provide assurance in respect of the obligations of these entities. This document is not for release in any member state of the European Economic Area. PAGE 1
3 Contents 1 Executive Summary 3 2 Financial Overview 7 3 Consolidated Portfolio Overview 18 4 Industrial Portfolio Overview 24 5 Retail/Office Portfolio Overview 29 6 Capital Deployment 34 A Appendix 36
4 1 Executive Summary
5 Highlights Solid operational performance in 4Q15 and the full year 2015 AFFO growth of 32.2% on a full-year basis & portfolio-wide occupancy growth of 160 bps, resulting in a three-year high of 92.2% Strong financial performance that continued driving distributions 29.9% prior comparable period (pcp) increase in distribution per certificate, to Ps AFFO per certificate increased 27.8% versus pcp Active management of capital structure Approval of debt refinancing program focused on improving debt maturity profile, optimizing cost of debt, adding flexibility to asset management, and adding financing sources Deployed US$193m on 3 acquisitions with a weighted average 8.4% cap rate; additional acquisition closed in Feb 2016 for US$22m; 74% of follow-on capital deployed Commenced Customer First initiative with completion of customer satisfaction survey, implementation of Customer relationship management system and customer events in all key markets Focused on enhancing broker relationships including hosting events such as the Top Performer event PAGE 4
6 Operating Highlights of Industrial Portfolio Strong leasing resulting in 40 bps increase in occupancy QoQ 4Q15 Activity NOI: increased 5.0% QoQ driven by acquisitions, occupancy gains & USD appreciation Leasing: positive net absorption driven by logistics tenants in northern markets (Mexicali, Juarez, Monterrey) leading to a three-year occupancy high Client appreciation events and customer satisfaction survey were conducted. Strategic measures to enhance client satisfaction will take place during 2016 Year-end valuation was performed by CBRE visiting all properties (value of industrial portfolio increased 2.6% YoY in USD) Financial & Operational Metrics Ps. millions; except operating stats 1 4Q15 3Q15 Selected financial metrics Var. (%) vs. 3Q15 4Q14 Var. (%) vs. 4Q14 FY15 FY14 Var. (%) vs. FY14 Revenues % % 2, , % Expenses (79.9) (69.6) 14.8% (63.8) 25.4% (270.0) (231.2) 16.8% NOI % % 1, , % Selected operating and profitability metrics Occupancy (%) EOP 91.8% 91.4% 0.4% 90.0% 1.8% 91.8% 90.0% 1.8% Occupancy (%) Avg. 91.7% 90.6% 1.1% 88.9% 2.8% 90.5% 89.2% 1.3% Rental rate (US$/sqm/m) % % % LTM Retention Rate (%,sqft) 77.0% 78.0% -1.0% 72.0% 5.0% 77.0% 72.0% 5.0% Weighted Average Remaining Lease Term (yrs) % % % NOI margin (%) 87.4% 88.3% -1.0% 86.5% 1.0% 88.0% 87.3% 0.7% 1. All figures are rounded to the nearest decimal point. Any arithmetic inconsistencies are due to rounding. 2. FY rental rates represent the average result for the 12 months ended Dec 31 PAGE 5
7 Operating Highlights of Retail/Office Portfolio Occupancy steady at 94.9% QoQ, 80 bps increase YoY; Rental rate continued to increase 4Q15 Activity Leasing: 5,900 sqm of new and renewed leases in 4Q15 Expansions/Renovations: Closed Fabricas de Francia lease in Tuxtepec for 2,500 sqm of current GLA plus 3,800 sqm of additional GLA Major renovation at Lindavista leading to occupancy increase from 78% to 82% in Q4; currently 87% with signing of new major tenant in Jan 2016 Commenced Tecamac and CSVD expansions Cinemex and Coppel expansions at Irapuato open to public Variable rents increased 41.1% YoY primarily from movie theatres and supermarkets Financial & Operational Metrics Ps. millions; except operating stats 1 4Q15 3Q15 Selected financial metrics Var. (%) vs. 3Q15 4Q14 Var. (%) vs. 4Q14 FY15 FY14 Var. (%) vs. FY14 Revenues % % % Expenses (41.0) (43.5) -5.7% (45.9) -10.6% (167.3) (121.2) 38.1% NOI % % % Selected operating and profitability metrics Occupancy (%) EOP 94.9% 94.9% 0.0% 94.1% 0.8% 94.9% 94.1% 0.8% Occupancy (%) Avg. 94.8% 94.8% 0.0% 94.0% 0.8% 94.4% 94.4% 0.0% Rental rate (US$/sqm/m) % % % LTM Retention Rate (%,sqft) 81.0% 84.0% -3.0% 69.0% 12.0% 81.0% 69.0% 12.0% Weighted Average Remaining Lease Term (yrs) % % % NOI margin (%) 76.6% 75.4% 1.2% 72.8% 5.2% 75.9% 76.9% -1.0% 1. All figures are rounded to the nearest decimal point. Any arithmetic inconsistencies are due to rounding. 2. FY rental rates represent the average result for the 12 months ended Dec 31 PAGE 6
8 2 Financial Overview
9 Income statement in Ps. millions unless otherwise stated Metric 4Q 2015 Ps. 4Q 2014 Ps. Variance Ps. Variance (%) Total 2015 Ps. Total 2014 Ps. Variance Ps. Variance (%) Total Revenues % 2, , % Net Operating Income % 2, , % EBITDA % 2, , % Funds From Operations % 1, , % Adjusted Funds From Operations % 1, , % in US$ millions unless otherwise stated 2 Metric 4Q 2015 US$ 4Q 2014 US$ Variance US$ Variance (%) Total 2015 US$ Total 2014 US$ Variance US$ Variance (%) Total Revenues % % Net Operating Income % % EBITDA % % Funds From Operations % % Adjusted Funds From Operations % % 1. Net operating income ( NOI ) includes lease-related income and other variable income, less property operating expenses (including property administration expenses). Earnings before interest, tax, depreciation and amortization ( EBITDA ) includes NOI less Fund-level management fees, corporate expenses, administrative expenses, professional and legal expenses. Funds from operations ( FFO ) is equal to EBITDA plus interest income less interest expense. FIBRA Macquarie derives AFFO by adjusting FFO for normalized capital expenditure, tenant improvements and leasing commissions. AFFO may be calculated in a different manner by other market participants thereby limiting its use as a comparative measure. Use of AFFO in the analysis of the financial performance of FIBRA Macquarie should be in addition to and not in lieu of other financial measures as required under International Financial Reporting Standards. 2. FX: Average rates used - 4Q2015: ; 4Q2014: ; FY2015: ; FY2014: All figures are rounded to the nearest decimal point. Any arithmetic inconsistencies are due to rounding. PAGE 8
10 Income statement per certificate in Ps. millions unless otherwise stated Metric (per certificate) 4Q 2015 Ps. 4Q 2014 Ps. Variance Ps. Variance (%) Total 2015 (Ps.) Total Total 2014 (Ps.) Total Variance Ps. Variance (%) Net Operating Income % % EBITDA % % Funds From Operations % % Adjusted Funds From Operations % % Number of Certificates (in millions of CBFIs) % % in US$ millions unless otherwise stated 3 Metric (per certificate) 1. Net operating income ( NOI ) includes lease-related income and other variable income, less property operating expenses (including property administration expenses). Earnings before interest, tax, depreciation and amortization ( EBITDA ) includes NOI less Fund-level management fees, corporate expenses, administrative expenses, professional and legal expenses. Funds from operations ( FFO ) is equal to EBITDA plus interest income less interest expense. FIBRA Macquarie derives AFFO by adjusting FFO for normalized capital expenditure, tenant improvements and leasing commissions. AFFO may be calculated in a different manner by other market participants thereby limiting its use as a comparative measure. Use of AFFO in the analysis of the financial performance of FIBRA Macquarie should be in addition to and not in lieu of other financial measures as required under International Financial Reporting Standards. 2. Weighted average for the period. 3. FX: Average rates - 4Q2015: ; 4Q2014: ; FY2015: ; FY2014: All figures are rounded to the nearest decimal point. Any arithmetic inconsistencies are due to rounding. 4Q 2015 US$ 4Q 2014 US$ Variance US$ Variance (%) Total 2015 (US$) Total Total 2014 (US$) Total Variance Ps. Variance (%) Net Operating Income % % EBITDA % % Funds From Operations % % Adjusted Funds From Operations % % Number of Certificates (in millions of CBFIs) % % PAGE 9
11 Distribution Distribution of Ps per certificate 1 Distribution of Ps per certificate 1 Distribution of Ps per certificate 1 Distribution of Ps per certificate 1 First Quarter 2015 Second Quarter 2015 Third Quarter 2015 Fourth Quarter % of Ps in AFFO per certificate % of Ps in AFFO per certificate % of Ps in AFFO per certificate % of Ps in AFFO per certificate 1 FY 2015 distribution of Ps per certificate % of Ps in AFFO per certificate 1 FIBRA Macquarie expects the distribution for 2016 to be between Ps.1.74 and Ps.1.84 per certificate, assuming no material change in the performance of our business. The increase is expected to be driven, in part, by the impact of a full year s contribution from the acquisitions closed in 2015 and continuing strong performance of the US dollar against the Mexican Peso. Due to FIBRA Macquarie s carried forward tax losses as of the date of these distributions, the distributions should not be considered a distribution of taxable income for Mexican income tax purposes and should be considered a capital return which should not be subject to withholding tax. We suggest investors seek tax advice for further guidance on this matter. 1. Based on 811,363,500 certificates PAGE 10
12 Margin analysis Non-IFRS Profitability Margins - Consolidated Metric 4Q 2015 (% of revenues) 4Q 2014 (% of revenues) Variance (bps) Total 2015 (% of revenues) Total 2014 (% of revenues) Variance (bps) Total Revenues (Ps. millions) , , Net Operating Income Margin 85.0% 82.9% % 84.9% 18.9 EBITDA Margin 78.2% 73.6% % 76.2% 93.5 Funds From Operations Margin 53.5% 52.1% % 50.6% Adjusted Funds From Operations Margin 47.6% 46.8% % 45.0% Note: Net operating margin is calculated dividing NOI by Total Revenues EBITDA margin is calculated by dividing EBITDA by Total Revenues FFO margin is calculated dividing FFO by Total Revenues AFFO margin is calculated by dividing AFFO by Total Revenues All figures are rounded to the nearest decimal point. Any arithmetic inconsistencies are due to rounding. PAGE 11
13 Income statement by segment 4Q 2015 (in Ps. millions unless otherwise stated) Non-IFRS Profitability - by Segment Metric Fund level Ps. Wholly-Owned Industrial Ps. Retail/office Ps. Consolidated Results Ps. Joint Venture Retail/office (50%) Ps. Proportionally Combined Ps. Total revenues Net Operating Income (0.0) Net Operating Income Margin n/a 87.4% 81.6% 86.4% 63.3% 85.0% EBITDA (54.6) EBITDA Margin n/a 87.3% 81.3% 79.1% 63.2% 78.2% Funds From Operations (42.7) Funds From Operations Margin n/a 61.9% 53.6% 54.9% 30.6% 53.5% Adjusted Funds From Operations (42.7) Adjusted Funds From Operations Margin n/a 55.0% 52.0% 48.9% 26.9% 47.6% All figures are rounded to the nearest decimal point. Any arithmetic inconsistencies are due to rounding. PAGE 12
14 AFFO bridge quarter-on-quarter Acquisitions contributing for the full quarter and the strengthening of the U.S. dollar were the main drivers for QoQ AFFO growth AFFO per Certificate in Ps. 3Q15 to 4Q % % -0.4% % % % % Q15 AFFO 1. Net Contribution From Acquisitions 2. FX Impact 3. Decreased Management Fee & Corporate G&A 4. Decrease Same Store Income 5. Increased Same Store Expenses 6. Increased TIs, Leasing Commission & Normalized Capex 4Q15 AFFO PAGE 13
15 AFFO bridge year-on-year Acquisitions and the strengthening of the U.S. dollar were the main drivers for YoY AFFO growth AFFO per Certificate in Ps. 4Q14 to 4Q % % +0.9% % % % % Q14 AFFO 1. Net Contribution From Acquisitions 2. FX Impact 3. Increase Same Store Income 4. Decreased Same Store Expenses 5. Decreased Interest Income 6. Increased TIs, Leasing Commission & Normalized Capex 4Q15 AFFO PAGE 14
16 Regulatory leverage ratios For statutory debt disclosure, please refer to the Mexican Bolsa website ( Leverage Ratio 1 Ps. 000 Bank Debt 16,346,990 Bonds - Total Assets 40,543,419 Leverage Ratio = 16,346,990 40,543,419 = 40.3% (Regulatory Limit 50%) Debt Service Coverage Ratio ( ICD t ) Ps. 000 t=0 6 t=1 AL 0 Liquid Assets 2,223,294 - IVA t Value added tax receivable - 287,020 UO t Net Operating Income after dividends - 1,606,913 LR 0 Revolving Debt Facilities - - I t Estimated Debt Interest Expense - 1,196,573 P t Scheduled Debt Principal Amortization 2-940,000 K t Estimated Recurrent Capital Expenditures - 127,987 D t Estimated Non-Discretionary Development Costs - 576,485 ICD t = 2,223, , ,606,913 1,196, , , ,485 = 1.4x (Regulatory Minimum 1.0x) 1. Excludes debt associated with the Grupo Frisa JV as this is accounted for using the equity accounting method 2. Excludes debt of Ps.575.7m associated with the Grupo Frisa JV expiring in April 2017 PAGE 15
17 Debt disclosure For statutory debt disclosure, please refer to the Mexican Bolsa website ( Debt Associated with Wholly-Owned Properties Lenders 1 Debt Associated with Grupo Frisa JV 7 1. Some of these facilities have been syndicated with other lenders 2. Includes capitalized upfront borrowing costs which are amortized over the term of the relevant loan. FX: Ps per USD. 3. Interest only subject to compliance with certain debt covenants 4. Lenders have recourse only to the properties, cash flows and other reserves constituted under the facilities, except under certain limited circumstances in which the lenders have recourse against the borrowers and/or FIBRA Macquarie 5. Subject to meeting certain conditions 6. BRE Debt Mexico II, S.A. de C.V., SOFOM. E.N.R. assigned its rights as lender to Banco Mercantil del Norte, S.A., Institución de Banca Múltiple, Grupo Financiero Banorte, División Fiduciaria, as trustee of guaranty Trust number F/ Proportionate share 8. BRE Debt Mexico II, S.A. de C.V., SOFOM. E.N.R. assigned its rights as lender to Banco Mercantil del Norte, S.A., Institución de Banca Múltiple, Grupo Financiero Banorte, División Fiduciaria, as trustee of guaranty Trust number F/ Loan Currency Outstanding balance USD (in millions) 2 Outstanding balance Ps. Commencement (in millions) 2 Rate p.a. Amortization 3 Security Type 4 Date Blackstone through its subsidiary in Mexico BRE USD , % Interest Only Guaranty Trust, Debt Mexico II, S.A. de C.V., SOFOM E.N.R. 6 among others Blackstone through its subsidiary in Mexico BRE USD , day Libor Debt Mexico II, S.A. de C.V., SOFOM E.N.R % Interest Only Guaranty Trust, among others Blackstone through its subsidiary in Mexico BRE USD , % Interest Only Guaranty Trust, Debt Mexico II, S.A. de C.V., SOFOM E.N.R. 6 among others Blackstone through its subsidiary in Mexico BRE USD , day Libor Debt Mexico II, S.A. de C.V., SOFOM E.N.R % Interest Only Guaranty Trust, among others Metropolitan Life Insurance Company USD , % Interest Only Guaranty Trust, among others Banco Nacional de México, S.A. Ps % Interest Only Guaranty Trust, among others Total ,347.0 Lenders 1 Loan Currency Outstanding balance USD (in millions) 2 Outstanding balance Ps. Commence (in millions) 2 Rate p.a. Amortization 3 Security Type 4 -ment Date Blackstone through its subsidiary in Mexico BRE Ps % Interest Only Guaranty Trust, Debt Mexico II, S.A. de C.V., SOFOM E.N.R. 8 among others Metropolitan Life Insurance Company Ps % Interest Only Guaranty Trust, among others Total Maturity Date Extended Maturity Date 5 Dec-12 Dec-17 Dec-19 Dec-12 Dec-17 Dec-19 Dec-12 Dec-17 Dec-19 Dec-12 Dec-17 Dec-19 Dec-12 Jan-18 - Nov-13 Oct-16 - Maturity Date Extended Maturity Date 5 Mar-14 Apr-17 Mar-19 Mar-14 Apr-19 - PAGE 16
18 Debt overview Debt Structure Overview Effective use of leverage in line with our borrowing policy and applicable regulations Regulatory LTV of 40.3% and Regulatory Debt Service Coverage Ratio of 1.4x Weighted average cost of debt of 5.0% Balance Sheet Snapshot Debt Breakdown 2 As of December 31, 2015 (Ps. millions) As of December 31, (USD millions) As of September 31, 2015 (Ps. millions) As of September 31, (USD millions) Cash, equivalents & restricted cash 2, , VAT receivable Total debt 16, , Net debt 13, , Investment properties 35, , , ,050.9 Equity accounted investees By currency MXN 10% USD 90% By interest rate type Variable 27% Fixed 73% Key Ratios (proportionately combined) Total 7.6x Total and Net Debt to EBITDA 8.4x 6.7x 5.4x Interest Coverage Ratio 3 2.8x 2.6x LTV % 39.6% Net as of Dec 31, 2015 as of Dec 31, 2014 Dec 31, 2015 (LTM) Dec 31, 2014 (LTM) as of Dec 31, 2015 as of Dec 31, FX: December 31, 2015: ; September 30, 2015: Proportionately combined 3. Interest coverage ratio calculated as EBITDA / Interest Expense (LTM) 4. Regulatory LTV PAGE 17
19 3 Consolidated Portfolio Overview


 Industrial 274 387 91.8% 2,956 Retail and office 1 17 743 94.9% 445 Total 291 1,130 92.")
 NOI 4 Retail and office 22% By sector 2 Industrial 78% US$158mm US$ 73% 1.")
20 FIBRA Macquarie at a glance as of December 31, 2015 Strategic Focus FIBRA Macquarie focuses on the acquisition, ownership, leasing and management of industrial and retail/office real estate properties in Mexico. Industrial properties administered by an internal property administration platform focused on providing high-quality customer service to current tenants and attracting new tenants. Retail/office properties that provide a range of basic services and are located in high density urban areas, primarily in the Mexico City Metropolitan Area. Portfolio Summary Type # of properties # of tenants Occupancy GLA ( 000 m 2 ) Industrial % 2,956 Retail and office % 445 Total 291 1, % 3,401 Financial summary Metric Market capitalization 2 Total assets 2 (proportionately combined) Diversified Rental Revenue (% of revenues) MXN$ 27% By currency 2 Amount US$1,030mm US$2,408mm Regulatory leverage ratio % Last Twelve Months ( LTM ) NOI 4 Retail and office 22% By sector 2 Industrial 78% US$158mm US$ 73% 1. Includes 100% of the property information with respect to each of the nine retail/office properties held through a 50/50 joint venture with Grupo Frisa 2. FX: December 31, 2015: Ps Calculated as total debt / total assets 4. FX: Average rate - FY2015: PAGE 19
21 Geographic footprint as of December 31, 2015 Tijuana 30 / 6.7% Mexicali 14 / 3.1% Nogales 2 / 2.2% Cd. Juárez 1 41 / 12.1% Chihuahua 18 / 4.7% Saltillo 11 / 3.6% GLA by geography Hermosillo 11 / 4.9% Los Mochis 1 / 0.6% Industrial Retail/Office Combined Location Number of Properties/ % of total GLA 1. Includes one property in Ascensión, Chihuahua 2. Mexico City Metropolitan Area (MCMA) Note: Includes nine retail/office properties held through a 50/50 joint venture with Grupo Frisa La Paz 1 / 0.2% Durango 1 / 0.6% Guadalajara 9 / 2.9% Querétaro 11 / 5.4% MCMA 2 17 / 10.6% Monterrey 38 / 16.2% Nuevo Laredo 9 / 3.1% Reynosa 29 / 8.9% Matamoros 12 / 4.2% San Luis Potosí 7 / 2.1% Irapuato 1 / 0.5% Puebla 23 / 5.1% Tuxtepec 2 / 0.9% Cancún 2 / 1.0% Villahermosa 1 / 0.5% Bajio 11% Logistics, 7% Central 16% Other Industrial, 10% Anchor Retail 7% Packaging, 4% Medical, 3% GLA by sector Electronics, 9% Other 2% Other Retail, 6% North 71% Automotive, 34% Consumer Goods, 18% PAGE 20
22 4Q15 Key portfolio metrics Occupancy (end of quarter) Retention Rate (LTM by GLA, signing date) 96.0% 94.0% 92.0% 90.0% 88.0% Industrial Retail/Office Portfolio 94.1% 94.9% 94.9% 94.1% 94.4% 91.9% 92.2% 90.6% 90.7% 90.9% 91.4% 91.8% 90.0% 90.1% 90.3% 100% 90% 80% 70% 60% Industrial Average Industrial 84% 80% 77% 72% 69% 69% Retail/Office Average Retail/Office 84% 81% 78% 77% 80% 75% 86.0% 4Q14 1Q15 2Q15 3Q15 4Q15 50% 4Q14 1Q15 2Q15 3Q15 4Q15 US$ Rental Rates (Avg Monthly Rent per Leased m 2, end of qtr) Industrial ($US) Average Industrial Retail/Office (Ps.) Average Retail/Office Q14 1Q15 2Q15 3Q15 4Q15 MX$ Yrs Weighted Avg Lease Term (years) (by annualized rent, end of qtr) Industrial Retail/Office Q14 1Q15 2Q15 3Q15 4Q PAGE 21
23 MXN/sqm/month USD/month/sqm Rental Rate Bridges quarter-on-quarter Industrial Rental Rate Bridge from 3Q15 to 4Q15 (US$) Contractual rent increases were offset by lower-than-portfolio-average rents in new and renewed leases Retail Rental Rate Bridge from 3Q15 to 4Q15 (Ps.) Contractual increases were the driver for rental rate increases in retail/office % % % % Sep-15 Contract Increase Renewal Increase Move-Outs FX Renewal Decrease % % % % % New Leases % % Dec % 139 Sep-15 Contract Increase New Leases Move Outs Dec-15 PAGE 22
24 MX$/sqm/month $US/month/sqm Rental Rate Bridges year-on-year Industrial Rental Rate Bridge from 4Q14 to 4Q15 (US$) Contractual increases and higher-than-portfolio-average rents in acquisitions were offset by lower-thanportfolio-average rents on new and renewed leases Dec % Contract Increase % Renewal Increase Retail Rental Rate Bridge from 4Q14 to 4Q15 (Ps.) Contractual increases were the driver for rental rate increases in retail/office % % % Acquisitions FX Renewal Decrease % % % Move-Outs New Leases Dec % -3.0% +1.9% +2.3% Dec-14 Contract Increase New Leases Move-Outs Dec-15 PAGE 23
25 4 Industrial Portfolio Overview
26 FIBRA Macquarie s industrial presence in Mexico Highlights 73.9% of annualized base rents are received from light manufacturing clients that typically have high switching costs 94% of rents denominated in USD Majority of contracts are inflation-protected 1 Weighted average remaining lease term is 3.1 years All industrial properties administered by our internal property administrator Leading presence in key growth industries with high-quality tenants Packaging 4% % of annualized base rent Other 10% Well-balanced lease expiration profile % of annualized base rent 4.8% In regularization 17.1% 16.5% 18.6% 42.9% and thereafter Leading presence in key markets Other 16% % of annualized base rent Monterrey 19% Medical 5% Nogales 3% Logistics 8% Automotive 41% Matamoros 4% Saltillo 5% Juarez 12% Chihuahua 5% Electronics 12% Queretaro 6% Reynosa 10% Consumer Goods 19% Puebla 7% Hermosillo 7% Tijuana 7% Top 10 tenants represent approximately 25.4% of annualized base rent and have a remaining lease term of 4.1 years 1. The majority of these leases contain contractual increases in rent at rates that are either fixed or tied to inflation (generally based on the U.S. Consumer Price Index if the lease rents are denominated in US.. Dollars or based on the Mexican Consumer Price Index if the lease rents are denominated in Pesos) PAGE 25
27 Industrial leasing outlook and key market overview FIBRA Macquarie expects to benefit from the continued positive market fundamentals Stable Mexico Market Fundamentals 2015 leasing activity was good across the Mexican industrial market lead by the automotive sector Vacancy rates are below 9% in most markets, new supply at a prudent pace 4Q15 FIBRA Macquarie Leasing Highlights Three-year occupancy high of91.8% New and renewed leases totalled 99,700 m 2 100% of new leases in northern markets 80% of GLA leased for logistic purposes Looking Ahead The auto-sector will still drive the demand in 2016 Leverage operating platform to drive property-level value creation and customer satisfaction North Bajio Central Other Total Number of Buildings Number of Tenants Square Meters '000s 2, ,956.1 Occupancy 90.1% 100.0% 96.6% 100.0% 91.8% % Annualized Base Rent 78.6% 12.2% 8.5% 0.7% 100% Avg. Monthly US$ Rent per Leased m 2 $4.39 $4.26 $4.94 $5.03 $4.42 m 2 in '000's Industrial Leasing Activity New Leases Renewals Expansions Q14 2Q14 3Q14 4Q14 1Q15 2Q15 3Q15 4Q15 All figures are rounded to the nearest decimal point. Any arithmetic inconsistencies are due to rounding. PAGE 26
28 Internal property administration platform Overview Internal property administration platform currently administers our 274 industrial properties in 21 markets 10 offices across the country with 60+ employees Provides direct relationship with 350+ tenants enabling us to deliver high-quality customer service Scalable platform with the capacity to integrate additional properties Allows for optimization of operating costs Tijuana Mexicali Ciudad Juárez Monterrey 2015 Highlights Leasing: signed 89 new/renewal leases (5.3m sqft) and processed 16 move-outs (1.0m sqft) Acquisitions: 16 new properties (3.3m sqft of GLA) integrated with no additional hires or expenses Focused on continual process and system improvements to: Improved customer service new CRM system, customer satisfaction survey & tablet-based inspection system Improved invoicing system Improved financial reporting new process for consolidating financial statements across industrial & retail and internalised fund accounting function Hermosillo Reynosa Puebla Chihuahua Querétaro Mexico City MPA Headquarters Regional Office PAGE 27


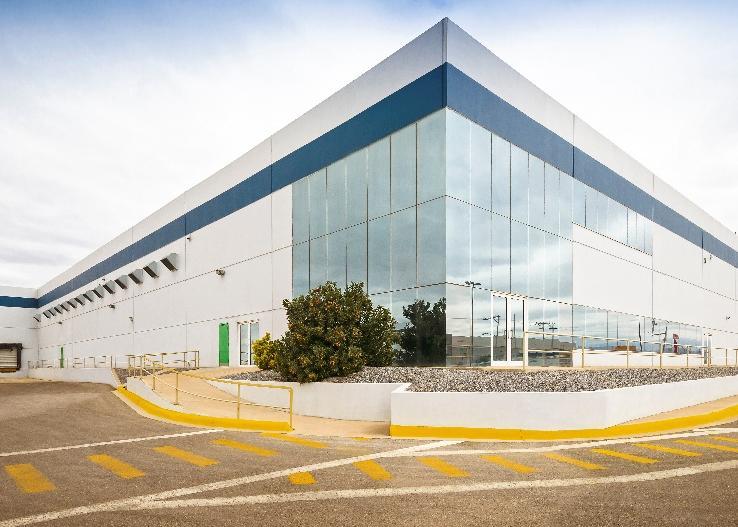

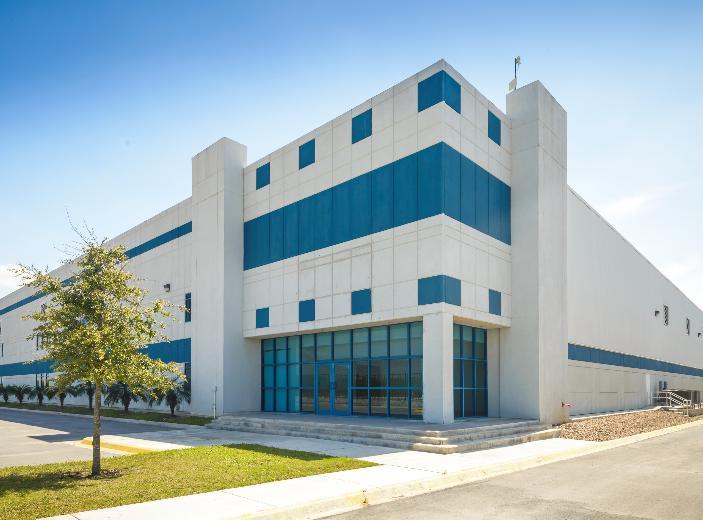
29 Selected FIBRA Macquarie industrial properties PAGE 28
30 5 Retail/Office Portfolio Overview
31 Retail/Office portfolio highlights Portfolio Highlights During the quarter, a new expansion lease was signed with Fabricas de Francia, which, upon completion, will add 3,400 sqm of additional GLA in 2H Also signed and renewed 63 leases totalling 5,900 sqm, which was partially offset by 21 move outs that resulted in a net increase in occupied GLA of 3,000 sqm. Early in 2016 signed a 1,200 sqm lease with a major Mexican fitness company. Important Presence in Key Metro Areas % of annualized base rent Cancun 4% Tuxtepec 5% Monterrey 8% Irapuato 3% Guadalajara 2% MCMA 78% Lease Expiration Profile % of annualized base rent Top 10 tenants represent approximately 47.9% of annualized base rent and have a remaining lease term of 9.1 years Sub- Anchors 12% Office 18% 4.8% % of annualized base rent Other 5% 13.5% 13.5% 14.3% Anchor 32% Community Shopping Center 24% Mixed Use 12% 54.0% In regularization and thereafter % of annualized base rent Urban Infill 24% Office 9% 88% located in top 3 retail and office markets in Mexico 2 Small Shops 32% Power Center 32% 1. The majority of our leases contain contractual increases in rent at rates that are either fixed or tied to inflation (based on the official Mexican Consumer Price Index); 2. Refers to Mexico, Monterrey and Guadalajara; by GLA 3. Includes Grupo Lancedo. The Lancedo lease between Grupo Lancedo and SSP expires in July, the Lease with Lancedo office building expires in PAGE 30
32 Retail/Office leasing outlook FIBRA Macquarie expects to benefit from the continued positive market fundamentals Leasing highlights Signed a new lease with Fabricas de Francia, which should contribute to rental income in the second half of 2016 This lease will add 3,400 square meters of additional GLA Coppel opened their San Roque store on January 29, 2016 In February 2016 Cinemex opened in San Roque property adding 3 screens In January 2016 a 1,200 square meters was signed with a major Mexican fitness company m 2 in '000's Retail leasing activity New Leases Renewals Expansions North Bajio Central Other Total Number of Buildings Number of Tenants Square Meters '000s Occupancy 83.3% 94.5% 97.7% 86.9% 94.9% % Annualized Base Rent 7.8% 4.4% 78.2% 9.5% 100% Avg. Monthly Rent Ps per Leased m 2 US$ 9.43 FX Ps US$ 5.91 Ps US$ 8.66 Ps Ps US$ 6.1 US$ 8.22 All figures are rounded to the nearest decimal point. Any arithmetic inconsistencies are due to rounding Q14 3Q14 4Q14 1Q15 2Q15 3Q15 4Q15 PAGE 31
33 Retail/office segment overview Wholly-owned portfolio continues to deliver strong results and high occupancy rates Eight properties: two power centers, three urban infill, one office building, one community shopping center and one mixed-use property. Main anchors include Walmart, Sam s Club, Home Depot Property administration by CBRE Mexico Leased GLA increased by 3,400 square meters YoY, which has driven an occupancy increase of 50 bps 6.7% YoY increase in foot traffic Plazaragoza experienced a 61.9% YoY increase in foot traffic, mainly due to the addition of services-oriented tenants like banks Coacalco Power Center continues to perform strongly alongside the opening of a new adjacent shopping mall Wholly-owned retail/office 4Q15 Occupancy 98.0% Average monthly rental rate (in Ps.) Weighted average lease term remaining 6.2 Joint venture properties constantly increasing occupancy Nine properties: six community shopping centers, two urban infill and one mixed-use property Main anchors include Walmart, Cinemex and Chedraui Property administration by Grupo Frisa 50% equity partner in JV Over 40 years of experience in developing and administering retail properties in Mexico Leased GLA has incresed by 1,000 square meters YoY, which has driven an occupancy increase of 108 bps Joint venture retail/office 4Q15 Occupancy 90.7% Average monthly rental rate (in Ps.) Weighted average lease term remaining 5.2 PAGE 32


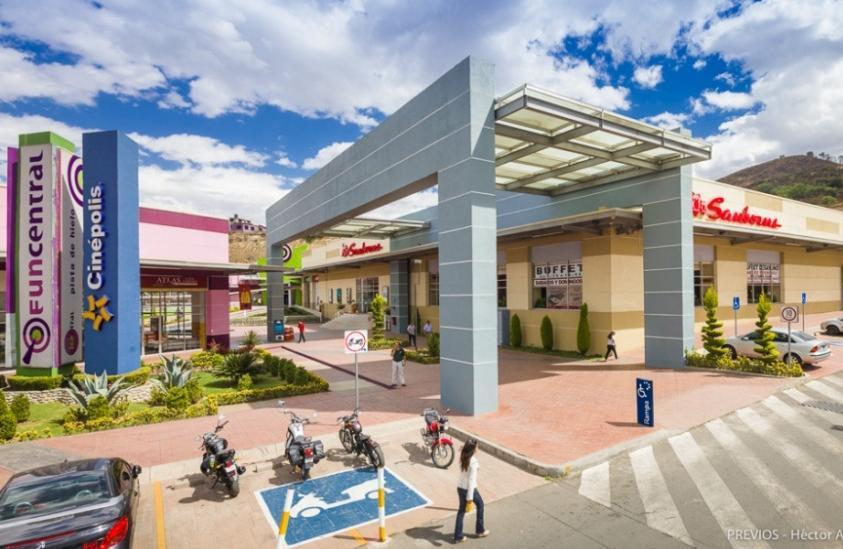

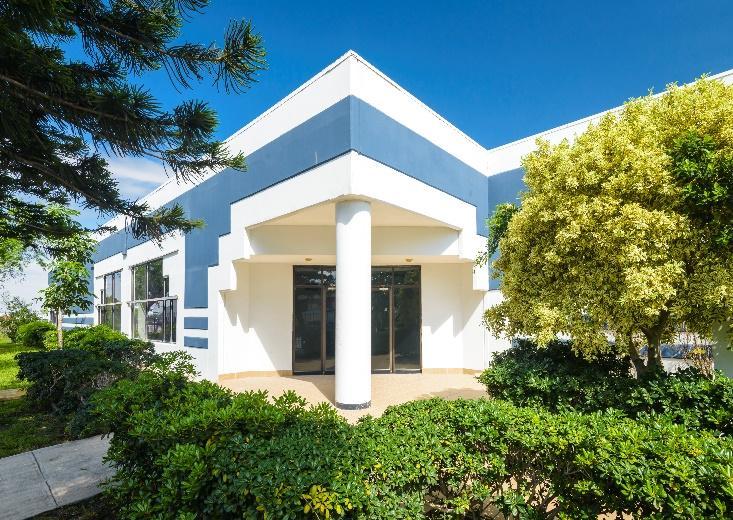
34 Selected FIBRA Macquarie retail/office properties PAGE 33
35 6 Capital Deployment

36 Acquisition track record Significant contributions of high-quality properties to GLA 000 m 2 Industrial GLA Retail/Office GLA Total GLA , , ,436 Dec 12 Oct 13 Nov 13 Nov 13 Mar 14 Inception DCT FCM Carr 3 Kimco 4 Ridge Nexxus Insitutional Owner Expansions Properties N/A Seller GECREM and CPA DCT FCM Carr Kimco Ridge Nexxus Insitutional Owner N/A FY15 Total Los Bravos N/A Total Capital deployment 1,420m 83m 154m 217m 113m 58m 30m 105m N/A 2.2bn (US$) 1 completed/ committed Rationale Formed one of the largest industrial portfolios in Mexico High-quality properties in strong industrial markets Properties with highquality tenants in the MCMA 2 Premium urban infill properties located primarily in the MCMA 2 Expanded retail segment with a highgrowth potential portfolio JV Class A building located in Monterrey. 10 year remaining lease term Young high-quality assets to increase presence in Monterrey Increased presence in strategic markets Addressed space needs of our customers at an attractive return 22m Add wellknown institutional tenants by expanding presence in a key northern city 2.2bn Weighted Avg. Cap Rate 8.4% Note: As of December 31, 2015: 1. Excludes earn-out payments; 2 Mexico City Metropolitan Area; 3 Includes four retail, one office and 1 mixed use property; 4 Held through a joint venture with Grupo Frisa, with an aggregate GLA of191,300 m 2 ; 5 Completed on July 23, 2015; 6 Includes two land parcels and two build-to-suit properties; 7 Completed on August 19, 2015; 8 Organic growth using existing land on currently owned properties; 9 Transaction completed on February 9, 2016 and a parcel of land; PAGE 35

37 A APPENDIX Definitions and Supplementary Information
38 Definitions Net operating income (NOI) includes lease-related income and other variable income, less property operating expenses (including property administration expenses). Earnings before interest, tax, depreciation and amortization (EBITDA) includes NOI less Fund-level management fees, corporate expenses, administrative expenses, professional and legal expenses. Funds from Operations (FFO) is equal to EBITDA plus interest income less interest expense. FIBRA Macquarie derives AFFO by adjusting FFO for normalized capital expenditure, tenant improvements and leasing commissions. AFFO may be calculated in a different manner by other market participants thereby limiting its usefulness as a comparative measure. Use of AFFO in the analysis of the financial performance of FIBRA Macquarie should be in addition to and not in lieu of other financial measures as required under International Financial Reporting Standards (IFRS). PAGE 37
39 IFRS net profit to NOI adjustments by segment (in Ps. millions unless otherwise stated) for the 3 months ended Dec 31, 2015 Dec 31, 2014 Fund Wholly Owned Consolidated JV Proportionally Proportionally Industrial Retail Results Retail Combined Combined Ps. Ps. Ps. Ps. Ps. Ps. Ps. (Loss)/profit for the period per Interim Financial Statements (34.2) ,819.1 Adjustment items: Management fees Transaction related expenses (2.1) Professional, legal and general expenses Interest expense Interest income (11.9) (0.9) (0.5) (13.2) (0.1) (13.3) (39.0) Other income (42.4) (42.4) (52.0) Foreign exchange (gain)/loss (14.2) ,106.3 Net unrealized FX (gain)/loss on investment property - (327.0) - (327.0) - (327.0) (1,819.2) Revaluation gain on investment properties - (276.1) 14.5 (261.7) (0.1) (261.7) (734.6) Net Property Income Adjustment items: Tenant improvements amortisation Leasing commissions amortisation Net Operating Income NOI includes lease-related income and other variable income, less property operating expenses (including property administration expenses). Note: A proportionate share of revenue and expenses relating to the nine retail properties held through the 50/50 joint venture with Grupo Frisa has been included in the respective categories above. 2. Leasing commissions amortization includes internal leasing services. All figures are rounded to the nearest decimal point. Any arithmetic inconsistencies are due to rounding. PAGE 38
40 Funds from operations ( FFO ) 1 & adjusted funds from operations ( AFFO ) 2 adjustments by segment (in Ps. millions unless otherwise stated) for the 3 months ended Dec 31, 2015 Dec 31, 2014 Fund Wholly Owned Consolidated JV Proportionally Proportionally Industrial Retail Results Retail Combined Combined Ps. Ps. Ps. Ps. Ps. Ps. Ps. Net Operating Income Management fees (46.7) - - (46.7) - (46.7) (52.9) Professional and legal expenses (8.9) - - (8.9) - (8.9) (6.9) EBITDA 3 (55.6) Financial income Interest expense 4 - (161.3) (35.6) (196.9) (15.8) (212.7) (177.3) Funds From Operations (43.7) for the 3 months ended Dec 31, 2015 Dec 31, 2014 Fund Wholly Owned Consolidated JV Proportionally Proportionally Industrial Retail Results Retail Combined Combined Ps. Ps. Ps. Ps. Ps. Ps. Ps. Funds From Operations (43.7) Tenant improvements - (15.1) - (15.1) - (15.1) (6.8) Leasing commissions - (15.9) (1.2) (17.0) (0.5) (17.5) (14.2) Normalized capital expenditure 5 - (13.0) (0.9) (14.0) (1.3) (15.3) (13.3) Adjusted Funds From Operations (43.7) FFO is equal to EBITDA plus interest income less interest expense 2. AFFO is derived by adjusting FFO for normalized capital expenditure, tenant improvements and leasing commissions 3. EBITDA includes NOI less Fund-level management fees, corporate expenses, administrative expenses, professional and legal expenses 4. Excludes amortization of upfront borrowing costs 5. Excludes expansions Note: All figures are rounded to the nearest decimal point. Any arithmetic inconsistencies are due to rounding. PAGE 39
41 Detailed IFRS consolidated income statement by segment (in Ps. millions unless otherwise stated) for the 3 months ended Dec 31, 2015 Dec 31, Fund Wholly Owned Consolidated JV Proportionally Proportionally Industrial Retail Results Retail Combined Combined Ps. Ps. Ps. Ps. Ps. Ps. Ps. Lease related income Tenant recoveries Total property related revenues Property management expenses - (16.1) (2.0) (18.1) (3.3) (21.3) (22.0) Property maintenance - (26.6) (2.9) (29.5) (5.8) (35.4) (18.3) Property taxes - (9.5) (3.7) (13.2) (0.8) (14.0) (14.7) Property insurance - (6.7) (0.7) (7.3) (0.4) (7.7) (6.9) Security services - (2.8) (2.5) (5.3) (2.3) (7.5) (8.4) Property related legal and consultancy expenses - (3.3) (3.4) (6.7) - (6.7) (13.4) Tenant improvement amortisation - (3.1) - (3.1) - (3.1) (3.2) Leasing commissions amortisation 2 - (6.6) (0.3) (6.8) (0.2) (7.0) (5.6) Other operating expenses - (15.0) (8.2) (23.3) (5.1) (28.3) (23.9) Total property related expenses - (89.6) (23.6) (113.2) (17.8) (131.0) (118.4) Management fees (46.7) - - (46.7) - (46.7) (52.9) Transaction related expenses (4.7) - - (4.7) - (4.7) 2.1 Professional, legal and general expenses (8.9) - - (8.9) - (8.9) (6.9) Interest expense - (167.8) (36.7) (204.5) (16.7) (221.2) (185.9) Interest income Other income Foreign exchange gain/(loss) 14.2 (153.1) (21.1) (159.9) - (159.9) (1,106.3) Net unrealized FX gain on investment property ,819.2 Revaluation of investment property (14.5) Total other operating income/(expense) (34.2) (71.7) ,294.9 Net income/(loss) (34.2) , Period ending December 31, 2014 results have been conformed to reflect the current period presentation. 2. Leasing commissions amortization includes internal leasing services. Note: A proportionate share of revenue and expenses relating to the nine retail properties held through the 50/50 joint venture with Grupo Frisa has been included in the respective categories above. All figures are rounded to the nearest decimal point. Any arithmetic inconsistencies are due to rounding. PAGE 40
42 Same-store NOI (in Ps. millions unless otherwise stated) The below table shows the NOI contribution in pesos and US Dollars in respect of those properties which have been owned for a continuous period of at least12 months. for the 3 months ended December 31, Variance Ps. Ps. Ps. % Lease rental income % Expenses recharged to tenants (3.8) -9.1% Property income % Property management expense (21.3) (22.0) % Repairs & maintenance (30.6) (18.3) (12.2) 66.8% Other property related expenses (61.3) (69.3) % Property Expenses (113.2) (109.6) (3.6) 3.2% NOI % 1. Average FX used - December 31, 2015: ; December 31, 2014: PAGE 41
43 Admin Cost (Corp G&A) efficiencies (in Ps. millions unless otherwise stated) The below table shows the NOI contribution in pesos and US Dollars in respect of those properties which have been owned for a continuous period of 12 months. For the 3 months ended December 31, Variance Ps. Ps. Ps. % NOI % Management fees (46.7) (52.9) % Professional and legal expenses (8.9) (6.9) (2.0) 28.3% EBITDA % Interest expense (221.2) (238.0) % Financial income 13, (0.1) -0.7% Funds From Operations % Tenant improvements (15.1) (6.8) (8.3) 123.5% Leasing commissions (17.5) (14.2) (3.3) 23.3% Normalized capital expenditure (15.3) (13.3) (2.0) 15.3% Adjusted Funds From Operations % 1. Average FX used - December 31, 2015: ; December 31, 2014: PAGE 42
44 Consolidated statement of financial position (in Ps. millions unless otherwise stated) As of December 31, 2015 Assets Ps. Current assets Cash and cash equivalents 2,223.3 Restricted cash 9.0 Trade receivables Value Added Tax receivable Other Assets 96.4 Total current assets 2,718.2 Non-current assets Restricted cash Other assets Equity-accounted investees Goodwill Investment properties 35,639.3 Total non-current assets 37,825.2 Total assets 40,543.4 Liabilities Ps. Current liabilities Trade and other payables Interest bearing liabilities Tenant Deposits 18.9 Total current liabilities 1,306.8 Non-current liabilities Tenant deposits Interest bearing liabilities 15,409.4 Total non-current liabilities 15,716.2 Total liabilities 17,023.0 Net assets 23,520.4 PAGE 43
45 Balance sheet by segment as of December 31, 2015 (in Ps. millions unless otherwise stated) FIBRA Industrial Retail Whollyowned Retail Joint Venture Total Ps. Ps. Ps. Ps. Ps. Cash and cash equivalents 1, ,242.2 Restricted cash Trade and other receivables, net Value added tax receivable Other assets Total current assets 1, ,763.9 Restricted cash Other assets Equity accounted investees Goodwill Investment properties , , , ,420.5 Total non-current assets , , , ,669.7 Total assets 1, , , , ,433.6 Trade and other payables Interest-bearing liabilities Tenant deposits Total current liabilities ,328.2 Tenant deposits Interest-bearing liabilities , , ,265.0 Total non-current liabilities , , ,585.0 Total liabilities , , ,913.2 Net assets 1, , , ,520.4 All figures are rounded to the nearest decimal point. Any arithmetic inconsistencies are due to rounding. PAGE 44
46 FIBRA Income Tax summary (in Ps. millions unless otherwise stated) Ps. Net profit per consolidated financial statements 3,908.5 (-) Non-cash IFRS adjustments (2,316.8) 2015 Funds from Operations 1,569.0 (-) Tax deductions (3,564.6) Tax depreciation (1,082.2) FX gain on monetary liabilities (interest-bearing liabilities) (2,168.7) Other deductions (313.7) Current year taxable loss (1,995.6) (-) Prior-year losses carried forward (1,775.5) Retained tax losses available (3,771.1) 1. FX: December 31, 2015: PAGE 45
FIBRA Macquarie México (BMV:FIBRAMQ) First Quarter 2016 Supplementary Information. 27 April 2016
 First Quarter 2016 Supplementary Information. 27 April 2016") FIBRA Macquarie México (BMV:FIBRAMQ) First Quarter 2016 Supplementary Information 27 April 2016 Important Information This document has been prepared by Macquarie México Real Estate Management, S.A. de
FIBRA Macquarie México (BMV:FIBRAMQ) First Quarter 2016 Supplementary Information 27 April 2016 Important Information This document has been prepared by Macquarie México Real Estate Management, S.A. de
FIBRA Macquarie México
 FIBRA Macquarie México (BMV:FIBRAMQ) Second Quarter 2016 Supplementary Information 27 July 2016 Important t Information This document has been prepared by Macquarie México Real Estate Management, S.A.
FIBRA Macquarie México (BMV:FIBRAMQ) Third Quarter 2016 Supplementary Information. 27 October 2016
 Third Quarter 2016 Supplementary Information. 27 October 2016") FIBRA Macquarie México (BMV:FIBRAMQ) Third Quarter 2016 Supplementary Information 27 October 2016 Important Information This document has been prepared by Macquarie México Real Estate Management, S.A.
FIBRA Macquarie México (BMV:FIBRAMQ) Third Quarter 2016 Supplementary Information 27 October 2016 Important Information This document has been prepared by Macquarie México Real Estate Management, S.A.
FIBRA Macquarie México (BMV:FIBRAMQ) First Quarter 2017 Supplementary Information. 27 April 2017
 First Quarter 2017 Supplementary Information. 27 April 2017") FIBRA Macquarie México (BMV:FIBRAMQ) First Quarter 2017 Supplementary Information 27 April 2017 Important Information This document has been prepared by Macquarie México Real Estate Management, S.A. de
FIBRA Macquarie México (BMV:FIBRAMQ) First Quarter 2017 Supplementary Information 27 April 2017 Important Information This document has been prepared by Macquarie México Real Estate Management, S.A. de
Macquarie Mexican REIT
 Macquarie Mexican REIT Fourth Quarter 2012 Results Presentation February 26, 2013 4Q12 Results Agenda 1. Overview Nick O Neil 2. Highlights & Portfolio Performance Jaime Lara 3. Financials Jaime Lara 2
Macquarie Mexican REIT First Quarter 2014 Supplementary Financial Information
 Macquarie Mexican REIT First Quarter 2014 Supplementary Financial Information Consolidated Income Statement Mar 31, 2013 Mar 31, 2014 Lease Rental Income 383.0 511.7 Tenant Recoveries 22.8 16.9 Other Income
Achieved record annual revenues of $110.0 million for 2018, representing an increase of 5.8%
 Clipper Realty Inc. Announces Fourth Quarter and Full-Year 2018 Results Reports Record Annual Revenues, Record Annual Income from Operations and Record Quarterly and Annual Adjusted Funds from Operations
FY18/12 Q2 PRESENTATION
 FY18/12 Q2 PRESENTATION RENESAS ELECTRONICS CORPORATION JULY 31, 2018 2018 Renesas Electronics Corporation. All rights reserved. FINANCIAL TARGETS AND STRATEGY Long-term Financial Targets *1 (Starting
H RESULTS 10 AUGUST 2018 TLG IMMOBILIEN AG H RESULTS
 TLG IMMOBILIEN AG H1 2018 RESULTS DISCLAIMER This presentation includes statements, estimates, opinions and projections with respect to anticipated future performance of TLG IMMOBILIEN ("Forward-Looking
Q RESULTS 15 MAY 2018 TLG IMMOBILIEN AG Q RESULTS
 TLG IMMOBILIEN AG Q 208 RESULTS DISCLAIMER This presentation includes statements, estimates, opinions and projections with respect to anticipated future performance of TLG IMMOBILIEN ("Forward-Looking
Front Yard Residential Corporation Reports Third Quarter 2018 Results
 Front Yard Residential Corporation Reports Third Quarter 2018 Results November 7, 2018 CHRISTIANSTED, U.S. Virgin Islands, Nov. 07, 2018 (GLOBE NEWSWIRE) -- Front Yard Residential Corporation ( Front Yard
CHOICE PROPERTIES REAL ESTATE INVESTMENT TRUST. Management s Discussion and Analysis of Financial Condition and Results of Operations
 CHOICE PROPERTIES REAL ESTATE INVESTMENT TRUST Management s Discussion and Analysis of Financial Condition and Results of Operations (in thousands of Canadian dollars except where otherwise indicated)
Senior Housing Properties Trust Announces Fourth Quarter and Year End 2017 Results
 Senior Housing Properties Trust NEWS RELEASE Senior Housing Properties Trust Announces Fourth Quarter and Year End 2017 Results 2/27/2018 NEWTON, Mass.--(BUSINESS WIRE)-- Senior Housing Properties Trust
ATRIUM Q RESULTS ANALYST AND INVESTOR CALL. 18 May 2016
 ATRIUM Q1 2016 RESULTS ANALYST AND INVESTOR CALL 18 May 2016 KEY EVENTS IN 2016 YTD OPERATIONAL PERFORMANCE Core Markets¹: NRI increased 1.2% to 36.3m; LFL NRI remained stable at 31.4m Russia continues
Extra Space Storage Inc. Reports 2017 Fourth Quarter and Year-End Results
 Extra Space Storage Inc. Reports 2017 Fourth Quarter and Year-End Results February 20, 2018 SALT LAKE CITY, Feb. 20, 2018 /PRNewswire/ -- Extra Space Storage Inc. (NYSE: EXR) (the "Company"), a leading
Front Yard Residential Corporation Announces Transformative Acquisition and Reports Second Quarter 2018 Results
 Front Yard Residential Corporation Announces Transformative Acquisition and Reports Second Quarter 2018 Results August 9, 2018 CHRISTIANSTED, U.S. Virgin Islands, Aug. 09, 2018 (GLOBE NEWSWIRE) -- Front
Definitions. CPI is a lease in which base rent is adjusted based on changes in a consumer price index.
 Annualized Rental Income is rental revenue under our leases on Operating Properties on a straight-line basis, which includes the effect of rent escalations and any tenant concessions, such as free rent,
Glendale, California - PS Business Parks, Inc. (AMEX: PSB), reported operating results for the fourth quarter and the year ending December 31, 2001.
, reported operating results for the fourth quarter and the year ending December 31, 2001.") News Release PS Business Parks, Inc. 701 Western Avenue P.O. Box 25050 Glendale, CA 91221-5050 www.psbusinessparks.com For Release: Immediately Date: January 30, 2002 Contact: Mr. Jack Corrigan (818) 244-8080,
News Release PS Business Parks, Inc. 701 Western Avenue P.O. Box 25050 Glendale, CA 91221-5050 www.psbusinessparks.com For Release: Immediately Date: January 30, 2002 Contact: Mr. Jack Corrigan (818) 244-8080,
FOURTH QUARTER RESULTS 2015
 FOURTH QUARTER RESULTS Q4 MANAGEMENT S DISCUSSION AND ANALYSIS AND CONSOLIDATED FINANCIAL STATEMENTS MANAGEMENT S DISCUSSION AND ANALYSIS DECEMBER 31, PART I BASIS OF PRESENTATION Financial data included
FOR IMMEDIATE RELEASE
 FOR IMMEDIATE RELEASE American Finance Trust Announces Second Quarter Operating Results New York, August 9, - American Finance Trust, Inc. (Nasdaq: AFIN) ( AFIN or the Company ), a real estate investment
This document does not constitute an offer to sell or an invitation or solicitation of an offer to subscribe for or purchase any securities, and
 This document has been prepared by Atrium (the Company ). This document is not to be reproduced nor distributed, in whole or in part, by any person other than the Company. The Company takes no responsibility
PRIMARIS RETAIL REIT Announces Third Quarter Results
 PRIMARIS RETAIL REIT Announces Third Quarter Results Toronto (Ontario) November 8, 2011 Primaris Retail REIT (TSX:PMZ.UN) is pleased to report positive operating results for the third quarter of 2011.
Presentation for REITs Symposium 2016
 Presentation for REITs Symposium 2016 4 June 2016 Important Notice This presentation shall be read in conjunction with OUE Commercial REIT s Financial Results announcement for 1Q 2016 dated 10 May 2016.
Institutional Presentation IIIQ FY 2018
 Institutional Presentation IIIQ FY 2018 www.irsa.com.ar IRSA: Leading Real Estate Company in Argentina Largest Real Estate Company in Argentina with opportunistic investments abroad 63.8% 86.34% HOTELS
Extra Space Storage Inc. Reports 2018 Fourth Quarter and Year-End Results
 Extra Space Storage Inc. Reports 2018 Fourth Quarter and Year-End Results February 20, 2019 SALT LAKE CITY, Feb. 20, 2019 /PRNewswire/ -- Extra Space Storage Inc. (NYSE: EXR) (the "Company"), a leading
Investor Presentation. First Quarter 2015
 Investor Presentation First Quarter 2015 1 CAUTIONARY STATEMENTS Today s session and our answers to questions contain statements that constitute forward-looking statements about expected future events
Clipper Realty Inc. Announces Third Quarter 2018 Results Reports Record Revenues, Income From Operations and Adjusted Funds From Operations
 Clipper Realty Inc. Announces Third Quarter 2018 Results Reports Record Revenues, Income From Operations and Adjusted Funds From Operations NEW YORK, November 1, 2018 /Business Wire/ -- Clipper Realty
FOR IMMEDIATE RELEASE
 FOR IMMEDIATE RELEASE GLOBAL NET LEASE ANNOUNCES OPERATING RESULTS FOR THIRD QUARTER 2018 New York, November 7, 2018 Global Net Lease, Inc. (NYSE: GNL) ( GNL or the Company ), a real estate investment
Rental income, SEK million 1,016 1,040 3,051 3,095 4,109 Growth in rental income comparable properties, percent
 Akelius Residential Property AB (publ) interim report January to September summary Jul Sep Jul Sep Jan Sep Jan Sep Jan Dec Rental income, SEK million 1,016 1,040 3,051 3,095 4,109 Growth in rental income
Institutional Presentation 3Q FY2017
 Institutional Presentation 3Q FY2017 IRSA Commercial Properties (IRCP) at a Glance The leading commercial real estate player in Argentina Largest owner and operator of premium malls and office buildings
SMARTCENTRES REAL ESTATE INVESTMENT TRUST RELEASES SECOND QUARTER RESULTS FOR 2018 AND ANNOUNCES DISTRIBUTION INCREASE
 SMARTCENTRES REAL ESTATE INVESTMENT TRUST RELEASES SECOND QUARTER RESULTS FOR 2018 AND ANNOUNCES DISTRIBUTION INCREASE TORONTO, ONTARIO - (August 9, 2018) SmartCentres Real Estate Investment Trust ("SmartCentres"
FOR IMMEDIATE RELEASE AUGUST 2, 2018 ARTIS REAL ESTATE INVESTMENT TRUST RELEASES SECOND QUARTER RESULTS
 FOR IMMEDIATE RELEASE AUGUST 2, 2018 ARTIS REAL ESTATE INVESTMENT TRUST RELEASES SECOND QUARTER RESULTS Today Artis Real Estate Investment Trust ( Artis or the "REIT") issued its financial results and
CONSOLIDATED FINANCIAL STATEMENTS
 CONSOLIDATED FINANCIAL STATEMENTS Dundee Real Estate Investment Trust Consolidated Balance Sheets (unaudited) June 30, December 31, (in thousands of dollars) Note 2004 2003 Assets Rental properties 3,4
STAG INDUSTRIAL ANNOUNCES SECOND QUARTER 2018 RESULTS
 STAG INDUSTRIAL ANNOUNCES SECOND QUARTER 2018 RESULTS Boston, MA July 31, 2018 - STAG Industrial, Inc. (the Company ) (NYSE:STAG), today announced its financial and operating results for the quarter ended
May 10, 2016 Halifax, Nova Scotia KILLAM APARTMENT REIT ANNOUNCES 20% INCREASE IN FFO PER UNIT IN Q1 2016
 May 10, 2016 Halifax, Nova Scotia KILLAM APARTMENT REIT ANNOUNCES 20% INCREASE IN FFO PER UNIT IN Q1 2016 Killam Apartment REIT (TSX: KMP.UN) ("Killam") is pleased to report its Q1 2016 results, including
First Financial Results 21 Oct to 31 Dec Released 25 January 2011
 First Financial Results 21 Oct to 31 Dec 2010 Released 25 January 2011 MAPLETREE INDUSTRIAL TRUST ( MIT( MIT ) 1 FIRST FINANCIAL RESULTS - KEY HIGHLIGHTS DPU of 1.52 cents for period 21 Oct to 31 Dec 2010
FOR IMMEDIATE RELEASE
 FOR IMMEDIATE RELEASE GLOBAL NET LEASE ANNOUNCES OPERATING RESULTS FOR SECOND QUARTER 2018 New York, August 8, 2018 Global Net Lease, Inc. (NYSE: GNL) ( GNL or the Company ), a real estate investment trust
Institutional Presentation 2Q FY2017
 Institutional Presentation 2Q FY2017 IRSA Commercial Properties (IRCP) at a Glance The leading commercial real estate player in Argentina Largest owner and operator of premium malls and office buildings
Rental income, SEK million 1,071 1,014 4,122 4,109 Growth in rental income comparable properties, percent
 Akelius Residential Property AB (publ) year-end report January to December summary Oct Dec Oct Dec Jan Dec Jan Dec Rental income, SEK million 1,071 1,014 4,122 4,109 Growth in rental income comparable
NON-GAAP FINANCIAL MEASURES
 NON-GAAP FINANCIAL MEASURES Welltower Inc. (HCN) believes that revenues, net operating income from continuing operations (NOICO), net income and net income attributable to common stockholders (NICS), as
FIRST INDUSTRIAL REALTY TRUST REPORTS FIRST QUARTER 2018 RESULTS
 First Industrial Realty Trust, Inc. 311 South Wacker Drive Suite 3900 Chicago, IL 60606 312/344-4300 FAX: 312/922-9851 MEDIA RELEASE FIRST INDUSTRIAL REALTY TRUST REPORTS FIRST QUARTER 2018 RESULTS Occupancy
Retail Acquisition Example
 Property Information Retail Acquisition Example Project Assumptions Acquisition Assumptions Property Name Retail Acquisition Example Project Type Acquisition Location Austin, TX Acquisition Cost $1,800,000
FOR IMMEDIATE RELEASE CONTACT: John Bucksbaum 312/ General Growth Properties, Inc. Reports Operating Results for the Third Quarter 2005
 News Release General Growth Properties, Inc. 110 North Wacker Drive Chicago, IL 60606 (312) 960-5000 FAX (312) 960-5475 FOR IMMEDIATE RELEASE CONTACT: John Bucksbaum 312/960-5005 Bernie Freibaum 312/960-5252
Industrial Income Trust Inc.
 UNITED STATES SECURITIES AND EXCHANGE COMMISSION Washington, D.C. 20549 FORM 8-K CURRENT REPORT Pursuant to Section 13 or 15(d) of The Securities Exchange Act of 1934 Date of Report (Date of earliest event
Investor Presentation Second Quarter 2006
 Investor Presentation Second Quarter 2006 2006 Highlights (Six months to June 30, 2006) Revenues up 10.2% from accretive acquisitions Net Operating Income up 10.9% NOI margin increases Stabilized portfolio
DREAM GLOBAL ANNOUNCES FOURTH QUARTER RESULTS, 24% ANNUAL NET ASSET VALUE GROWTH AND OVER 6% FOURTH QUARTER COMPARATIVE NOI GROWTH
 DREAM GLOBAL ANNOUNCES FOURTH QUARTER RESULTS, 24% ANNUAL NET ASSET VALUE GROWTH AND OVER 6% FOURTH QUARTER COMPARATIVE NOI GROWTH TORONTO, FEBRUARY 20, 2019 DREAM GLOBAL REIT (TSX:DRG.UN, FRA:DRG) (or
Real Estate & REIT Modeling: Quiz Questions Module 1 Accounting, Overview & Key Metrics
 Real Estate & REIT Modeling: Quiz Questions Module 1 Accounting, Overview & Key Metrics 1. How are REITs different from normal companies? a. Unlike normal companies, REITs are not required to pay income
Q EPRA KEY METRICS
 Q1 EPRA KEY METRICS EPRA KEY METRICS The European Public Real Estate Association (EPRA) is a not-for-profit association based in Brussels that represents the interests of both listed real estate companies
Public Storage Reports Results for the Quarter Ended March 31, 2017
 News Release Public Storage 701 Western Avenue Glendale, CA 91201-2349 www.publicstorage.com For Release Immediately Date April 26, 2017 Contact Clemente Teng (818) 244-8080, Ext. 1141 Public Storage Reports
SUNTEC REIT FINANCIAL RESULTS. For the 2 nd Quarter and Half Year ended 30 June 2017
 SUNTEC REIT FINANCIAL RESULTS For the 2 nd Quarter and Half Year ended 30 June 2017 26 July 2017 Agenda 03 2Q 17 Highlights 05 Financial Highlights 18 Office Portfolio Performance 25 Retail Portfolio Performance
MARGARITAVILLE RESORT CASINO TRANSACTION OVERVIEW JUNE 19, 2018
 MARGARITAVILLE RESORT CASINO TRANSACTION OVERVIEW JUNE 19, 2018 DISCLAIMERS Forward-Looking Statements This presentation contains forward-looking statements within the meaning of the federal securities
EDGEFRONT REALTY CORP. MANAGEMENT S DISCUSSION AND ANALYSIS For the three-month period ended March 31, 2013
 EDGEFRONT REALTY CORP. MANAGEMENT S DISCUSSION AND ANALYSIS For the three-month period ended March 31, 2013 May 30, 2013 MANAGEMENT S DISCUSSION AND ANALYSIS The following management s discussion and analysis
Sirius Real Estate Ltd Half Year Presentation 2013
 Sirius Real Estate Ltd Half Year Presentation 2013 Who are we We are a leading provider of branded mixed-use flexible workspace in Germany 2 Financial Highlights Substantial increase in recurring profit
UNITED STATES SECURITIES AND EXCHANGE COMMISSION Washington, DC FORM 8-K/A
 UNITED STATES SECURITIES AND EXCHANGE COMMISSION Washington, DC 20549 FORM 8-K/A CURRENT REPORT Pursuant to Section 13 or 15(d) of The Securities Exchange Act of 1934 Date of Report (Date of earliest event
Carter Validus Mission Critical REIT, Inc. Reports Second Quarter 2016 Results
 Carter Validus Mission Critical REIT, Inc. Reports Second Quarter 2016 Results TAMPA, FL (September 1, 2016) - Carter Validus Mission Critical REIT, Inc. (the Company ) announced today its operating results
PS Business Parks, Inc. Reports Results for the Quarter Ended March 31, 2017
 News Release PS Business Parks, Inc. 701 Western Avenue Glendale, CA 91201-2349 psbusinessparks.com For Release: Immediately Date: April 25, 2017 Contact: Edward A. Stokx (818) 244-8080, Ext. 1649 PS Business
Select Income REIT Announces Third Quarter 2017 Results
 FOR IMMEDIATE RELEASE Contact: Christopher Ranjitkar, Director, Investor Relations (617) 796-8320 Select Income REIT Announces Third Quarter 2017 Results Third Quarter Net Income of $0.35 Per Share Third
2014 Operating and Financial Highlights
 FINANCIAL HIGHLIGHTS > 2014 Operating and Financial Highlights Operating Results Executed 203 leasing transactions representing approximately 2.8 million square feet, the highest gross leasing volume in
Timbercreek. U.S. Multi-Residential Opportunity Fund #1. Semi-Annual Investor Update
 Timbercreek U.S. Multi-Residential Opportunity Fund #1 Semi-Annual Investor Update FORWARD LOOKING STATEMENT Certain statements in this presentation about Timbercreek U.S. Multi-Residential Opportunity
UNITED STATES SECURITIES AND EXCHANGE COMMISSION FORM 8-K GOVERNMENT PROPERTIES INCOME TRUST
 UNITED STATES SECURITIES AND EXCHANGE COMMISSION WASHINGTON, D.C. 20549 FORM 8-K CURRENT REPORT PURSUANT TO SECTION 13 OR 15(d) OF THE SECURITIES EXCHANGE ACT OF 1934 Date of Report (Date of earliest event
Extra Space Storage Inc. Reports 2017 Third Quarter Results
 Extra Space Storage Inc. Reports 2017 Third Quarter Results November 1, 2017 SALT LAKE CITY, Nov. 1, 2017 /PRNewswire/ -- Extra Space Storage Inc. (NYSE: EXR) (the "Company"), a leading owner and operator
WP Glimcher Reports Second Quarter 2016 Results
 NEWS RELEASE WP Glimcher Reports Second Quarter 2016 Results COLUMBUS, OH August 3, 2016 WP Glimcher Inc. (NYSE: WPG) today reported financial and operating results for the second quarter ended June 30,
26 February 2013 FIRST HALF RESULTS PRESENTATION
 26 February 2013 FIRST HALF RESULTS PRESENTATION Investment highlights Proven track record of consistent earnings growth and meeting targets Strategically located and diverse residential portfolio Urban
Highwoods Reports Third Quarter 2017 Results
 FOR IMMEDIATE RELEASE Ref: 17-20 Contact: Brendan Maiorana Senior Vice President, Finance and Investor Relations 919-431-1529 Highwoods Reports Third Quarter 2017 Results $0.55 Net Income per Share $0.86
AUDIOCAST PRESENTATION Q1/2018
 19.4.2018 AUDIOCAST PRESENTATION Q1/2018 HIGHLIGHTS Q1/2018 EPRA EARNINGS PER SHARE EUR 0.041 -Divestments in 2017 and weaker currencies impacted EPRA EPS -Efficient cost management with administrative
Rental income, EUR million Like-for-like growth in rental income, percent
 Akelius Residential Property AB (publ) interim report January to June summary Apr Jun Apr Jun Jan Jun Jan Jun Jan Dec Rental income, EUR million 115 113 233 229 469 Like-for-like growth in rental income,
Board of Directors' Report on the Corporation's State of Affairs
 Board of Directors' Report on the Corporation's State of Affairs Brack Capital Properties NV (hereinafter: "the Company") hereby submits the Board of Directors' report for a period of six months ending
National Real Estate Company. Earnings Presentation Q1 FY2014
 National Real Estate Company (Kuwait KSE: NRE) Earnings Presentation Q1 FY2014 May 28, 2014 1 Agenda 1. NREC Overview 3 2. Q1 FY2014 Summary 4 3. Financial Performance 5 4. Key Financial Ratios 7 5. Quarterly
Investor Presentation December 2017
 Investor Presentation December 2017 Cautionary Statement This presentation includes statements concerning our expectations, beliefs, plans, objectives, goals, strategies, future events or performance and
Select Income REIT Announces Second Quarter Results
 July 28, 2014 Announces Second Quarter Results Generates Normalized FFO of $0.72 Per Share Increases Rental Rates for New and Renewal Leases by 21% and Hawaii Rent Resets by 30.9% Increases Occupancy to
Senior Housing Properties Trust Announces Fourth Quarter and Year End 2018 Results
 Senior Housing Properties Trust NEWS RELEASE Senior Housing Properties Trust Announces Fourth Quarter and Year End 2018 Results 3/1/2019 Fourth Quarter Net Loss Attributable to Common Shareholders of $0.50
M A R C H 22,
 MARCH 22, 2017 1 01 2 ADO THE PURE-PLAY BERLIN RESIDENTIAL SPECIALIST Investment highlights 1 2 3 4 Berlin residential pure play with a 2.3bn quality portfolio Efficient, fully integrated and scalable
4Q & FY16/17 Financial Results
 4Q & FY16/17 Financial Results 24 April 2017 Important Notice This presentation shall be read in conjunction with Mapletree Industrial Trust s ( MIT ) financial results for Fourth Quarter Financial Year
Rental income, EUR million Like-for-like growth in rental income, percent
 Akelius Residential Property AB (publ) interim report January to September summary Jul Sep Jul Sep Jan Sep Jan Sep Jan Dec Rental income, EUR million 120 116 353 345 469 Like-for-like growth in rental
SECURITIES AND EXCHANGE COMMISSION. Washington, D.C FORM 8-K CURRENT REPORT
 SECURITIES AND EXCHANGE COMMISSION Washington, D.C. 20549 FORM 8-K CURRENT REPORT PURSUANT TO SECTION 13 OR 15(d) OF THE SECURITIES EXCHANGE ACT OF 1934 Date of Report (Date of earliest event reported):
MARCH 2019 CITI 2019 GLOBAL PROPERTY CEO CONFERENCE
 MARCH 2019 CITI 2019 GLOBAL PROPERTY CEO CONFERENCE SAFE HARBOR This presentation contains forward-looking statements within the meaning of Section 27A of the Securities Act of 1933, and Section 21E of
Frasers Commercial Trust 3 rd Annual General Meeting. 17 January 2012
 Frasers Commercial Trust 3 rd Annual General Meeting 17 January 2012 Important notice Certain statements in this Presentation constitute forward-looking statements, including forward-looking financial
Rental income, EUR million** Like-for-like growth in rental income, percent Net operating income, EUR million
 Akelius Residential Property AB (publ) interim report January to March summary* Jan Mar Jan Mar Jan Dec Rental income, EUR million** 119 116 469 Like-for-like growth in rental income, percent 3.7 5.4 5.1
MANAGING HIGH VALUE ADDED PROCESSES GLOBALLY. MID TERM FINANCIAL REPORT SEPTEMBER 30 th 2017
 1 MANAGING HIGH VALUE ADDED PROCESSES GLOBALLY MID TERM FINANCIAL REPORT SEPTEMBER 30 th 2017 DISCLAIMER 2 This document has been prepared by CIE Automotive, S.A. ("CIE Automotive"), and is for information
NBG PANGAEA REIC April 2017
 NBG PANGAEA REIC April 2017 Disclaimer This presentation has been prepared by NBG PANGAEA Real Estate Investment Company (former MIG Real Estate REIC or the Company) solely for information purposes and
Dream Global REIT 2018 Fourth Quarter 1
 EPRA Metrics The annual EPRA BPR Awards aim to recognize and commend upon the efforts of property companies that have successfully adopted the EPRA BPR Guidelines. Based on the assessment performed by
SITE CENTERS NOVEMBER 2018
 SITE CENTERS NOVEMBER 2018 JOINT VENTURE WITH CHINESE INSTITUTIONAL INVESTORS $607MM JOINT VENTURE ALLOWS SITE CENTERS TO ACCELERATE OPPORTUNISTIC INVESTING AND FURTHER IMPROVE THE BALANCE SHEET Dividend
ALE Property Group. 31 December 2017 Half Year Results. The Breakfast Creek Hotel, Brisbane, QLD
 ALE Property Group 31 December 2017 Half Year Results The Breakfast Creek Hotel, Brisbane, QLD 1 Contents Highlights December 17 Half Year Results Pub Property Portfolio Capital Management FY18 Outlook
Sekisui House, Ltd. Second Quarter of FY2017 (February 1, 2017 through July 31, 2017) Summary of Consolidated Financial Results. Management Direction
 Summary of Consolidated Financial Results. Management Direction") Sekisui House, Ltd. Second Quarter of (February 1, 2017 through July 31, 2017) Summary of Consolidated Financial 1. Overview 2. Financial Position 3. Segment Information Built to Order Supplied Housing
Sekisui House, Ltd. Second Quarter of (February 1, 2017 through July 31, 2017) Summary of Consolidated Financial 1. Overview 2. Financial Position 3. Segment Information Built to Order Supplied Housing
FY 2015 Results TLG IMMOBILIEN AG March FY 2015 Results Presentation
 FY 2015 Results TLG IMMOBILIEN AG March 2016 DISCLAIMER This presentation includes statements, estimates, opinions and projections with respect to anticipated future performance of TLG IMMOBILIEN ("Forward-Looking
Institutional presentation
 Institutional presentation FY 2018 1 IRCP at a glance Business description Largest owner and operator of premium shopping malls and one of the largest owners of office buildings in Argentina ~427,000 gross
Institutional presentation
 Institutional presentation IQ FY 2019 1 IRCP at a glance Business description Largest owner and operator of premium shopping malls and one of the largest owners of office buildings in Argentina ~429,000
EN Official Journal of the European Union L 320/373
 29.11.2008 EN Official Journal of the European Union L 320/373 INTERNATIONAL FINANCIAL REPORTING STANDARD 3 Business combinations OBJECTIVE 1 The objective of this IFRS is to specify the financial reporting
INVESTOR PRESENTATION MAY 2013
 INVESTOR PRESENTATION MAY 2013 Forward-Looking Statements This presentation includes forward-looking statements. These statements are subject to a number of risks, uncertainties and other factors that
Ying Li International Real Estate Limited 1Q2015 Financial Results 15 May 2015
 New Beijing Centre. Tongzhou Beijing Artist s Impression Ying Li International Real Estate Limited 1Q2015 Financial Results 15 May 2015 Ying Li International Financial Centre, Chonqging Disclaimer This
COMINAR ANNOUNCES 2018 SECOND QUARTER RESULTS AND HIGHLIGHTS
 PRESS RELEASE For Immediate Release COMINAR ANNOUNCES 2018 SECOND QUARTER RESULTS AND HIGHLIGHTS Québec City, Quebec, August 9, 2018 Cominar Real Estate Investment Trust ( Cominar or the REIT ) (TSX: CUF.UN)
General Growth Properties, Inc.
 General Growth Properties, Inc. Supplemental Financial Information For the Three and Nine Months Ended September 30, 2009 This presentation contains forward-looking statements. Actual results may differ
NAREIT Presentation June George Ellison, CEO Robin Lowe, CFO. welcome. home Front Yard Residential. All rights reserved.
 NAREIT Presentation June 2018 George Ellison, CEO Robin Lowe, CFO welcome home. 2018 Front Yard Residential. All rights reserved. 1 Forward-looking Statements This presentation contains forward-looking
CREATING A FUTURE WORTH LIVING. FOR PATIENTS. WORLDWIDE. EVERY DAY. Third quarter Conference call October 29, 2015
 CREATING A FUTURE WORTH LIVING. FOR PATIENTS. WORLDWIDE. EVERY DAY. Third quarter 2015 Conference call October 29, 2015 Our motivation in numbers 9m 2015 Every 0.8 seconds we provide a dialysis treatment
Strategic Storage Growth Trust, Inc. Reports 2018 Third Quarter Results
 FOR IMMEDIATE RELEASE Contacts Julie Leber Damon Elder Spotlight Marketing Communications Spotlight Marketing Communications 949.427.1391 949.427.1377 julie@spotlightmarcom.com damon@spotlightmarcom.com
ALE Property Group. Annual General Meeting 13 November Breakfast Creek Hotel, Brisbane, QLD 1
 ALE Property Group Annual General Meeting 13 November 2018 Breakfast Creek Hotel, Brisbane, QLD 1 Contents Highlights FY18 Results Properties and Development Updates Capital Management FY19 Outlook Attractive
Great Elm Capital Group, Inc. An Introduction to the Fort Myers Transaction & GEC s Real Estate Strategy
 Great Elm Capital Group, Inc. An Introduction to the Fort Myers Transaction & GEC s Real Estate Strategy March 6, 2018 2018 Great Elm Capital Group, Inc. Disclaimer Statements in this presentation that
SMART REAL ESTATE INVESTMENT TRUST RELEASES SECOND QUARTER RESULTS FOR 2017 AND ANNOUNCES DISTRIBUTION INCREASE
 SMART REAL ESTATE INVESTMENT TRUST RELEASES SECOND QUARTER RESULTS FOR 2017 AND ANNOUNCES DISTRIBUTION INCREASE TORONTO, ONTARIO - (August 9, 2017) Smart Real Estate Investment Trust ("SmartREIT" or "the
FINANCIAL YEAR 2012 RESULTS
 FINANCIAL YEAR 2012 RESULTS 31 January 2013 Contents Financial Highlights FY 2012 Portfolio Update KLCA & Cyberjaya Office Market Outlook Klang Valley & Penang Retail Market Outlook Conclusion 2 Important
Housing New Zealand Investor Update
 Housing New Zealand Investor Update May 2018 Matthew Needham CFO Matthew.needham@hnzc.co.nz Sam Direen Treasury Manager Sam.direen@hnzc.co.nz Disclaimer This presentation has been prepared by Housing New