2 July 2018 FNB HOUSE PRICE INDEX RESULTS FOR JUNE 2018 ACCELERATION, BUT FOR HOW LONG?
|
|
|
- Helena Tate
- 5 years ago
- Views:
Transcription


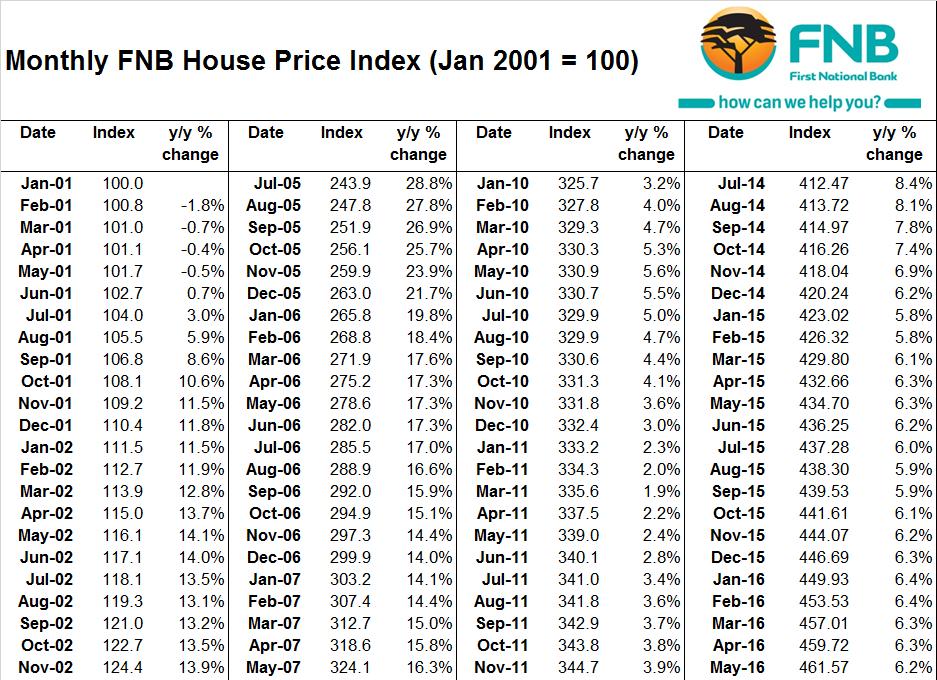
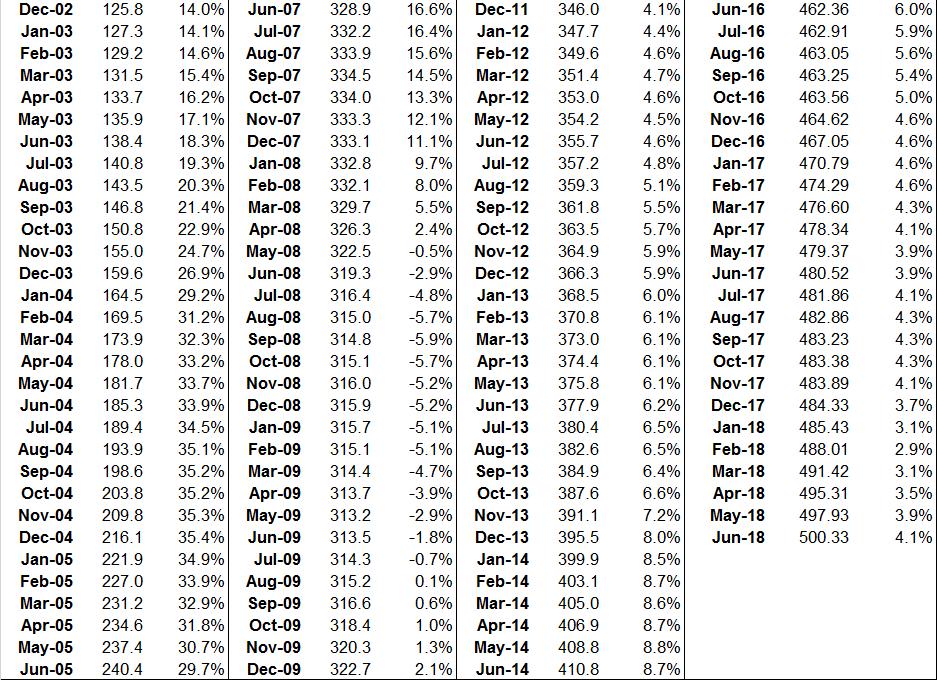
1 2 July 2018 MARKET ANALYTICS AND SCENARIO FORECASTING UNIT JOHN LOOS: HOUSEHOLD AND PROPERTY SECTOR STRATEGIST THULANI LUVUNO: ANALYST ZHARINA FRANCIS: STATISTICIAN PROPERTY BAROMETER FNB House Price Index Year-on-year house price growth accelerated in June, but in real terms (adjusting for CPI), house prices are still in decline June 2018 saw the FNB House Price Index growing by a faster 4.1%, year-onyear, up from the previous month s 3.9%, and from a February 2018 low of 2.9%. This is the 4 th consecutive month of house price growth acceleration. However, signals from the FNB Estate Agent Survey suggest that the acceleration in year-on-year house price growth may be short-lived FNB HOUSE PRICE INDEX RESULTS FOR JUNE 2018 ACCELERATION, BUT FOR HOW LONG? On a year-on-year basis, the FNB House Price Index s growth rate continued to accelerate mildly in June 2018, reaching 4.1%, up from a revised 3.9% in May, and the 4 th consecutive month of growth acceleration since the 2.9% low point reached in February. We believe this recent mild acceleration in house price growth to be the lagged impact of that brief sentiment improvement in the country early in 2018 on the back of the major political leadership changes in the country, notably a change in President. That sentiment improvement led to a noticeable 1 st quarter increase in residential market activity and demand according to the FNB Estate Agent Survey, and this has arguably fed through into price growth of late. In real terms, however, when adjusting for CPI (Consumer Price Index) inflation, house prices remain in decline. As at May 2018 (June CPI not yet available) real house prices declined year-on-year by -0.5%, with CPI inflation at 4.4% in that month and house price growth at 3.9%. The information in this publication is derived from sources which are regarded as accurate and reliable, is of a general nature only, does not constitute advice and may not be applicable to all circumstances. Detailed advice should be obtained in individual cases. No responsibility for any error, omission or loss sustained by any person acting or refraining from acting as a result of this publication is accepted by Firstrand Group Limited and / or the authors of the material. First National Bank a division of FirstRand Bank Limited. An Authorised Financial Services provider. Reg No. 1929/001225/06


2 LONGER RUN REAL HOUSE PRICE PERFORMANCE Examining the longer run performance of the FNB Repeat Sales House Price Index in real terms, we still see it at relatively expensive levels, 90.8% up on the January 2001 preboom index level. This is despite significant cumulative correction of -20.1% since the alltime real high reached in August 2007 at the back end of the pre-2008 Housing Bubble. More recently, following the mild post-2008/9 recession recovery, real house prices have declined cumulatively by -2.6% since a 9-year high reached in February OUTLOOK Looking ahead to the near term, it has become apparent that the politically-driven 1 st quarter 2018 domestic sentiment spike was short-lived, and that by the 2 nd quarter of this year sentiment was largely back in the doldrums. SA Households continued to experience a stagnant economy, and costs of living continue to rise on the back of petrol price increases and tax hikes. 2 nd quarter 2018 housing market weakening was witnessed in our own FNB Estate Agent Survey, with agents reporting a significant drop in residential market activity in the May 2018 quarterly survey, after the 1 st quarter spike. In the survey, we ask respondents to provide a rating of market activity in their areas, a subjective rating on a scale of 1 to 10. The 1 st quarter 2018 FNB Activity Rating jumped noticeably from 5.29 in the previous quarter to Even on a seasonally adjusted basis, the jump was the most noticeable in over 3 years, from 5.4 in the prior quarter to But this was quickly reversed in the 2 nd quarter, the Activity Rating falling back sharply to 5.28 (5.37 on a seasonally adjusted basis) Further support for the perception of a weakened Housing Market in the 2 nd quarter of 2018 was provided by a renewed lengthening in the estimated average time of homes on the market prior to sale, from 14 weeks and 1 day in the prior quarter to 16 weeks and 4 days in the 2 nd quarter, according to the Estate Agent Survey.
3 Our main FNB Estate Agent Survey indicators for the 2 nd quarter are thus pointing to the 1 st quarter sentiment spike being short-lived, with market weakening once more in the 2 nd quarter. This suggests to us that the recent mild house price growth acceleration will be shortlived. A 1 st quarter GDP (Gross Domestic Product) contraction suggested little support for the housing market from the economy in 2018 either. Half way through the year, average house price growth for 2018 sits at a lowly 3.4%, slower than the 4.2% average growth for Therefore, the signs are increasingly pointing to an even slower average house price growth year in 2018, than in 2017, and possibly the 4 th consecutive year of house price growth slow down, despite a recent mild growth acceleration. Whereas we had expected a little more early in 2018, originally projecting an average 5-6% house price growth rate for the year, the short-lived nature of that early-2018 national sentiment spike leads us to adjust our average house price expectation for 2018 lower into the 3-4% range.
4
5 ADDENDUM - NOTES: Note on The FNB House Price Index: The FNB Repeat Sales House Price Index has been one of our repertoire of national house price indices for some years, and is based on the well-known Case-Shiller methodology which is used to compile the Standard & Poor s Case-Shiller Home Price Indices in the United States. This repeat sales approach is based on measuring the rate of change in the prices of individual houses between 2 points in time, based on when the individual homes are transacted. This means that each house price in any month s sample is compared with its own previous transaction value. The various price inflation rates of individual homes are then utilized to compile the average price inflation rate of the index over time. The index is compiled from FNB s own valuations database, thus based on the residential properties financed by FNB over the past 18 years. We apply certain filters and cut-offs to eliminate outliers in the data. They main ones are as follows: The maximum price cut-off is R15m, and the lower price cut-off is R20,000. The top 5% of repeat sales price growth rates, and the bottom 5% of growth rates are excluded from the data set. Repeat transactions that took place longer than 10 years after the previous transaction on the same home are excluded, as are repeat transactions that took place less than 6 months after the previous transaction on the same home. The index is very lightly smoothed using a Hodrick-Prescott smoothing function with a Lambda of 5.
PROPERTY BAROMETER FNB House Price Index Early signs of the positive national sentiment shift impacting on national house price trends
 5 June 2018 MARKET ANALYTICS AND SCENARIO FORECASTING UNIT JOHN LOOS: HOUSEHOLD AND PROPERTY SECTOR STRATEGIST 087-328 0151 john.loos@fnb.co.za THULANI LUVUNO: ANALYST 087-730 2254 thulani.luvuno@fnb.co.za
PROPERTY BAROMETER FNB House Price Index Year-on-year house price growth appears to be approaching a mini-peak, at 4.
 2 October 2017 MARKET ANALYTICS AND SCENARIO FORECASTING UNIT JOHN LOOS: HOUSEHOLD AND PROPERTY SECTOR STRATEGIST 087-328 0151 john.loos@fnb.co.za LIZE ERASMUS: STATISTICIAN 087-335 6664 lize.erasmus@fnb.co.za
1 February FNB House Price Index - Real and Nominal Growth
 1 February 2017 MARKET ANALYTICS AND SCENARIO FORECASTING UNIT JOHN LOOS: HOUSEHOLD AND PROPERTY SECTOR STRATEGIST 087-328 0151 john.loos@fnb.co.za THEO SWANEPOEL: PROPERTY MARKET ANALYST 087-328 0157
1 June FNB House Price Index - Real and Nominal Growth MAY FNB HOUSE PRICE INDEX FINDINGS
 1 June 2016 MARKET ANALYTICS AND SCENARIO FORECASTING UNIT JOHN LOOS: HOUSEHOLD AND PROPERTY SECTOR STRATEGIST 087-328 0151 john.loos@fnb.co.za THEO SWANEPOEL: PROPERTY MARKET ANALYST 087-328 0157 tswanepoel@fnb.co.za
6 April 2018 KEY POINTS
 6 April 2018 MARKET ANALYTICS AND SCENARIO FORECASTING UNIT JOHN LOOS: HOUSEHOLD AND PROPERTY SECTOR STRATEGIST 087-328 0151 john.loos@fnb.co.za THULANI LUVUNO: STATISTICIAN 087-730 2254 thulani.luvuno@fnb.co.za
16 April 2018 KEY POINTS
 16 April 2018 MARKET ANALYTICS AND SCENARIO FORECASTING UNIT JOHN LOOS: HOUSEHOLD AND PROPERTY SECTOR STRATEGIST FNB HOME LOANS 087-328 0151 john.loos@fnb.co.za THULANI LUVUNO: STATISTICIAN 087-730 2254
PROPERTY BAROMETER FNB Mining Towns House Price Indices
 PROPERTY BAROMETER FNB Mining Towns House Price Indices A return to positive growth in Mining production from the latter stages of 2016 and into 2017 appears to be providing some improved support to Mining
14 September 2015 MARKET ANALYTICS AND SCENARIO FORECASTING UNIT. JOHN LOOS: HOUSEHOLD AND PROPERTY SECTOR STRATEGIST
 14 September 2015 MARKET ANALYTICS AND SCENARIO FORECASTING UNIT JOHN LOOS: HOUSEHOLD AND PROPERTY SECTOR STRATEGIST 087-328 0151 john.loos@fnb.co.za THEO SWANEPOEL: PROPERTY MARKET ANALYST 087-328 0157
PROPERTY BAROMETER FNB Area Value Band House Price Indices
 PROPERTY BAROMETER FNB Area Value Band House Price Indices The Luxury Area Value Band has seen the most noticeable price growth slowdown since 2014, while the Lower End has done a little better of late.
PROPERTY BAROMETER Residential Property Affordability Review The recently improving Housing Affordability trend stalled in the 1 st quarter of 2017
 21 June 2017 MARKET ANALYTICS AND SCENARIO FORECASTING UNIT JOHN LOOS: HOUSEHOLD AND PROPERTY SECTOR STRATEGIST FNB HOME LOANS 087-328 0151 john.loos@fnb.co.za LIZE ERASMUS: STATISTICIAN 087-335 6664 lize.erasmus@@fnb.co.za
3 November rd QUARTER FNB SEGMENT HOUSE PRICE REVIEW. Affordability of housing
 3 November 2011 3 rd QUARTER FNB SEGMENT HOUSE PRICE REVIEW JOHN LOOS: HOUSEHOLD AND PROPERTY SECTOR STRATEGIST 011-6490125 John.loos@fnb.co.za EWALD KELLERMAN: PROPERTY MARKET ANALYST 011-6320021 ekellerman@fnb.co.za
3 October 2017 KEY POINTS
 3 October 2017 FNB HOME LOANS: MARKET ANALYTICS AND SCENARIO FORECASTING UNIT JOHN LOOS: HOUSEHOLD AND PROPERTY SECTOR STRATEGIST 087-328 0151 John.loos@fnb.co.za THEO SWANEPOEL: PROPERTY MARKET ANALYST
FNB-TPN RESIDENTIAL YIELDS REVIEW
 FNB-TPN RESIDENTIAL YIELDS REVIEW 17 November 2015 John Loos, Household and Property Sector Strategist Tel: (087) 328 0151 Cell:083-453 8096 E-mail: john.loos@fnb.co.za Website: http://blog.fnb.co.za/category/economics/
REAL ESTATE SENTIMENT INDEX 2 nd Quarter 2018
 About Real Estate Sentiment Index (RESI) The Real Estate Sentiment Index (RESI) is jointly developed by the Real Estate Developers Association of Singapore (REDAS) and the Department of Real Estate (DRE),
Nothing Draws a Crowd Like a Crowd: The Outlook for Home Sales
 APRIL 2018 Nothing Draws a Crowd Like a Crowd: The Outlook for Home Sales The U.S. economy posted strong growth with fourth quarter 2017 Real Gross Domestic Product (real GDP) growth revised upwards to
Residential building statistics 15 February 2018
 Compiled by Jacques du Toit Property Analyst Absa Home Loans 15 Troye Street Johannesburg 21 PO Box 7735 Johannesburg 2 South Africa Tel +27 ()11 35 7246 jacques@absa.co.za www.absa.co.za Explanatory note:
Cycle Monitor Real Estate Market Cycles Third Quarter 2017 Analysis
 Cycle Monitor Real Estate Market Cycles Third Quarter 2017 Analysis Real Estate Physical Market Cycle Analysis of Five Property Types in 54 Metropolitan Statistical Areas (MSAs). Income-producing real
Housing and Economy Market Trends
 Housing and Economy Market Trends Mainstreet Organization Prices of single-family, detached homes in suburban Chicago increased 12.1 percent in May 2014 compared with the same period a year ago. Overall,
Smoothed Weighted National Housing Index (base = January 2008)
") HOUSING INDEX May 2013 Decelerating Real House Prices 1 1 1 120 Smoothed Weighted National Housing Index (base = January 8) 1.2 107.0 Value Index Volume Index The FNB House Price Index regained some lost
HOUSING INDEX May 2013 Decelerating Real House Prices 1 1 1 120 Smoothed Weighted National Housing Index (base = January 8) 1.2 107.0 Value Index Volume Index The FNB House Price Index regained some lost
Smoothed Weighted National Housing Index (base = January 2008)
") HOUSING INDEX April 2013 Moderating House Prices 1 1 1 120 Smoothed Weighted National Housing Index (base = January 8) 174.2 119.9 Value Index Volume Index The FNB House Price Index regained some lost
HOUSING INDEX April 2013 Moderating House Prices 1 1 1 120 Smoothed Weighted National Housing Index (base = January 8) 174.2 119.9 Value Index Volume Index The FNB House Price Index regained some lost
San Francisco Housing Market Update
 San Francisco Housing Market Update California Economic and Housing Market Outlook The national economy maintained a healthy growth rate in the first quarter of 2005 and appeared to be settling in for
Residential building statistics 17 May 2018
 Compiled by Jacques du Toit Property Analyst Absa Home Loans 15 Troye Street Johannesburg 21 PO Box 7735 Johannesburg 2 South Africa Tel +27 ()11 35 7246 jacques@absa.co.za www.absa.co.za Explanatory note:
Domain House Price Report March Quarter 2016
 Domain House Price Report March Quarter 2016 Dr Andrew Wilson Chief Economist for Domain Key findings Sydney median house price drops below $1 million House and unit prices are down in Sydney, Brisbane,
THE REAL ESTATE BOARD OF NEW YORK REAL ESTATE BROKER CONFIDENCE INDEX THIRD QUARTER 2016
 THE REAL ESTATE BOARD OF NEW YORK REAL ESTATE BROKER CONFIDENCE INDEX THIRD QUARTER 2016 EXECUTIVE SUMMARY REAL ESTATE BROKER CONFIDENCE INDEX THIRD QUARTER 2016 The Real Estate Board of New York s (REBNY)
Rapid recovery from the Great Recession, buoyed
 Game of Homes The Supply-Demand Struggle Laila Assanie, Sarah Greer, and Luis B. Torres October 4, 2016 Publication 2143 Rapid recovery from the Great Recession, buoyed by the shale oil boom, has fueled
Cycle Forecast Real Estate Market Cycles First Quarter 2019 Estimates
 Black Creek Research Cycle Forecast Real Estate Market Cycles First Quarter 0 Estimates Gross Domestic Product (GDP) is expected to grow.% in 0 due to new tax legislation and.% in 0. Employment growth
Economic Highlights. Payroll Employment Growth by State 1. Durable Goods 2. The Conference Board Consumer Confidence Index 3
 August 26, 2009 Economic Highlights Southeastern Employment Payroll Employment Growth by State 1 Manufacturing Durable Goods 2 Consumer Spending The Conference Board Consumer Confidence Index 3 Real Estate
NATIONAL ASSOCIATION of REALTORS RESEARCH DIVISION. Prepared for Florida REALTORS
 NATIONAL ASSOCIATION of REALTORS RESEARCH DIVISION Prepared for Florida REALTORS NATIONAL ASSOCIATION OF REALTORS RESEARCH DIVISION Page 1 Page 3 Page 4 Page 6 Page 7 Page 8 Page 9 Page 10 Page 11 Page
Smoothed Weighted National Housing Index (base = January 2008)
") HOUSING INDEX February 2013 House Prices Remain Stubbornly High 1 1 1 120 Smoothed Weighted National Housing Index (base = January 8) 178.6 102.2 Value Index Volume Index The FNB House Price Index fell
HOUSING INDEX February 2013 House Prices Remain Stubbornly High 1 1 1 120 Smoothed Weighted National Housing Index (base = January 8) 178.6 102.2 Value Index Volume Index The FNB House Price Index fell
PROPERTY BAROMETER FNB City of Cape Town House Price Indices
 19 July 2017 MARKET ANALYTICS AND SCENARIO FORECASTING UNIT JOHN LOOS: HOUSEHOLD AND PROPERTY SECTOR STRATEGIST 087-328 0151 john.loos@fnb.co.za LIZE ERASMUS STATISTICIAN 087-335 6664 lize.erasmus@@fnb.co.za
Young-Adult Housing Demand Continues to Slide, But Young Homeowners Experience Vastly Improved Affordability
 Young-Adult Housing Demand Continues to Slide, But Young Homeowners Experience Vastly Improved Affordability September 3, 14 The bad news is that household formation and homeownership among young adults
Smoothed Weighted National Housing Index (base = January 2008)
") HOUSING INDEX January 2014 Rising Volumes Decelerate House Prices For Now 220 200 180 160 1 120 100 80 60 Smoothed Weighted National Housing Index (base = January 2008) Value Index Volume Index Although
HOUSING INDEX January 2014 Rising Volumes Decelerate House Prices For Now 220 200 180 160 1 120 100 80 60 Smoothed Weighted National Housing Index (base = January 2008) Value Index Volume Index Although
State of the Nation s Housing 2008: A Preview
 State of the Nation s Housing 28: A Preview Eric S. Belsky Remodeling Futures Conference April 15, 28 www.jchs.harvard.edu The Housing Market Has Suffered Steep Declines Percent Change Median Existing
Change on the Horizon:
 Change on the Horizon: An overview of the economy and its impact on commercial real estate By Elliot M. Shirwo, Founder and Principal BridgeCore Capital, Inc. Commercial real estate is intrinsically linked
REAL ESTATE SENTIMENT INDEX 1 st Quarter 2016
 About Real Estate Sentiment Index (RESI) The Real Estate Sentiment Index (RESI) is jointly developed by the Real Estate Developers Association of Singapore (REDAS) and the Department of Real Estate (DRE),
REAL ESTATE SENTIMENT INDEX 1 st Quarter 2014
 About Real Estate Sentiment Index (RESI) The Real Estate Sentiment Index (RESI) is jointly developed by the Real Estate Developers Association of Singapore (REDAS) and the Department of Real Estate (DRE),
Housing Bulletin Monthly Report
 February 21 1 Housing Bulletin Monthly Report Housing Starts 25, 2, 15, 1, 5, Alberta Housing Starts up 5 per cent from 29 From February 29 to 21, preliminary housing starts increased 82.7 per cent across
FY General Revenue Forecast Presentation
 FY 2015-2019 General Revenue Forecast Presentation Steven A. Solomon Director of Finance February 18, 2014 Overview Current Economic Outlook National State Local FY 2014 2nd Quarter Revenue Update Five
Economic Highlights. Retail Sales Components 1. University of Michigan Consumer Sentiment Index 2. Industrial Production and Capacity Utilization 3
 November 17, 2010 Economic Highlights Consumer Spending Retail Sales Components 1 University of Michigan Consumer Sentiment Index 2 Manufacturing Industrial Production and Capacity Utilization 3 Real Estate
Survey of Emerging Market Conditions
 Survey of Emerging Market Conditions Quarter 1 2008 Preview Edition Published March 18, 2008 Lead Researcher and Analyst Dr. Wayne R. Archer, Executive Director University of Florida Bergstrom Center for
Housing Price Forecasts. Illinois and Chicago PMSA, May 2018
 Housing Price Forecasts Illinois and Chicago PMSA, May 2018 Presented To Illinois Realtors From R E A L Regional Economics Applications Laboratory, Institute of Government and Public Affairs University
An Introduction to RPX INTRODUCTION
 An Introduction to RPX INTRODUCTION Radar Logic is a real estate information company based in New York. We convert public residential closing data into information about the state and prospects for the
OFFICE MARKET ANALYSIS:
 OFFICE MARKET ANALYSIS: DAVID WEST RMLS Fellow Certificate of Real Estate Development Student Masters of Urban and Regional Planning Candidate While the Portland office market continues the slow recovery
PROPERTY BAROMETER FNB City of Cape Town House Price Indices
 16 February 2018 MARKET ANALYTICS AND SCENARIO FORECASTING UNIT JOHN LOOS: HOUSEHOLD AND PROPERTY SECTOR STRATEGIST 087-328 0151 john.loos@fnb.co.za THULANI LUVUNO STATISTICIAN 087-730 2254 thulani.luvuno@@fnb.co.za
Residential May Karl L. Guntermann Fred E. Taylor Professor of Real Estate. Adam Nowak Research Associate
 Residential May 2008 Karl L. Guntermann Fred E. Taylor Professor of Real Estate Adam Nowak Research Associate The use of repeat sales is the most reliable way to estimate price changes in the housing market
RESEARCH BRIEF TURKISH HOUSING MARKET: PRICE BUBBLE SEPTEMBER 2014 SUMMARY. A Cushman & Wakefield Research Publication OVERVIEW
 RESEARCH BRIEF TURKISH HOUSING MARKET: PRICE BUBBLE SEPTEMBER 2014 SUMMARY OVERVIEW Debates on the existence of a price bubble in the Turkish housing market have continued after numerous news releases
} Construction jobs have
 Texas Housing Market Finally Building a Solid Recovery By D Ann Petersen } Construction jobs have contributed to total employment consistently beginning this year, making construction the last of the major
THE REAL ESTATE BOARD OF NEW YORK
 THE REAL ESTATE BOARD OF NEW YORK REAL ESTATE BROKER CONFIDENCE INDEX FIRST QUARTER 2018 EXECUTIVE SUMMARY The Real Estate Board of New York s (REBNY) Real Estate Broker Index for the first quarter of
Smoothed Weighted National Housing Index (base = January 2008)
") HOUSING INDEX November 2012 New Housing Supply Soften House Prices 200 180 160 140 120 100 80 Smoothed Weighted National Housing Index (base = January 2008) 164.1 143.0 60 40 Value Index Volume Index Data
HOUSING INDEX November 2012 New Housing Supply Soften House Prices 200 180 160 140 120 100 80 Smoothed Weighted National Housing Index (base = January 2008) 164.1 143.0 60 40 Value Index Volume Index Data
The State of the Nation s Housing
 The State of the Nation s Housing Eric S. Belsky Remodeling Futures Conference April 13, 21 www.jchs.harvard.edu Existing Home Sales Improved then Retracted, While New Home Sales Are Still in the Basement
Connecticut First Nine Months Housing Report 2014
 Connecticut First Nine Months Housing Report 2014 First Nine Months of 2014 Highlight Positive Outlook for Multi-family Home Construction Millennial buyers are finally increasing their rate of household
PROPERTY INSIGHTS. Market Overview. Buoyant office take-up in CBD. Hong Kong Quarter 2, DTZ office rental index (Q =100)
") PROPERTY INSIGHTS Hong Kong Quarter 2, 215 Market Overview Buoyant office take-up in CBD Demand for office space in CBD continued to be dominated by Mainland China financial institutions, however, expansion
PROPERTY INSIGHTS Hong Kong Quarter 2, 215 Market Overview Buoyant office take-up in CBD Demand for office space in CBD continued to be dominated by Mainland China financial institutions, however, expansion
Residential January 2009
 Residential January 2009 Karl L. Guntermann Fred E. Taylor Professor of Real Estate Adam Nowak Research Associate Methodology The use of repeat sales is the most reliable way to estimate price changes
Reveals National Economy Hurting Local Commercial Markets
 Latest SIOR Index Reveals National Economy Hurting Local Commercial Markets Lawrence Yun is Senior Vice President and Chief Economist at the NATIONAL ASSOCIATION OF REALTORS. He writes regular columns
FNB PROPERTY BAROMETER
 HOME LOANS DIVISION FNB PROPERTY BAROMETER 4 TH Quarter 2009 - Ending the last decade on a strengthening note, but financial stress and affordability issues are far from over PROPERTY AND MORTGAGE MARKET
PROPERTY BAROMETER FNB City of Cape Town House Price Indices
 13 November 2017 MARKET ANALYTICS AND SCENARIO FORECASTING UNIT JOHN LOOS: HOUSEHOLD AND PROPERTY SECTOR STRATEGIST 087-328 0151 john.loos@fnb.co.za LIZE ERASMUS STATISTICIAN 087-335 6664 lize.erasmus@@fnb.co.za
2015 First Quarter Market Report
 2015 First Quarter Market Report CAAR Member Copy Expanded Edition Charlottesville Area First Quarter 2015 Highlights: Median sales price for the region was up 5.1% over Q1-2014, rising from $244,250 to
Domain.com.au House Price Report December Quarter 2015
 Domain.com.au House Price Report December Quarter 2015 Dr Andrew Wilson Senior Economist for Domain.com.au Key findings Record drop in Sydney median house prices over the December quarter Melbourne and
September bounce in house price sentiment
 Knight Frank/Markit House Price Sentiment Index (HPSI) SEPTEMBER 2012 September bounce in house price sentiment Key headlines for September UK households perceive that the value of their home declined
REAL ESTATE SENTIMENT INDEX 3 rd Quarter 2014
 About Real Estate Sentiment Index (RESI) The Real Estate Sentiment Index (RESI) is jointly developed by the Real Estate Developers Association of Singapore (REDAS) and the Department of Real Estate (DRE),
NAB COMMERCIAL PROPERTY SURVEY Q4 2017
 EMBARGOED UNTIL 11.30 AM WEDNESDAY 21 FEBRUARY 2018 NAB COMMERCIAL PROPERTY SURVEY Q4 2017 Date February 2018 NAB Behavioural & Industry Economics KEY FINDINGS The NAB Commercial Property Index (a measure
Cycle Monitor Real Estate Market Cycles Second Quarter 2018 Analysis
 Black Creek Research Cycle Monitor Real Estate Market Cycles Second Quarter 0 Analysis Real Estate Market Cycle analysis of five property types in Metropolitan Statistical Areas (MSAs). Important note:
Residential December 2009
 Residential December 2009 Karl L. Guntermann Fred E. Taylor Professor of Real Estate Adam Nowak Research Associate Year End Review The dramatic decline in Phoenix house prices caused by an unprecedented
analyst REGIONAL San Joaquin County Housing: Current Challenges, Future Needs Stockton
 Lodi 12 EBERHARDT SCHOOL OF BUSINESS Business Forecasting Center in partnership with San Joaquin Council of Governments 99 26 5 205 Tracy 4 Lathrop Stockton 120 Manteca Ripon Escalon REGIONAL analyst december
PROPERTY OUTLOOK REPORT 2018
 PROPERTY OUTLOOK REPORT 2018 Table of Contents 1 2 3 4 5 6 7 8 9 10 0Outlook Report 2018 Overview 02017: Year at a Glance PropertyGuru Market Index 2017 Kuala Lumpur Selangor Penang Johor Malaysian Property
REA Group Property Demand Index. Nerida Conisbee REA Group Chief Economist. Introduction NOVEMBER 2016
 REA Group Property Demand Index Nerida Conisbee REA Group Chief Economist NOVEMBER 216 Introduction Perhaps there is a sense of nervousness among Australians following the recent US election, because demand
RESIDENTIAL PROPERTY PRICE INDEX (RPPI)
") EUROSYSTEM RESIDENTIAL PROPERTY PRICE INDEX (RPPI) 2017Q1 Residential property prices continued to increase moderately in 2017Q1 1 The RPPI (houses and apartments) recorded the third consecutive marginal
EUROSYSTEM RESIDENTIAL PROPERTY PRICE INDEX (RPPI) 2017Q1 Residential property prices continued to increase moderately in 2017Q1 1 The RPPI (houses and apartments) recorded the third consecutive marginal
Residential January 2010
 Residential January 2010 Karl L. Guntermann Fred E. Taylor Professor of Real Estate Adam Nowak Research Associate Another improvement to the ASU-RSI is introduced this month with new indices for foreclosure
Housing Price Forecasts. Illinois and Chicago PMSA, March 2016
 Housing Price Forecasts Illinois and Chicago PMSA, March 2016 Presented To Illinois Association of Realtors From R E A L Regional Economics Applications Laboratory, Institute of Government and Public Affairs
House price report. September quarter Dr Andrew Wilson Senior Economist for the Domain Group
 September quarter 2014 Dr Andrew Wilson Senior Economist for the Domain Group Key findings Most capital city housing markets recorded falls in house prices over the September quarter September quarter
The OeNB property market monitor of April 2015: Residential property price growth in Austria slowed down markedly in the second half of 2014
 The OeNB property market monitor of April : Residential property price growth in slowed down markedly in the second half of Martin Schneider, Karin Wagner, Walter Waschiczek Residential property price
Residential March 2010
 Residential March 2010 Karl L. Guntermann Fred E. Taylor Professor of Real Estate Adam Nowak Research Associate The latest data for December 2009 reveals that overall house prices declined by 13 percent
REAL ESTATE AND THE ECONOMIC OUTLOOK THROUGH 2013:
 1 1 REAL ESTATE AND THE ECONOMIC OUTLOOK THROUGH 2013: Coping With A Different Kind Of Housing Recovery A Presentation To The Commercial Real Estate Education Summit Monrovia, California July 13, 2012
Steady as She Goes Texas Apartment Markets Recovering
 Steady as She Goes Texas Apartment Markets Recovering Ali Anari and Harold D. Hunt September 5, 1 Publication A new Real Estate Center study finds apartment markets in,, and San Antonio are in the final
Democratising Property Investments
 Democratising Property Investments What I wish to share today 1. Property sector outlook 2. How theedgeproperty.com can help you make better property investment decisions Property Sector Outlook The property
Q B O S T O N M A R K E T R E P O R T
 Q 3 2 1 7 B O S T O N M A R K E T R E P O R T Introducing the Compass Q3 217 Greater Boston Market Report Page 2 Page 3 Page 5 Page 7 Page 8 Map of Coverage Area Single Family Overview Condo Overview Time
Vesteda Market Watch Q
 Vesteda Market Watch Q1 2018 7.6 Housing Market Indicator 1 Housing Market Indicator The Housing Market Indicator in the first quarter of 2018 hits a level of 7.6. This score clearly reflects the positive
Metropolitan Indianapolis Board of REALTORS. Broker/Owner Meeting March 14, 2007
 Metropolitan Indianapolis Board of REALTORS Broker/Owner Meeting March 14, 2007 Tom Renkert Information Services Director MIBOR PropertyLinx 2 Implementation Time Line February 1-28 March 1 June 30 July
Housing Price Forecasts. Illinois and Chicago PMSA, January 2018
 Housing Price Forecasts Illinois and Chicago PMSA, January 2018 Presented To Illinois Realtors From R E A L Regional Economics Applications Laboratory, Institute of Government and Public Affairs University
By several measures, homebuilding made a comeback in 2012 (Figure 6). After falling another 8.6 percent in 2011, single-family
. After falling another 8.6 percent in 2011, single-family") 2 Housing Markets With sales picking up, low inventories of both new and existing homes helped to firm prices and spur new single-family construction in 212. Multifamily markets posted another strong year,
2 Housing Markets With sales picking up, low inventories of both new and existing homes helped to firm prices and spur new single-family construction in 212. Multifamily markets posted another strong year,
CITI HABITATS. Manhattan Residential Sales Market Report
 Manhattan Residential Sales Market Report Contents 4/7 12/17 3 8 9 10 Market Wide 4 Sales / Days on Market 5 / Months of Supply 6 7 Market Share Resale Co-ops Resale Condos New Developments 11 Luxury Neighborhoods
House prices fall in June, but households in most regions optimistic about price rises over next 12 months
 Knight Frank/Markit House Price Sentiment Index (HPSI) JUNE 2012 House prices fall in June, but households in most regions optimistic about price rises over next 12 months Key headlines for June UK households
CoStar Commercial Repeat Sales Indices (CCRSI)
") CoStar Commercial Repeat Sales Indices (CCRSI) Copyright 2011 CoStar Group, Inc. All Rights Reserved. This news release includes "forward-looking statements" including, without limitation, statements regarding
CoStar Commercial Repeat Sales Indices (CCRSI) Copyright 2011 CoStar Group, Inc. All Rights Reserved. This news release includes "forward-looking statements" including, without limitation, statements regarding
Housing Price Forecasts. Illinois and Chicago PMSA, March 2018
 Housing Price Forecasts Illinois and Chicago PMSA, March 2018 Presented To Illinois Realtors From R E A L Regional Economics Applications Laboratory, Institute of Government and Public Affairs University
Quarterly Review The Australian Residential Property Market and Economy
 Quarterly Review The Australian Residential Property Released January 2018 Contents Introduction 3 Housing Market 4 Mortgage Lending 11 Housing Supply 17 Demographic Overview 20 Household Finances 22 National
Economic and Market Outlook: SAN ANTONIO OFFICE Q1 2016
 Economic and Market Outlook: HOUSTON SAN ANTONIO AUSTIN Table 1. Key market indicators for Q1 2016, and their percent (%) change on a quarter-over-quarter (QoQ) and year-over-year (YoY) basis (Class A
Filburn Ave Wasco, CA
 Great Opportunity For Investors and Developers PRICE: $5,330,000 LOCATION SIZE: ZONING: South Wasco City, corner of Palm & Filburn 75.77 Acres AG / R1 APN#: 490-020-04 UTILITIES: Water & Sewer - City of
Housing market report
 Capital city market report Prepared February Dr Andrew Wilson, Senior Economist Year off to a flying start as economic outlook improves National overview Australian capital city housing markets are providing
Has The Office Market Reached A Peak? Vacancy. Rental Rate. Net Absorption. Construction. *Projected $3.65 $3.50 $3.35 $3.20 $3.05 $2.90 $2.
 Research & Forecast Report OAKLAND METROPOLITAN AREA OFFICE Q1 Has The Office Market Reached A Peak? > > Vacancy remained low at 5. > > Net Absorption was positive 8,399 in the first quarter > > Gross
The Manhattan real estate market
 Manhattan Market Report Q 04 by the numbers +.6% StreetEasy Condo Price Index (QuarteroverQuarter) 0.% StreetEasy Condo Price Forecast (MonthoverMonth) 6.0% Total (QuarteroverQuarter) 6.0% Number of Pending
INLAND EMPIRE REGIONAL INTELLIGENCE REPORT
 INLAND EMPIRE REGIONAL INTELLIGENCE REPORT June 2016 EMPLOYMENT After a slow start to 2016, the Inland Empire s labor market returned to form, in recent job figures. Seasonally adjusted nonfarm employment
INLAND EMPIRE REGIONAL INTELLIGENCE REPORT. School of Business. April 2018
 INLAND EMPIRE REGIONAL INTELLIGENCE REPORT April 2018 Key economic indicators suggest that the Inland Empire s economy will continue to expand throughout the rest of 2018, building upon its recent growth.
ECONOMIC CURRENTS. Vol. 5 Issue 2 SOUTH FLORIDA ECONOMIC QUARTERLY. Key Findings, 2 nd Quarter, 2015
 ECONOMIC CURRENTS THE Introduction SOUTH FLORIDA ECONOMIC QUARTERLY Economic Currents provides an overview of the South Florida regional economy. The report presents current employment, economic and real
Housing Health Report Housing supply outlook suggests market high is leveling off
 November 2018 Housing Health Report Housing supply outlook suggests market high is leveling off For the first time since 2011, new and existing housing supply experiences blanket declines. 2018 activity
Monthly Market Snapshot
 SEPTEMBER 2018 Vacancy continues to fall. Nearing the end of the third quarter, the vacancy rate dropped 10 basis points to 6.4%, compared to this time last month at 6.5%. Occupancy of the 1.1 million
Hamilton s Housing Market and Economy
 Hamilton s Housing Market and Economy Growth Indicator Report November 2016 hamilton.govt.nz Contents 3. 4. 5. 6. 7. 7. 8. 9. 10. 11. Introduction New Residential Building Consents New Residential Sections
Brisbane CBD Office Market: the 1990s Vs Now
 September 2013 Brisbane CBD Office Market: the 1990s Vs Now Key Points Figure 1: Brisbane CBD Sub-lease Vacancy % of Total Stock 3.0 2.5 2.0 1.5 1.0 1993 2002 2009 2013 Total market vacancy in Q2/2013
Mueller. Real Estate Market Cycle Monitor Third Quarter 2018 Analysis
 Mueller Real Estate Market Cycle Monitor Third Quarter 2018 Analysis Real Estate Physical Market Cycle Analysis - 5 Property Types - 54 Metropolitan Statistical Areas (MSAs). It appears mid-term elections
Buy-to-Let Index Scotland
 Buy-to-Let Index Scotland Under embargo until 00:01 Wednesday 24 th February 2016 January 2016 Scotland s tenants move back into the black Six-month low for late rent, with only 11.1% of January rent falling
End in sight for housing troubles?
 End in sight for housing troubles? D. L. Chertok September 19, 2011 Abstract A historical relationship between home prices and family income is examined based on more than 40 s of data. A new home affordability