UPTOWN NASHVILLE PRO FORMA TEAM
|
|
|
- Owen Snow
- 5 years ago
- Views:
Transcription
1 PRO FORMA
2 FINANCIAL SUMMARY The transformation of the Sulphur Dell District into Uptown Nashville begins with the combination of the owners existing parcels and the immediate acquisition of surrounding pieces of land. By acting quickly, the developers can feasibly purchase a large amount of land before prices increase with the completion of the stadium and the area s growing popularity. The major debt financing of the project is executed through three interim loans at the beginning of each phase of development. The construction loans are then rolled into permanent loans, which reflect good LTV and debt coverage ratios. The only source of equity is the owners upfront land and property contributions. Uptown Nashville will also be funded in small part by taking advantage of Low Income Housing Tax Credits, Tax Increment Financing, an Environmental Protection Agency grant for Brownfield remediation, and Tennessee s environmental tax credits. The financial health of the development is not heavily reliant on public subsidies; rather they are used to supplement traditional debt and equity sources and to involve stakeholders from various interest groups. Phase 1 focuses on capturing the demand around existing amenities, specifically the farmers market, the bicentennial mall and the new sounds stadium. By expanding the Farmer s Market into a truly mixed-use area, revenue streams are diversified and increased with the inclusion of office space, retail space and multi-family apartment buildings. By building up this area, we will capture market share and create linkages from the market area to the bicentennial mall to the stadium area. Phase 2 connects the marfket and stadium area to the riverfront along the northern portion of the district. This is designed to take advantage of the continued development around the stadium. Mixed-use facilities also include live-work units that are affordably priced and designed to attract entrepreneurs, craftsmen and boutique manufacturing users. The inclusion of a boutique, full-service hotel on the Cumberland River will contribute to the development s incoming cash flow, and is projected to have a high sale value should the owners chose to sell in The hotel s restaurant and event space will also increase foot traffic and ramp-up public excitement for the subsequent waterfront transformation. Phase 3 will usher in the complete transformation of the district s waterfront area. The improved street grid is complemented by linear parks that will connect the heart of the district to the Cumberland river. By waiting until 2022 to begin construction in this prime piece of real estate, it will be possible to capture escalating demand for luxury townhouses, condominiums, office space, retail and workspace close to the riverfront, the Central Business District, the Sounds Stadium, and the Farmer s Market area. At this point, higher rents can be achieved, increasing the development s financial strength and allowing for affordable units to be dispersed throughout each block. After the completion of Phase 3, the owners can choose to sell the entire development, which would fetch a yield of 26%. Choosing to sell part of the development is also a smart strategy, since revenues from the mixed-use buildings will continue to provide the owner s with a reliable and diversified source of commercial income. Either way, Uptown Nashville will create value with minimal support on public subsidies. 2
3 PRO FORMA SUMMARY BOARD Uptown Nashville Summary Pro Forma Annual Cash Flow Ratio Analysis Rental Housing Sale Housing Total Rental Housing Sale Housing Total Leveraged Cash Flow Leveraged Net Present Value For-Sale Housing Rental Housing Rental Housing For-Sale Housing Factors Afforable 553,929 1,141,093 1,175,326 2,039,616 2,881,358 2,967,799 3,226,657 3,323,457 3,423,161 3,525,855 Market-Rate 4,353,273 8,967,743 9,236,775 15,483,568 21,845,593 22,500,960 23,755,389 24,468,050 25,202,092 26,084,780 Affordable 4,117,618 4,241,146 4,550,396 4,686,908 Market-Rate 39,682,111 40,872,574 48,112,859 49,556,245 Luxury 6,022,016 6,202,676 7,098,619 7,311,577 3,104,247 6,394,748 6,586,591 8,238,180 9,982,937 10,282,425 11,467,592 12,714,614 13,096,053 13,488,934 1,690,806 3,483,061 3,587,553 4,961,400 6,414,449 6,606,882 7,854,002 9,170,002 9,445,103 9,728, ,469 1,527,525 1,527,525 2,376,150 2,376,150 2,376,150 2,376,150 3,100,262 3,193,254 3,289,035 1,773,948 1,827,150 1,881,949 3,407,195 3,509,395 3,614,660 3,723, , , ,428 1,380,716 1,759,175 1,759,175 3,579,946 4,783,182 4,783,182 4,783,182 60, , , , , ,919 1,004,203 1,328,236 1,368,083 1,409,125 9,156,594 7,023,271 7,233,970 7,450,989 3,397,636 3,499,566 3,604,553 9,156,594 20,211,072 31,188,040 32,104,152 38,306,101 50,415,343 51,829, ,492, ,989, ,070, ,674,297 Afforable 5,636,469 5,805,563 7,282,745 7,501,228 Market-Rate 26,632,710 27,431,691 34,153,565 35,178,172 Affordable 3,748,656 3,861,115 4,142,655 4,266,935 Market-Rate 36,085,729 37,168,301 38,283,350 39,431,850 Brownfield Remediation Total Asset Value Luxury 5,122,671 5,276,351 5,434,641 5,597,681 Debt Service Unleveraged IRR Before Taxes Leveraged IRR Before Taxes Multiyear Development Program For-Sale Housing 34,217,888 35,244,424 16,027,245 16,508,063 9,663,734 9,953,646 16,727,406 17,229,228 12,526,913 12,902,720 10,377,061 10,688,373 13,011,839 4,226,863 3,279,451 6,299, , , , , ,248 1,299,119 1,338,092 1,407,960 1,450, ,910 1,133,230 1,669, ,787,600 41,639,000 9,996,665 29,456,198 25,367,993 10% 4,163,900 8,868,411 8,884,476 7,468,279 45,802, ,549,181 86,033, ,185,430 73,428, ,306,667 68,397,984 47,860,646 49,296,465 (36,646,306) (87,338,108) (54,845,115) 32,104,152 (88,879,329) (23,012,932) 51,829,186 (2,813,789) 44,591,500 75,209,711 77,377,831 9,156,594 20,211,072 31,188,040 32,104,152 38,306,101 50,415,343 51,829, ,492, ,989, ,070, ,674,297 8% 114,457, ,638, ,850, ,301, ,826, ,191, ,864,827 1,331,160,977 1,412,368,549 1,538,379,464 1,583,428,708 10% 158,342,871-1% 26% 45,802, ,549,181 86,033, ,185,430 73,428, ,306,667 68,397,984 59,543,770 80,661,885 64,524,866 89,029,801 40,385,551 21,861,333 13,679,597 9,572,129 9,859,293 3,870,345 9,113,368 13,307,484 3,476,946 9,263,883 11,888,944 5,653,136 7,074,123 7,963,296 8,585,485 9,226,339 (77,363,284) 6,956,548 5,624,050 1,498,616 7,340,860 6,828,989 1,498,616 3,389,898 1,498,616 1,498,616 1,498,616 (51,379,617) (8,833,043) (2,129,116) 35,968,066 (2,284,422) 6,982,292 49,565,948 13,472,039 51,806,417 77,694,972 78,010,785 12% (110,010,235) 12% 123,791, % Total Buildout Affordable 323 units Market Rate 1102 units ,102 1,102 1,102 1,102 1,102 1,102 Affordable 98 units Market Rate 793 units Luxury 39 units Hotel Structured Parking Surface Parking 155 rooms ,312 spaces ,059 1,337 1,337 1,825 2,312 2,312 2, spaces Affordable 275,000 s.f. 31, , , , , , , , , ,550 Market Rate 1,102,000 s.f. 253, , , ,500 1,102,000 1,102,000 1,102,000 1,102,000 1,102,000 1,102,000 Affordable 107,800 s.f. 24,000 24,000 25,000 25,000 Market Rate 793,000 s.f. 198, , , ,250 Retail & Micro-Retail Surface Parking Luxury 93,600 s.f. 23,400 23,400 23,400 23,400 Total Unit Development and Infrastructure Costs Infrastructure Costs Office Retail Hotel Structured Parking Surface Parking Light Industrial & Craft Existing Properties Office Retail Hotel Structured Parking Surface Parking Light Industrial & Craft Demolition/Site Prep Cost Land Acquisition Total Infrastructure Soft costs Total Total Loan Proceeds Total Subsidy Proceeds Upfront Equity Net Present Value Debt Coverage Loan to Cost Loan to Value Approximate Return on Public Investment Rental Housing Total Costs of Final Sale Project Buildout by Development Units Project Buildout by Area Office & Micro-Office Hotel Structured Parking 796,590 s.f. 239, , , , , , , , , , ,277 s.f. 123, , , , , , , , , ,277 79,730 s.f. 39,865 79,730 79,730 79,730 79,730 79,730 79, ,950 s.f. 117, , , , , , , , , , ,045 s.f. 39,923 79,845 79, , , , , , , ,045 4,302,932 s.f. 804,741 1,672,382 1,672,382 2,384,763 3,096,894 3,096,894 3,663,668 3,984,792 3,985,792 3,985,792 Affordable per unit 81,195 26,226,005 Owner's Equity 77,363, % Market Rate per unit 111, ,396,138 Total Equity 77,363, % Affordable per unit Market Rate per unit 92,376 73,254,030 Interim Loan #1, rolls into Permanent Loan 204,730, % Office/Commercial Structured Parking Luxury per unit 266,642 10,399,021 Interim Loan #2, rolls into Permanent Loan 129,415, % Percentage per s.f ,908,867 Interim Loan #3, rolls into Permanent Loan 54,972, % Retail per s.f ,631,380 Total Debt 389,118, % Hotel per room 83,947 13,011,839 per space 5,971 13,806,035 TIF 13,487, % Surface Parking per space ,098 Infrastructure 6,169, % Paving Green Paving Off Street Bike Lanes Sidewalk Park Space Brownfields Solar Panels Train Track Move Green Roof Power Lines Unit Cost 77,651 Public EPA Grant for Coalition Brownfield Assessment 1,000, % per s.f. 30 3,637,440 Green Roof & Solar ITC 3,011, % per s.f ,000 Total Subsidies 27,673, % per s.f ,500 per s.f. 12 2,461,200 7,609,771 Private per s.f ,858,000 per s.f. 4 1,787,600 per unit ,000 per l.f. 2 3,000 per s.f. 8 1,864,000 per l.f ,895,850 Total Infrastructure Costs 6,169,140 56,503,450 Year-by-Year Cumulative Absorption Total Costs Equity and Financing Sources Equity Sources Financing Sources Public Subsidies LIHTC Syndication Current Site Value (start of Year 0) Projected Site Value (end of Year 10) Total Amount 4,005, ,154, ,457,430 1,583,428, % 3
4 NEW BLOCK ASSUMPTIONS AND USES 1A/B 2A 2B/C A 6A 6B 8A 6C 12 B 8B 6D 8C 7A 9A 10 7B 9B 7C 9C 11 2D New Block Assumptions and Uses Uses for Phase I New Blocks Uses for Phase II New Blocks Block Type Area Block Type Area 1A/B Retail 25,000 3 Retail 91,800 1A/B Residential 150,000 3 Residential 375,400 1A/B Retail 65,000 3 Office 197,400 1A/B Office 260,000 3 Parking 45,000 2A Retail 40,500 4 Parking 71,100 2A Office 162,000 4 Retail 67,100 2A Structured Parking 202,500 4 Office 50,100 2B/C Market 31,250 4 Residential 225,400 2B/C Office 15,625 4 Craft_Residential 7,500 2B/C Patio 75,000 4 Craft Space 11,000 2B/C Market 38,000 5 Parking 50,400 2B/C Office 19,000 5 Retail 37,300 2B/C Market 38,000 5 Office 37,300 2D Office 55,800 5 Residential 223,800 2D Residential 347,800 5 Craft_Residential 10, Residential 133,732 5 Craft Space 15, Retail 28,654 6A Retail 26, Craft_Residential 7,500 6A Residential 85, Craft Space 11,000 6A Craft_Residential 10, Retail 39,400 6A Craft Space 15, Residential 157,600 12B Waterfront Park 241, Retail 19, Office 133, Structured Parking 32,000 Uses for Phase III New Blocks Block Type Area 6B Office 40,550 6B Residential 182,850 6B Parking 66,000 6C Greenspace 37,695 6D Office 31,100 6D Micro-Retail 6,000 6D Micro-Office 5,600 6D Residential 147,000 6D Parking 32,250 7A Parking 49,500 7A Micro-Retail 4,800 7A Micro-Office 4,400 7A Retail 32,400 7A Residential 158,400 7B Greenspace 54,405 7C Retail 18,700 7C Residential 74,500 7C Light Industrial 7,680 7C Craft Residentia 13,500 7C Craft Space 19,800 8A Retail 40,550 8A Residential 214,050 8A Parking 39,200 8B Greenspace 41,202 8C Residential 181,800 8C Office 35,600 9A Parking 72,000 9A Retail 39,600 9A Office 39,900 9A Residential 158,400 9B Greenspace 51,883 9C Retail 26,700 9C Residential 138,900 9C Craft Residentia 10,500 9C Craft Space 15,400 12A Hotel 59,800 4


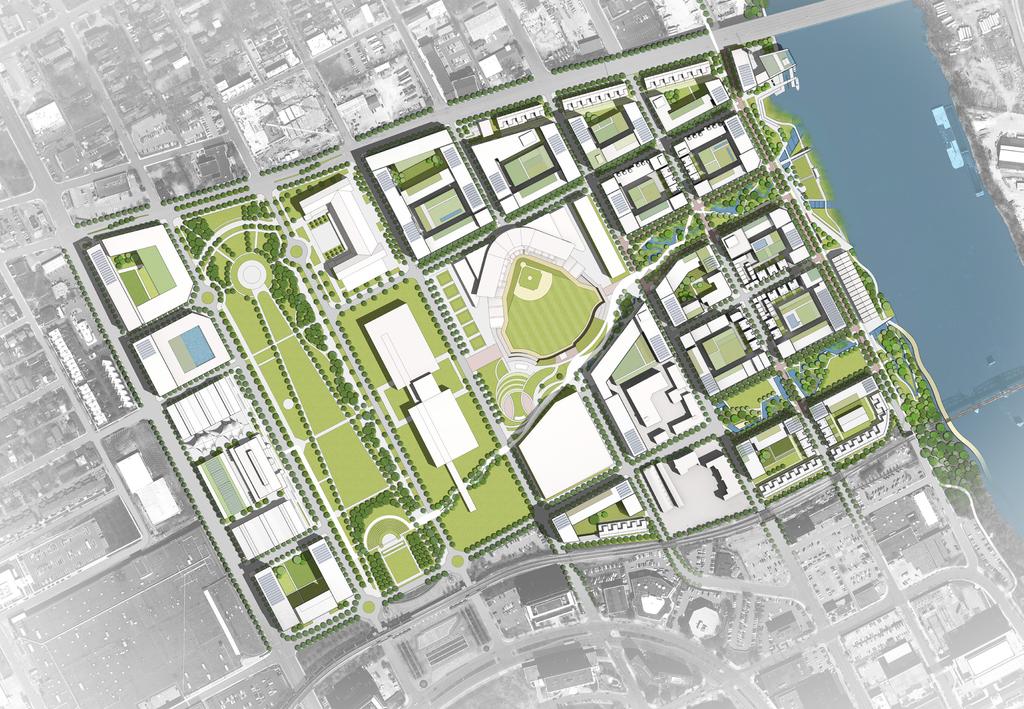
5 PHASING AND SOURCES & USES PHASE 1: LEVERAGE EXISTING AMENITIES PHASE 2: CONNECT TO RIVER PHASE 3: COMPLETE THE DISTRICT ight Industrial & Craft Surface Parking Structured Parking Micro-Retail Retail Micro-Office Office Light 13,500 Industrial SF Light & Industrial Craft & 13,500 Craft SF 13,500 SF 79,845 Surface SF Parking Surface Parking 79,845 SF 79,845 SF Structured 234,500 Structured Parking SF Parking 234,500 SF 234,500 SF 107,250 Micro-Retail SF Micro-Retail 107,250 SF 107,250 SF 217,554 RetailSF Retail 217,554 SF 217,554 SF 53,625 Micro-Office SF Micro-Office 53,625 SF 53,625 SF Office 610,800 SF arket Rate Residential Market Rate Market Residential Rate Residential 634,506 SF Affordable Residential Open Space Office Affordable 158,626 Affordable Residential SF Residential 158,626 SF 158,626 SF 83,880 Open SF Space Open Space83,880 SF83,880 SF Light Industrial & Craft Surface Parking Structured Parking Hotel Retail Office 610,800 SF 610,800 SF Market Rate Residential 634,506 Affordable SF 634,506 Residential SF Open Space Light 51,300 Industrial Light SF & Industrial Craft & Craft 51,300 SF 51,300 SF Light Industrial & Craft Surface 140,145 Parking Surface SF Parking 140,145 SF 140,145 SF Surface Parking Structured 166,500 Structured Parking SF Parking 166,500 SF 166,500 SF Structured Parking 79,730 SF Hotel Hotel 79,730 SF 79,730 SF Micro-Retail 222,600 RetailSF Retail 222,600 SF 222,600 SF Retail 284,800 Office SF Office 284,800 SF 284,800 SF Micro-Office Market Rate Market Residential Rate Residential 739,440 SF 739,440 SF 739,440 SF Office Affordable 184,860 Affordable Residential SF Residential 184,860 SF 184,860 SF Luxury Residential Open Space Open Space 241,800 SF 241, ,800 SF SF Market Rate Residential Affordable Residential Open Space Light 50,880 Industrial Light SF & Industrial Craft & Craft 50,880 SF50,880 SF Surface Parking 282,045 Surface SF Parking 282,045 SF 282,045 SF Structured 258,950 Structured Parking SF Parking 258,950 SF 258,950 SF 10,800 SFMicro-Retail Micro-Retail 10,800 SF10,800 SF 157,950 Retail SF Retail 157,950 SF 157,950 SF 10,000 SF Micro-Office Micro-Office 10,000 SF 10,000 SF 147,150 Office SF Office 147,150 SF 147,150 SF Luxury 93,600 Residential SFLuxury Residential 93,600 SF93,600 SF Market Rate Market Residential Rate Residential 793,000 SF Affordable 107,800 Affordable Residential SF Residential 107,800 SF 107,800 SF Open Space SF Open Space SF SF 793 STATE LIBRARY STATE LIBRARY STATE LIBRARY SOUNDS STADIUM SOUNDS STADIUM SOUNDS STADIUM BICENTENNIAL PARK FARMERS MARKET STATE MUSEUM BICENTENNIAL PARK FARMERS MARKET STATE MUSEUM BICENTENNIAL PARK FARMERS MARKET STATE MUSEUM N N N Sources & Uses Investor Equity 77,363,284 9,156,594 20,211,072 31,188,040 32,104,152 38,306,101 50,415,343 51,829, ,492, ,989, ,070, ,674,297 Interim Loan Draw 59,543,770 80,661,885 64,524,866 Interim Loan Draw 2 89,029,801 40,385,551 Interim Loan Draw 3 21,861,333 13,679,597 9,572,129 9,859,293 TIF Syndication 1,498,616 1,498,616 1,498,616 LIHTC Syndication Payment 4,005,275 4,125,433 5,175,119 5,330,372 Brownfield Remediation Grant 1,000,000 Solar Investment Tax Credit 12,656 10,125 9,281 Green Roof 1,440, , ,000 Period Beginning Cash 22,897, ,368 5,134,185 23,930,853 4,332,665 3,043,675 42,983,917 25,144,351 76,341, ,020,515 Total Sources 68,700, ,726, ,280,707 37,238, ,607, ,463,932 54,872, ,728, ,813, ,983, ,554,105 Land Acquisition 41,639,000 Demolition and Remediation 756,910 1,133,230 3,457,413 Infrastructure 9,996,665 14,728,099 14,728,099 25,367,993 Construction Costs 106,792,271 86,033, ,052,200 73,428, ,636,854 68,397,984 Debt Servicing 3,870,345 9,113,368 13,307,484 3,476,946 9,263,883 11,888,944 5,653,136 7,074,123 7,963,296 8,585,485 Soft Costs 4,163,900 8,868,411 8,884,476 7,468,279 Period Ending Cash 22,897, ,368 5,134,185 23,930,853 4,332,665 3,043,675 42,983,917 25,144,351 76,341, ,020, ,968,620 Total Uses 68,700, ,726, ,280,708 37,238, ,607, ,463,932 54,872, ,728, ,813, ,983, ,554,105 5
6 DEBT FINANCING Debt Financing Interim & Permanent Loans Factors Interim Loans Permanent Loans Interim Loan I Interim Loan II Interim Loan III Interest Rate 6.50% Loan Amount 59,543,770 80,661,885 64,524,866 13,307,484 Annual Interest Payment 3,870,345 9,113,368 Ballon Payment 204,730,522 Loan Amount 89,029,801 40,385,551 Annual Interest Payment 5,786,937 8,411,998 Ballon Payment 129,415,353 Loan Amount 21,861,333 13,679,597 9,572,129 9,859,293 3,573,203 Annual Interest Payment 1,420,987 2,310,160 2,932,349 Ballon Payment 54,972,352 Interest Rate 3.50% Balance 64,524,866 53,494,703 Loan I ADS 3,476,946 3,476,946 3,476,946 3,476,946 3,476,946 3,476,946 3,476,946 3,476,946 Balance 40,385,551 36,295,621 Loan II ADS 2,176,190 2,176,190 2,176,190 2,176,190 2,176,190 Permanent Loan Debt Service Subtotal 3,476,946 3,476,946 3,476,946 5,653,136 5,653,136 5,653,136 5,653,136 5,653,136 Total Debt Service 3,870,345 9,113,368 13,307,484 3,476,946 9,263,883 11,888,944 5,653,136 7,074,123 7,963,296 8,585,485 9,226,339 Total Ending Balloon Payment 89,790,324 Permanent Loan Calculation I Assumptions Loan Amt (PV) 64,524,866 Interest Rate (i) 3.50% Term (n) 30 Payments per Year 12 Payoff at EOY 8 Monthly Payment 289,745 Balloon Payment EOY 8 53,494,703 Monthly Loan Amortization Schedule Period Payment Interest Principal Balance 0 64,524, , , ,548 64,423, , , ,844 64,321, , , ,141 64,219, , , ,439 64,116, , , ,738 64,014, , , ,038 63,911, , , ,338 63,807, , , ,639 63,704, , , ,942 63,600, , , ,245 63,495, , , ,549 63,391, , , ,854 63,286,552 Annual Loan Amortization Schedule Year Debt Service Interest Principal Balance Pmts Remaining 0 64,524, ,476,946 2,258,370 1,218,575 63,306, ,476,946 2,215,720 1,261,226 62,045, ,476,946 2,171,577 1,305,369 60,739, ,476,946 2,125,889 1,351,056 59,388, ,476,946 2,078,602 1,398,343 57,990, ,476,946 2,029,660 1,447,285 56,543, ,476,946 1,979,005 1,497,940 55,045, ,476,946 1,926,577 1,550,368 53,494, Permanent Loan Calculation II Assumptions Loan Amt (PV) 40,385,551 Interest Rate (i) 3.50% Term (n) 30 Payments per Year 12 Payoff at EOY 5 Monthly Payment 181,349 Balloon Payment EOY 8 36,295,621 Monthly Loan Amortization Schedule Period Payment Interest Principal Balance 0 40,385, , ,791 63,558 40,321, , ,606 63,743 40,258, , ,420 63,929 40,194, , ,233 64,116 40,130, , ,046 64,303 40,065, , ,859 64,490 40,001, , ,671 64,678 39,936, , ,482 64,867 39,871, , ,293 65,056 39,806, , ,103 65,246 39,741, , ,913 65,436 39,676, , ,722 65,627 39,610,501 Annual Loan Amortization Schedule Year Debt Service Interest Principal Balance Pmts Remaining 0 40,385, ,176,190 1,413, ,696 39,622, ,176,190 1,386, ,390 38,833, ,176,190 1,359, ,019 38,016, ,176,190 1,330, ,614 37,170, ,176,190 1,300, ,211 36,295,
7 SUBSIDY FINANCING Subsidy Financing Total Subsidy Financing LIHTC Proceeds 4,005,275 4,125,433 5,175,119 5,330,372 TIF Proceeds 1,498,616 1,498,616 1,498,616 1,498,616 1,498,616 1,498,616 1,498,616 1,498,616 1,498,616 1,498,616 Solar Investment Tax Credit Proceeds 12,656 10,125 9,281 Green Roof Tax Credit Proceeds 1,440, , ,000 Brownfield Grant 1,000,000 Total Subsidy Financing Proceeds 6,956,548 5,624,050 1,498,616 7,340,860 6,828,989 1,498,616 3,389,898 1,498,616 1,498,616 1,498,616 LIHTC Syndication Calculations ,636,469 5,805,563 7,282,745 7,501,228 Soft Costs 10% 563, , , ,123 Eligible Improvements 6,200,116 6,386,119 8,011,020 8,251,351 Rate 7.6% 471, , , ,103 Total 10 4,712,088 4,853,451 6,088,375 6,271,026 Tax Credit Investor Proceeds 85% 4,005,275 4,125,433 5,175,119 5,330,372 TIF Financing Calculations 3% 2.50% With Development (Rented) Base Projected Value Increment Tax Increment 30% 0 37,272, ,391,139 44,913,494 6,522, ,059 48, ,542,873 69,306,755 29,763, , , ,729,159 71,342,560 30,613, , , ,951,034 85,124,669 43,173,636 1,079, , ,209, ,034,096 68,824,531 1,720, , ,505, ,175,969 70,670,118 1,766, , ,841, ,650, ,809,813 4,770,245 1,431, ,216, ,087, ,871,484 5,096,787 1,529, ,632, ,489, ,856,937 5,621,423 1,686, ,091, ,498, ,406,709 5,785,168 1,735, ,594, ,535, ,941,418 5,923,535 1,777, ,142, ,143, ,000,714 6,250,018 1,875, ,736, ,451, ,715,301 6,792,883 2,037, ,378, ,341, ,963,117 7,599,078 2,279, ,070, ,693, ,623,629 8,740,591 2,622, ,812, ,799, ,987,523 10,324,688 3,097, ,606, ,010, ,403,720 12,510,093 3,753, ,454, ,754, ,300,187 15,532,505 4,659, ,358, ,165, ,806,681 19,745,167 5,923, ,319,094 1,094,683,531 1,027,364,437 25,684,111 7,705, ,338,667 1,436,319,655 1,366,980,989 34,174,525 10,252, ,418,827 1,931,690,253 1,860,271,426 46,506,786 13,952, ,561,391 2,662,856,349 2,589,294,957 64,732,374 19,419, ,768,233 3,762,546,310 3,686,778,076 92,169,452 27,650, ,041,280 5,449,288,921 5,371,247, ,281,191 40,284,357 Total TIF (NPV, 12% ) 16,859,435 Equity buyer at 0.80 per 1 13,487,548 Phasing 1,498,616 Solar Investment Tax Credit Equipment Costs (panels) 37,500 30,000 27,500 Soft Costs 25% 9,375 7,500 6,875 Tax Basis 46,875 37,500 34,375 Rate 30% 14,063 11,250 10,313 Tax Credit Investor 90% 12,656 10,125 9, Green Roof Tax Credit Square Footage 160,000 73,000 98,000 Tax Basis 160,000 73,000 98,000 Rate 10 1,600, , ,000 Tax Credit Investor 90% 1,440, , , Brownfield Coalition Assessment Grant Grant 1,000,000 Total 1,000,000 Asset Valuation ,211,072 31,188,040 32,104,152 38,306,101 50,415,343 51,829, ,492, ,989, ,070, ,674,297 Total Asset Value 9% 44,913,494 69,306,755 71,342,560 85,124, ,034, ,175, ,650, ,087, ,489, ,498,437 FINANCING SOURCES 5% 79% 16% TOTAL EQUITY TOTAL DEBT TOTAL SUBSIDIES 7
8 LAND VALUATION Land Valuation Year 0 Assumptions: Owner's Parcels Assumptions: Purchased Parcels Year 0 Assumptions: TIF Eligible Blocks Year 0 Office SF (s.f.) 390,600 Office SF (s.f.) - Residential SF 182,000 Net Lease Revenue per s.f. 20 Net Lease Revenue per s.f. 20 Rent/SF 20 Net Rentable Area 90% Net Rentable Area 90% Vacancy Factor 75% cancy Factor (Regular Vacancy) 75% Vacancy Factor (Regular Vacancy) 75% Residential Revenue 2,730,000 Office Revenue 5,273,100 Office Revenue - Retail/Commercial SF 444,800 Warehouse SF 129,100 Residential SF 182,000 Rent/SF 7 Rent/SF 5 Rent/SF 20 Vacancy Factor 55% Vacancy Factor 75% Vacancy Factor 75% Retail/Commercial Revenue 1,712,480 Warehouse Revenue 484,125 Residential Revenue 2,730,000 Light Industrial SF 45,300 Parking SF 166,500 Parking SF 386,000 Rent/SF 8 Spots Estimate (300 SF per spot) Parking Spots Estimate 300 1,287 Vacancy Factor 40% Business Days , Business Days , Light Industrial Revenue 144,960 Vacancy 50% 69,375 Vacancy 50% 160,833 Price Per Day 4.00 Price Per Day 4 Parking Revenue 277,500 Parking Revenue 643,333 Leasing Revenues 4,587,440 Operations and Maintenance Expense 35% 1,605,604 Retail/Commercial SF 370,600 Retail/Commercial SF 514,800 Rent/SF 13 Rent/SF 7 2,981,836 Vacancy Factor 55% Vacancy Factor 55% Annual Cash Flow Retail/Commercial Revenue 2,649,790 Retail/Commercial Revenue 1,981,980 2,981,836 Asset Value* 8% 37,272,950 Light Industrial SF 261,600 Light Industrial SF 75,400 Total Site Size 2,236, Rent/SF 8 Rent/SF 8 Total Land Cost per sf Vacancy Factor 40% Vacancy Factor 40% Light Industrial Revenue 837,120 Light Industrial Revenue 241,280 Leasing Revenues 9,521,635 Leasing Revenues 5,596,593 Operations and Maintenance Expenser Offoce 35% 3,332,572 Operations and Maintenance Expenses Office 35% 1,958,808 6,189,063 3,637,786 Annual Cash Flow Annual Cash Flow 6,189,063 3,637,786 Asset Value* 8% 77,363,284 Asset Value* 8% 45,472,321 Acquisition Cost 10,372,000 Acquisition Cost 41,639,000 Owners' Parcels - Uses and Size Block F Purchase Parcels - Uses and Size Block A Part 1, Vacant Commercial 3,400 Part 1, Metro Parking 178,500 Part 2, Vacant Commercial 3,100 Block B Part 3, Small Service Shop (historic) 5,600 Part 1, Metro Farmer's Market 409,500 Part 4, Office Low Rise 5,600 Block C Part 5, Vacant Industrial 56,000 Part 1, Vacant Commercial 21,800 Part 6, Small Warehouse Service Sh 38,000 Part 2, Auto Repair 8300 Part 7, Retail 29,000 Part 3, Vacant Commercial 13,500 Part 8, Warehouse 31,000 Part 4, Vacant Industrial 37,000 Part 9, Vacant Commercial Service S 38,000 Block D Block H Vacant Commercial (assembled) 70,000 Part 1-Parking Lot 86,000 Block E Part 2-Vacant Industrial/Commercial 25,100 Parking Lot 74,000 Block K Block G, not doughnut Part 1, Office Building 152,000 Part 1, Parking Lot 91,000 Part 2, Vacant/Bikeway 10,500 Part 2, Vacant Industrial 30,100 Part 3, Office Building 121,000 Block M Block i Part 1, Residential Condominium 182,000 Part 1, Warehouse 15,000 Part 2, Vacant/Parking Lot 42,500 Part 2, Vacant Industrial 95,000 Total 1,158,200 Part 3, Parking Lot 23,000 Part 4, Warehouse 45,100 Part 5, Metro/Vacant 8,700 Part 6, Vacant Commercial/Bikeway 21,100 Part 7, Vacant Industrial 27,000 Part 8, Restaurant, Historical 42,000 Block J Part 1, Light Manufacturing 21,000 Part 2, Parking Lot 57,500 Part 3, Office Building 112,000 Part 4, Auto Dealer 38,000 Block L Part 1, Branch Financial Institution 196,000 Part 2, Packing Food/Processing 37,500 Total 1,343,200 8
9 AQUISITION AND DEMOLITION COSTS Acquisition & Demolition Costs Block Square Feet Appraised Value Demolition Cost Acquisition Cost Land Appraised Value Block C, Part 1, Vacant Commercial 21, ,000 38, , ,000 Block C, Part 2, Auto Repair 8, ,000 14, ,000 99,000 Block C, Part 3, Vacant Commercial 13, ,000 23, , ,000 Block C, Part 4, Vacant Industrial 37, ,000 64, , ,000 Block D, Vacant Commercial (assembled) 70, , , , ,500 Block F, Part 1, Vacant Commercial 3,400 42,000 5,950 42,000 Block F, Part 2, Vacant Commercial 3,100 40,000 5,425 40,000 Block F, Part 3, Small Service Shop (historic) 5,600 69,000 68,000 Block F, Part 4, Office Low Rise 5,600 61,000 9,800 17,000 Block F, Part 5, Vacant Industrial 56,000 79,000 98,000 79,000 Block F, Part 6, Small Warehouse Service Shop 38, ,000 66, ,000 Block F, Part 7, Retail 29,000 1,050,000 50, ,000 Block F, Part 8, Warehouse 31, ,000 54, ,000 Block F, Part 9, Vacant Commercial Service Shop 38,000 70,000 66,500 70,000 Block G, Part 1, Parking Lot 91, , , , ,000 Block G, Part 2, Vacant Industrial 30, ,000 52, , ,000 Block G, Part 3, Residential Cond. 70,000 5,800,000 Block H, Part 1, Parking Lot 86, , , ,000 Block H, Part 2, Vacant Industrial/Commercial 25, ,000 43, ,000 Block K, Part 1, Office Building 152,000 5,387, ,000 5,387,000 1,300,000 Block K, Part 2, Vacant/Bikeway 10, ,000 18, , ,000 Block K, Part 3, Office Building 121,000 4,877, ,750 4,877,000 3,900,000 Block i, Part 1, Warehouse 15, ,000 26, ,000 Block i, Part 2, Vacant Industrial 95,000 99, ,250 99,000 Block i, Part 3, Parking Lot 23, ,000 40, ,000 Block i, Part 4, Warehouse 45, ,000 78, ,000 Block i, Part 5, Metro/Vacant 8,700 87,000 15,225 87,000 Block i, Part 6, Vacant Commercial/Bikeway 21, ,000 36, ,000 Block i, Part 7, Vacant Industrial 27, ,000 47, ,000 Block i, Part 8, Restaurant, Historical 42,000 2,061, ,000 Block J, Part 1, Light Manufacturing 21, ,000 36, ,000 Block J, Part 2, Parking Lot 57, , , ,000 Block J, Part 3, Office Building 112,000 6,900, ,000 1,128,000 Block J, Part 4, Auto Dealer 38, ,000 66, ,000 Block M, Part 1, Residential Condominium 182,000 12,650, ,400 18,975,000 25,000 Block M, Part 2, Vacant/Parking Lot 42, ,000 67, , ,000 Block L, Part 1, Branch Financial Institution 196,000 4,357, ,000 1,900,000 Block L, Part 2, Packing Food/Processing 37, ,000 65, ,000 Block A, Part 1, Metro Parking 178,500 1,400, ,375 1,400,000 1,400,000 Block B, Part 1, Metro Farmer's Market 409,500 7,500, ,110 7,500,000 3,000,000 Block E, Part 1, Parking Lot 74, , , , ,500 Totals 2,571,400 61,319,000 3,615,253 41,639,000 20,722,000 Demolition Costs by Phase Phase 1 756,910 Block A 312,375 Block B 103,110 Block G 211,925 Block E 129,500 Phase 2 1,133,230 Block C 141,050 Block D 122,500 Block F 357,175 Block H 194,425 Block K1 266,000 Block M (partial) 52,080 Phase 3 1,669,813 Block i 374,150 Block K2 211,750 Block L 408,625 Block J 399,875 Block M (partial) 275,413 9
10 INFRASTRUCTURE COSTS Infrastructure Costs factors Inflation Factor 3% Public Infrastructure Quantities Green Paving for OSP (SF) Asphalt, SF (incl. on-street bike lanes) Off Street Bike Lanes (SF) Sidewalk (SF) 2,000 27,626 43,472 50,150 1,000 1,700 45,100 65,000 95,000 Public Infrastructure Costs Green Paving Costs Asphalt Costs (per s.f.) Off Street Bike Lanes Cost Sidewalk Costs Total Public Costs Private Infrastructure Quantities Brownfields (SF) Solar Panels (Quantity) Train Track Move (LF) Green Roof (SF) Power Lines (LF) Park Space (SF) Private Infrastructure Costs Brownfield Remediation Cost Solar Panels Cost Train Track Move Costs Green Roof Costs Power Lines Cost Park Space Costs 15 30, ,780 1,304,160 1,504, ,000 25, , ,000 1,140,000 1,411,079 2,362,623 3,320, , , ,000 73,000 98,000 3,927 7,204 83, , , ,787, ,500 30,000 27, , ,280, , ,374,450 2,521, ,388,000 24,180,000 16,290,000 Total Private Costs Total Infrastructure Costs Net Present Value of Costs 12% 55,971,271 9,996,665 29,456,198 25,367,993 11,407,744 31,818,821 28,688,653 Brownfield Remediation Area Block Square Feet Block i, Part 1, Warehouse 15,000 Block i, Part 2, Vacant Industrial 95,000 Block i, Part 3, Parking Lot 23,000 Block i, Part 4, Warehouse 45,100 Block i, Part 5, Metro/Vacant 8,700 Block i, Part 6, Vacant Commercial/Bikeway 21,100 Block i, Part 7, Vacant Industrial 27,000 Block J, Part 1, Light Manufacturing 21,000 Block J, Part 2, Parking Lot 57,500 Block J, Part 3, Office Building 112,000 Block J, Part 4, Auto Dealer 38,000 Block L, Part 1, Branch Financial Institution 196,000 Block L, Part 2, Packing Food/Processing 37,500 TOTAL 696,
11 ASSUMPTIONS-HOUSING Block Type Area Block Type Area Block Type Area 1A Retail 25,000 3 Retail 91,800 6B Office 40,550 1A Residential 150,000 3 Residential 375,400 6B Residential 182,850 1B Retail 65,000 3 Office 197,400 6B Parking 66,000 1B Office 260,000 3 Parking 45,000 6C Greenspace 37,695 2A Retail 40,500 4 Parking 71,100 6D Office 31,100 2A Office 162,000 4 Retail 67,100 6D Micro-Retail 6,000 2A Structured Parking 202,500 4 Office 50,100 6D Micro-Office 5,600 2BC Market 31,250 4 Residential 225,400 6D Residential 147,000 2BC Office 15,625 4 Craft_Residential 7,500 6D Parking 32,250 2BC Patio 75,000 4 Craft Space 11,000 7A Parking 49,500 2BC Market 38,000 5 Parking 50,400 7A Micro-Retail 4,800 2BC Office 19,000 5 Retail 37,300 7A Micro-Office 4,400 2BC Market 38,000 5 Office 37,300 7A Retail 32,400 2D Office 55,800 5 Residential 223,800 7A Residential 158,400 2D Residential 347,800 5 Craft_Residential 10,500 7B Greenspace 54, Residential 133,732 5 Craft Space 15,400 7C Retail 18, Retail 28,654 6A Retail 26,400 7C Residential 74, Craft_Residential 7,500 6A Residential 85,700 7C Light Industrial 7, Craft Space 11,000 6A Craft_Residential 10,500 7C Craft Residential 13, Retail 39,400 6A Craft Space 15,400 7C Craft Space 19, Residential 157,600 8A Retail 40, Retail 19,000 8A Residential 214, Office 133,000 8A Parking 39, Structured Parking 32,000 8B Greenspace 41,202 8C Residential 181,800 8C Office 35,600 9A Parking 72,000 9A Retail 39,600 9A Office 39,900 9A Residential 158,400 9B Greenspace 51,883 9C Retail 26,700 9C Residential 138,900 9C Craft Residential 10,500 9C Craft Space 15, Hotel 59,800 Micro-Live/Work Assumptions Square Footage per Unit Residential Square Footage Craft Space Square Footage 3,700 1,000 2,700 Block Total Square Footage Number of Units # Market Market Sq Ft Market Residential # Affordable Sq Affordable Affordable Ft Residential Affordable Craft Space Market Craft 11 18, ,800 4,000 10, ,700 1,000 2, , ,800 4,000 10, ,700 1,000 2, , ,500 5,000 13, ,400 2,000 5,400 6A 25, ,500 5,000 13, ,400 2,000 5,400 7C 33, ,900 7,000 18, ,400 2,000 5,400 9C 25, ,500 5,000 13, ,400 2,000 5,400 TOTALS 148, ,000 30,000 81, ,000 10,000 27,000 Townhouse Assumptions Square Footage per Unit 2400 Block Total Square Footage Number of Units # Market Market Sq Ft # Affordable Affordable Sq Ft 6B 14, , ,400 6D 14, , ,400 7A 24, , ,400 7C 14, , ,400 8A 14, , ,400 9A 14, , ,400 9C 14, , ,400 TOTALS 110, , ,800 Affordable/Workforce Housing and Low-Income Housing Tax Credit Parameters FY 2014 Income Limits for Davidson County Uptown Nashville Rents Uptown Nashville LIHTC Rents Persons in Family Income Limit Category AMI 44,800 51,200 57,600 64,000 Extremely Low, 30% 13,450 15,400 17,300 19,200 Annual Very Low, 50% 22,400 25,600 28,800 32,000 Low, 80% 35,850 41,000 46,100 51,200 Persons in Family Income Limit Category Affordable: <30% 1, , , , Low: <50% Monthly Rent 1, , , , Moderate: >50% >80% Boundaries 2, , , , Workforce: >80% <120 4, , , , Persons in Family Income Limit Requirements % Annual AMI 26,880 30,720 34,560 38,400 Annual Rent < 30% 8,064 9,216 10,368 11,520 Monthly Rent <30% Works Consulted:
12 HOUSING: MARKET-RATE RENTAL Housing - Market Rate Rental Phase I Phase 2 Phase 3 factors Revenue Assumptions Inflation Factor 3% Phase 1 Standard Units Phase 1 Live(Work) Units Phase 2 Standard Units Phase 2 Live(Work Units) Total Units ,102 1,102 1,102 1,102 1,102 1,102 1,102 Buildout in Units 50% ,102 1,102 1,102 1,102 1,102 1,102 Average Unit Size 1,000 1,000 1,000 1,000 1,000 1,000 1,000 1,000 1,000 1,000 Total Square Footage 253, , , ,500 1,102,000 1,102,000 1,102,000 1,102,000 1,102,000 1,102,000 Average Monthly Rent 1,950 1,950 1,950 2,000 2,000 2,000 2,050 2,050 2,050 2,060 Monthly Rent per s.f Cumulative Absorption with Occupancy 95% 240, , , ,275 1,046,900 1,046,900 1,046,900 1,046,900 1,046,900 1,046,900 Revenues 5,804, ,956,990 12,315,700 20,644,758 29,127,457 30,001,280 31,673,852 32,624,067 33,602,789 34,779,707 Annual Operating Expenses 25% 1,451,091 2,989,248 3,078,925 5,161,189 7,281,864 7,500,320 7,918,463 8,156,017 8,400,697 8,694,927 4,353,273 8,967,743 9,236,775 15,483,568 21,845,593 22,500,960 23,755,389 24,468,050 25,202,092 26,084,780 Building & per s.f ,110,500 26,893,815 33,483,887 34,488,404 Infrastructure Costs 2 522, , , ,768 Total 26,632,710 27,431,691 34,153,565 35,178,172 Annual Cash Flow NOI 4,353,273 8,967,743 9,236,775 15,483,568 21,845,593 22,500,960 23,755,389 24,468,050 25,202,092 26,084,780 Asset Value 8% 112,096, ,459, ,544, ,069, ,262, ,942, ,850, ,026, ,059,749 Cost of Sale 2% 2,241,936 2,309,194 3,870,892 5,461,398 5,625,240 5,938,847 6,117,013 6,300,523 6,521,195 Net Cash Flow (22,279,437) (18,463,949) 9,236,775 (18,669,996) (13,332,579) 22,500,960 23,755,389 24,468,050 25,202,092 26,084,780 Net Present Value Rental 12% 2,046,850 Rental Unleveraged IRR Before Taxes 13% Market-Rate Rental Housing Assumptions 80% 80% Average Unit Possible Block Type Area Rentable Area Market Price Area Size Units Actual Units Square Footage 1A Residential 150, ,000 96,000 1, ,000 2D Residential 347, , ,592 1, , Residential 133, ,986 85,588 1, , Micro-Live(Work) 4,000 4,000 4,000 1, , Residential 157, , ,864 1, ,000 PHASE 1 793, , , ,000 Average Unit Possible Block Type Area Rentable Area Market Price Area Size Units Actual Units Square Footage 3 Residential 375, , ,256 1, ,000 4 Residential 225, , ,256 1, ,000 4 Micro-Live(Work) 4,000 4,000 4,000 1, ,000 5 Residential 223, , ,232 1, ,000 5 Micro-Live(Work) 5,000 5,000 5,000 1, ,000 6A Residential 85,700 68,560 54,848 1, ,000 6A Micro-Live(Work) 5,000 5,000 5,000 1, ,000 PHASE 2 924, , , ,000 12
13 HOUSING: AFFORDABLE RENTAL Housing - Affordable Rate Rental Uptown Nashville Phase I Phase 2 Phase 3 factors Revenue Assumptions Inflation Factor 3% Phase 1 Standard Units Phase 1 Live(Work) Units Phase 2 Standard Units Phase 2 Live(Work) Units Total Units Buildout in Units 50% Average Unit Size Total Square Footage 62, , , , , , , , , ,550 Average Monthly Rent Monthly Rent per s.f Cumulative Absorption with Occupancy Factor 95% 59, , , , , , , , , ,823 Revenues 738,572 1,521,458 1,567,102 2,719,488 3,841,811 3,957,065 4,302,209 4,431,276 4,564,214 4,701,140 Annual Operating Expenses 25% 184, , , , , ,266 1,075,552 1,107,819 1,141,054 1,175, ,929 1,141,093 1,175,326 2,039,616 2,881,358 2,967,799 3,226,657 3,323,457 3,423,161 3,525,855 Affordable Rental 85 5,506,895 5,672,102 7,115,326 7,328,786 Infrastructure Costs 2 129, , , ,442 Total 5,636,469 5,805,563 7,282,745 7,501,228 Annual Cash Flow NOI 553,929 1,141,093 1,175,326 2,039,616 2,881,358 2,967,799 3,226,657 3,323,457 3,423,161 3,525,855 Asset Value 8% 44,073,192 Cost of Sale 2% 881,464 Net Cash Flow (5,082,540) (4,664,470) 1,175,326 (5,243,129) (4,619,869) 2,967,799 3,226,657 3,323,457 3,423,161 3,525,855 Net Present Value Rental 12% 11,847,100 Rental Unleveraged IRR Before Taxes -2% Affordable Rental Housing Assumptions 80% 20% Block Type Area Rentable Area Market Price Area Average Unit Size Possible Units Actual Units Square Footage 1A Residential 150, ,000 24, ,800 2D Residential 347, ,240 55, , Residential 133, , , , Micro-Live(Work) 1,000 1,000 1, , Residential ,650 PHASE 1 790, , , ,950 Average Unit Possible Block Type Area Rentable Area Market Price Area Size Units Actual Units Square Footage 3 Residential 375, ,320 60, ,500 4 Residential 225, ,320 36, ,700 4 Micro-Live(Work) 1,000 1,000 1,000 1, ,000 5 Residential 223, ,040 35, ,700 5 Micro-Live(Work) 2,000 2,000 2,000 1, ,000 6A Residential 85,700 68,560 13, ,600 6A Micro-Live(Work) 2,000 2,000 2,000 1, ,000 PHASE 2 915, , , ,500 13
14 MARKET & LUXURY SALE HOUSING Housing - Market & Luxury For-Sale Uptown Nashville factors Revenue Assumptions Inflation Factor 3% Standard Market Rate Units Live(Work) Units Luxury Townhouses Total Units Revenue Assumptions Market-Rate Buildout in Units 25% Average Unit Size 1,000 1,000 1,000 1,000 Total Square Footage Sold Each Year 198, , , ,250 Number of Units Sold Each Year Market-Rate Sale Price per SF Revenues 42,668,936 43,949,005 51,734,257 53,286,284 Costs of Sale 7% 2,986,826 3,076,430 3,621,398 3,730,040 NOI Market-Rate 39,682,111 40,872,574 48,112,859 49,556,245 Revenue Assumptions Luxury Average Unit Size 2,400 2,400 2,400 2,400 Total Square Footage Sold Each Year 23,400 23,400 23,400 23,400 Number of Units Sold Each Year Luxury Sale Price per SF Revenues 6,475,286 6,669,544 7,632,923 7,861,911 Costs of Sale 7% 453, , , ,334 NOI Luxury 6,022,016 6,202,676 7,098,619 7,311,577 Total 45,704,127 47,075,251 55,211,477 56,867,822 Market ,354,262 36,414,889 37,507,336 38,632,556 Luxury 175 5,036,333 5,187,423 5,343,046 5,503,338 Market Rate Infrastructure Costs 3 731, , , ,294 Luxury Infrastructure Costs 3 86,337 88,927 91,595 94,343 Total 41,208,400 42,444,652 43,717,991 45,029,531 Net Cash Flow 4,495,727 4,630,599 11,493,486 11,838,291 Net Present Value Sale 12% 7,705,527 Market & Luxury Sale Housing Assumptions 80% 90% Average Rentable Market Price Unit Possible Block Type Area Area Area Size Units Actual Units Square Footage 6B Standard Residential ,000 6D Standard Residential ,000 7A Standard Residential ,000 7C Standard Residential ,000 8A Standard Residential ,000 8C Standard Residential ,000 9A Standard Residential ,000 9C Standard Residential ,000 Standard Residential Total 1,101, , ,100 8, ,000 7C Micro-Live(Work) ,000 9C Micro-Live(Work) ,000 Micro-Live(Work) Total 12,000 12,000 12,000 2, ,000 6B Luxury Townhouses ,000 6D Luxury Townhouses ,000 7A Luxury Townhouses ,600 7C Luxury Townhouses ,000 8A Luxury Townhouses ,000 9A Luxury Townhouses ,000 9C Luxury Townhouses ,000 Luxury Townhouse Total 93,600 93,600 93,600 16, ,600 Phase 3 Totals 1,207, , ,700 26, ,600 14
15 WORKFORCE SALE HOUSING Housing - Workforce For-Sale Housing - Workforce For-Sale factors Revenue Assumptions 0 Phase I Phase II Phase III Inflation Factor factors 3% Standard Units Revenue Assumptions Live(Work) Units Inflation Factor 3% Townhouses Standard Units Total Units Live(Work) Units Buildout in Units Townhouses Average Total Unit Units Size 1, , , , Total Square Footage Buildout Sold Each in Units Year 25% 24,000 24,000 25, ,000 Number of Units Average Sold Each Unit Year Size 1, , , , Total Square Footage Sale Sold Price Each per Year SF 25% 24, , , , Net Number Operating of Units Income Sold Each Year Sale Price Revenues per SF 4,427, ,560, ,892, ,039, Costs of Sale 7% 309, , , ,778 Revenues 4,117,618 4,427,546 4,241,146 4,560,372 4,550,396 4,892,899 4,686,908 5,039,686 Costs of Sale Net Operating Development Income Costs 7% ,928 4,117,618 3,689, ,226 3,800,310 4,241, ,503 4,077,416 4,550, ,778 4,199,739 4,686, ,034 60,805 65,239 67,196 Total 3,748,656 3,861,115 4,142,655 4,266, ,689,622 3,800,310 4,077,416 4,199,739 Net Cash Flow 368, , , , ,034 60,805 65,239 67,196 Net Total Present Development Value Costs 12% 632,389 3,748,656 3,861,115 4,142,655 4,266,935 Net Cash Flow 368, , , ,974 Net Present Value 12% 632,389 Affordable Sale Housing Assumptions 80% 10% Possible Actual Rentable Workforce Average Unit Number of Number of Square Affordable Sale Housing Assumptions 80% 10% Block Type Area Area Price Area Size Units Units Footage Possible Actual 6B Standard Residential 168, ,760 13,476 1, ,000 Rentable Workforce Average Unit Number of Number of Square 6D Standard Residential 132, ,080 10,608 1, ,000 Block Type Area Area Price Area Size Units Units Footage 7A Standard Residential 156, ,800 12,480 1, ,000 6B Standard Residential 168, ,760 13,476 1, ,000 8A Standard Residential 211, ,320 16,932 1, ,000 6D Standard Residential 132, ,080 10,608 1, ,000 8C Standard Residential 181, ,440 14,544 1, ,000 7A Standard Residential 156, ,800 12,480 1, ,000 9A Standard Residential 156, ,800 12,480 1, ,000 8A Standard Residential 211, ,320 16,932 1, ,000 9C Standard Residential 136, ,200 10,920 1, ,000 8C Standard Residential 181, ,440 14,544 1, ,000 Standard Residential Total 1,143, ,400 91,440 7, ,000 9A Standard Residential 156, ,800 12,480 1, ,000 7C Micro-Live(Work) 2,000 2,000 2,000 1, ,000 9C Standard Residential 136, ,200 10,920 1, ,000 9C Micro-Live(Work) 2,000 2,000 2,000 1, ,000 Standard Residential Total 1,143, ,400 91,440 7, ,000 Micro-Live(Work) Total 4,000 4,000 4,000 2, ,000 7C Micro-Live(Work) 2,000 2,000 2,000 1, ,000 6B Luxury Townhouses 2,400 2,400 2,400 2, ,400 9C Micro-Live(Work) 2,000 2,000 2,000 1, ,000 6D Luxury Townhouses 2,400 2,400 2,400 2, ,400 Micro-Live(Work) Total 4,000 4,000 4,000 2, ,000 7A Luxury Townhouses 2,400 2,400 2,400 2,400 2,400 6B Luxury Townhouses 2,400 2,400 2,400 2, ,400 7C Luxury Townhouses 2,400 2,400 2,400 2,400 2,400 6D Luxury Townhouses 2,400 2,400 2,400 2, ,400 8A Luxury Townhouses 2,400 2,400 2,400 2,400 2,400 7A Luxury Townhouses 2,400 2,400 2,400 2, ,400 9A Luxury Townhouses 2,400 2,400 2,400 2,400 2,400 7C Luxury Townhouses 2,400 2,400 2,400 2, ,400 9C Luxury Townhouses 2,400 2,400 2,400 2,400 2,400 8A Luxury Townhouses 2,400 2,400 2,400 2, ,400 Luxury Townhouse Total 16,800 16,800 16,800 16, ,800 9A Luxury Townhouses 2,400 2,400 2,400 2, ,400 9C Luxury Townhouses Phase III Totals 1,163,800 2, ,200 2, ,240 2,400 25,800 2, ,800 2,400 Luxury Townhouse Total 16,800 16,800 16,800 16, ,800 Phase III Totals 1,163, , ,240 25, ,800 15
GREENHEART VILLAGE. growing an adaptive community
 GREENHEART VILLAGE growing an adaptive community 2013 ULI Hines Student Urban Design Competition Team Summary Board 1. Summary Proforma Year 0 Phase I Phase II Phase III 20142015 2016 2017 2018 2019 2020
Retail Acquisition Example
 Property Information Retail Acquisition Example Project Assumptions Acquisition Assumptions Property Name Retail Acquisition Example Project Type Acquisition Location Austin, TX Acquisition Cost $1,800,000
$450,000 $63,425 $39, % PURCHASE PRICE NET OPERATING INCOME ANNUAL CASH FLOW CAP RATE
 Executive Summary Key Property Metrics $450,000 $63,425 $39,143 14.1% PURCHASE PRICE NET OPERATING INCOME ANNUAL CASH FLOW CAP RATE $70,000 $60,000 $50,000 $40,000 $30,000 Annual Cash Flow Repairs, 8%
UNDERSTANDING THE DEVELOPMENT PRO FORMA
 UNDERSTANDING THE DEVELOPMENT PRO FORMA March 16, 2017 ULI Urban Leadership Program Dr. Steven Webber Ryerson University/Urbanformation Consulting Pro forma Financial analysis based on Revenues Costs Return
Baric Lawndale S. Karlov St Chicago, IL Buildings. 115 Total Units. Rehabbed Buildings with all Separate Mechanicals
 For more information contact: MIC PROPERTIES micproperties@gmail.com 8 Buildings. 115 Total Units Rehabbed Buildings with all Separate Mechanicals Large Units with an Attractive Mix (86-3BR and 29-2BR)
UNIT INFORMATION (Complete the yellow-shaded areas) Gross monthly rent per. # of baths
 Gross monthly rent per. # of baths") Project Name: Project #: UNIT INFORMATION (Complete the yellowshaded areas) Residential Finished Sq. Ft. per unit* Gross monthly rent per Less tenant paid Net monthly rent per # of bedrooms per unit #
Project Name: Project #: UNIT INFORMATION (Complete the yellowshaded areas) Residential Finished Sq. Ft. per unit* Gross monthly rent per Less tenant paid Net monthly rent per # of bedrooms per unit #
Village at Parkway Lakes Fourplex Gosling and Kuykendahl Spring, TX 77379
 Property Report Village at Parkway Lakes Fourplex Presented by: Fourplex Investment Group RE/Max Equity 295 West Center Street Provo, UT 84601 FIG is not a company, but a marketing platform. All information
The Neponset 400 Neponset Avenue Boston, MA 02122
 Location, Location, Location Approx 210,000 per day traffic count jfitzgerald@remax.net Phone: (617) 268-5100 Fax: (617) 268-5160 738 E Broadway Boston, MA 02127 www.baystateliving.com Table of Contents
Hollywood Industrial Property 5770 Funston St Hollywood, FL 33023
 Hollywood Industrial Property Amazing investment opportunity 34 tenants, with 33,580 leasable square footage 9.54% Actual Capitalization rate Automotive uses allowed Sponsored By: JOHN DEMARCO, ACP 954-678-8733
4 Unit Investment Property 329 N 2nd St W Missoula, MT 59802
 Property Report 4 Unit Investment Property Presented by: Ink Realty Group 148 South Ave W Missoula, MT 59801 Office: 406-728-8270 Mobile: Fax: 406-728-2315 All data is from sources deemed reliable but
Financing Downtown Projects Using Historic Tax Credits and Other Sources Downtown Institute January 21, 2015 Greg Paxton, Maine Preservation
 Financing Downtown Projects Using Historic Tax Credits and Other Sources Downtown Institute January 21, 2015 Greg Paxton, Maine Preservation Lemont Block, Brunswick Wyler s Outlet (Maine goods) Economic
MG Architects Kimberley Lane Houston, TX For more information contact: Ryan Hartsell Partner
 For more information contact: Partner rhartsell@oxfordcres.com Phone: (713) 647-6400 2900 Weslayan St., Suite 480 Houston, TX 77027 www.oxfordcres.com Table of Contents Real Estate Investment Details...
Real Estate Investment Analysis
 Real Estate Investment Analysis September 17, 2018 SJ Fowler Real estate 474 N 1st Ave #100 Tucson AZ 8718 David Walsh 20-91-1736 dw.sjfowler@gmail.com Property Photos, Main Property Photo Property Photos,
Shawnee Landing TIF Project. City of Shawnee, Kansas. Need For Assistance Analysis
 Shawnee Landing TIF Project City of Shawnee, Kansas Need For Assistance Analysis December 17, 2014 Table of Contents 1 EXECUTIVE SUMMARY... 1 2 PURPOSE... 2 3 THE PROJECT... 3 4 ASSISTANCE REQUEST... 7
Real Estate Investment Analysis
 Real Estate Investment Analysis July 6, 2018 SJ Fowler Real estate 4574 N 1st Ave #0 Tucson AZ 85718 David Walsh 520-591-1736 dw.sjfowler@gmail.com Property Photos, Main Property Photo Property Photos,
ABSOLUTE AUCTION Maple Grove Mobile Home Park
 ABSOLUTE AUCTION Maple Grove Mobile Home Park For more information contact: Commercial Broker Associate ccraig@ccim.net Jim Halfhill, Sr. Halfhill Auction Group Principal Auctioneer +18593385764 halfhill@rhr.com
CRE Proforma Development Project Summary of Before Tax Cash Flows by Year
 CRE Proforma Development Project Input Data Marginal Tax Bracket 25.0% Mortgage LTV 75% Developer Cost of Carry 15.0% Depn Recovery Rate 20.0% Amort Term (Years) 30 Going Out Cap Rate 9.0% Capital Gain
The Village at Centre Point 20-Plex 3547 N Eagle Road Meridian, ID 83646
 Property Report The Village at Centre Point 20-Plex Presented by: RE/MAX Equity/Silvercreek Realty 295 W Center St Suite A/1099 S Wells St #200 Provo/Meridian, UT/ID 84601/83642 Mobile: FIG Disclaimer:
The Village at Centre Point 8-Plex 3547 N Eagle Road Meridian, ID 83646
 Property Report The Village at Centre Point 8-Plex Presented by: RE/MAX Equity/Silvercreek Realty 295 W Center St Suite A/1099 S Wells St #200 Provo/Meridian, UT/ID 84601/83642 Mobile: FIG Disclaimer:
Property Report 1434 NW 92. Presented by:
 Property Report 1434 NW 92 Presented by: Jeff Straka Berkshire Hathaway-Commercial 16301 N. May Avenue Edmond, OK 73012 Office: Mobile: (405)416-4415 This is a pro forma based upon the information the
MECKLENBURG MANOR APARTMENTSs A 51 UNIT MULTI-FAMILY INVESTMENT OPPORTUNITY 719 EAST FERRELL STREET, SOUTH HILL, VIRGINIA 23970
 :: A CBRE RICHMOND MULTI-HOUSING OPPORTUNITY MECKLENBURG MANOR APARTMENTSs A 51 UNIT MULTI-FAMILY INVESTMENT OPPORTUNITY 719 EAST FERRELL STREET, SOUTH HILL, VIRGINIA 23970 Part of the CBRE affiliate network
OFFERING MEMORANDUM FOR INVESTORS LOOKING for a LEGITIMATE 10%+ IRR YIELD
 OFFERING MEMORANDUM FOR INVESTORS LOOKING for a LEGITIMATE 10%+ IRR YIELD Property has years of 100% occupancy with waiting list Av. length of stay about 7 years, some as long as 16, some 2 nd generation
Fully Stabilized 24-Unit Property at 11% Cap Rate!
 Fully Stabilized 24-Unit Property at 11% Cap Rate! To Insert a Picture here, click inside this box with your mouse, then click on "INSERT PIC" button on the right and select the picture 24 Units consisting
ANALYTICS & MANAGEMENT OF MIXED INCOME PROPERTY
 MIXED INCOME PROPERTY CFO FORUM NEIGHBORWORKS AMERICA TRAINING INSTITUTE KANSAS CITY, MISSOURI Presented by Len Tatem (Tatem Consulting LLC) & John Kelley (CNAHS/HRI Cambridge, MA) DEFINING MIXED-INCOME
Clark Bro's Rentals 113 Clark Drive Vidalia, LA 71373
 Property Report Presented by: Matthew J. Galofaro, CCIM 14454 University Ave. Hammond, Louisiana 70401 Office: Mobile: (985) 969-8473 Fax: (985) 542-7760 Disclaimer: All information deemed reliable but
REPORT. DATE ISSUED: December 19, 2014 REPORT NO: HCR Chair and Members of the San Diego Housing Commission For the Agenda of January 16, 2015
 REPORT DATE ISSUED: December 19, 2014 REPORT NO: HCR15-008 ATTENTION: SUBJECT: Chair and Members of the San Diego Housing Commission For the Agenda of January 16, 2015 COUNCIL DISTRICT: 9 REQUESTED ACTION
Basics of Commercial Real Estate Transactions Day Two
 Basics of Commercial Real Estate Transactions Day Two John Rockwell, Partner Energy October 12, 2016 PG&E refers to the Pacific Gas and Electric Company, a subsidiary of PG&E Corporation. 2010 Pacific
Affordable Housing Gap and Economic Analysis
 Affordable Housing Gap and Economic Analysis Town of Chapel Hill April 4, 2017 DAVID PAUL ROSEN & ASSOCIATES D EVELOPMENT, FINANCE AND POLICY ADVISORS Town of Chapel Hill PREPARED FOR: Town of Chapel Hill
Beaumont, TX Erica C. Goss Associate x102
 2305 North Street Beaumont, TX 77702 Erica C. Goss 623539 Associate 409-899-3300 x102 egoss@naiwheeler.com Lee Wheeler, CCIM 467055 President 409-899-3300 lwheeler@naiwheeler.com Lit Corner at North &
MEMORANDUM ADDENDUM. Dan Moye, Economic Development Corporation of Kansas City, Missouri
 MEMORANDUM ADDENDUM TO: FROM: Dan Moye, Economic Development Corporation of Kansas City, Missouri Fran Lefor Rood, SB Friedman Development Advisors Direct: (312) 424-4253; Email: frood@sbfriedman.com DATE:
FOR SALE. $8,900,000 MultiFamily. Batesville, Ar Harrison Street PROPERTY HIGHLIGHTS
 $8,900,000 MultiFamily Batesville, Ar 72501 FOR SALE 4323 Harrison Street PROPERTY HIGHLIGHTS 104 Total Luxury Units 72-2 Bedroom, 2 Bathroom Units 16-3 Bedroom, 2 Bathroom Units 16-1 Bedroom, 1 Bathroom
WEST BEND SALE LEASEBACK OPPORTUNITY
 WEST BEND SALE LEASEBACK OPPORTUNITY 3.65 ACRE PARCEL OF CONTIGUOUS VACANT LAND AVAILABLE OFFERING MEMORANDUM 3014-3020 E Progress Dr West Bend, WI 53095 West Bend Sale Leaseback Opportunity CONTENTS 01
WIREWORKS AT C.O.I.L. Nathanael Greene Developments Tyler T.J. Bausinger, Kiera McCloy, Austin Neri, Joseph Vilotti, Katelyn Tufariello
 WIREWORKS AT C.O.I.L. Nathanael Greene Developments Tyler T.J. Bausinger, Kiera McCloy, Austin Neri, Joseph Vilotti, Katelyn Tufariello I. Introduction & Investment Thesis II. Comprehensive Site Vision
LEX ON PORTLAND 536 East Portland Street, Phoenix, AZ 85004
 MULTI-FAMILY FOR SALE LEX ON PORTLAND 536 East Portland Street, Phoenix, AZ 85004 Sale Price: $4,000,000 Proposed Number Of Units: 103 Price Per Proposed Unit: $38,835 Lot Size: Building Size: Proposed
Royal Apartments Bacon St, San Diego, CA 92107
 , Investment Highlights Seller Financing 20% Down at 5% interest only! 3 Parcels of Land Beautiful Courtyard Laundry Onsite Plenty of Parking Spaces For More Information The Courtney Gabhart Group DRE#
Turnkey Cash Flow th St W Bradenton, FL For more information contact: Nataliia Musick
 For more information contact: nataliiamusick@gmail.com TURNKEY CASH FLOW, Presented by New Shores Real Estate, LLC Price: $749,900 TURNKEY CASH FLOW! Charming 9-unit apartment complex in the heart of Bradenton,
T ECHNICAL M EMORANDUM
 Economic & Planning Systems Real Estate Economics Regional Economics Public Finance Land Use Policy T ECHNICAL M EMORANDUM To: From: Subject: Cc: Margaret Stanzione and Claudia Cappio, City of Oakland
1173 Fortune Boulevard, Shiloh, Illinois Office (618) Fax (618)
 Fax (618)") 6,240 Sq. Ft 2 levels 100% Leased to Long Term Tenants 10.22% CAP Rate based on actual Low Operating Expenses New Roof & Remodeled 1 st Floor Located in Copper Bend Sale: $550,000 ($88.14 per Sq. Ft.)
6,240 Sq. Ft 2 levels 100% Leased to Long Term Tenants 10.22% CAP Rate based on actual Low Operating Expenses New Roof & Remodeled 1 st Floor Located in Copper Bend Sale: $550,000 ($88.14 per Sq. Ft.)
Midstate Office Park
 For more information contact: Managing Director ejordan@northeastpcg.com Drew Kirkland Licensed Associate (857) 990-6802 dkirkland@northeastpcg.com Francis Saenz Investment Associate (857) 990-6803 fsaenz@northeastpcg.com
$450,000 $63,425 $33, % PURCHASE PRICE NET OPERATING INCOME ANNUAL CASH FLOW CAP RATE
 Executive Summary Key Property Metrics $450,000 $63,425 $33,431 14.1% PURCHASE PRICE NET OPERATING INCOME ANNUAL CASH FLOW CAP RATE $60,000 $50,000 $40,000 $30,000 Annual Cash Flow Maintenance & Repairs,
The Silver Building. 519 Campbell Avenue West Haven, CT 06516
 For more information contact: Managing Director ejordan@northeastpcg.com Bradley Balletto Regional Manager 203-307-1574 bballetto@northeastpcg.com Rich Edwards Licensed Associate (203) 307-1577 redwards@northeastpcg.com
7401 PACIFIC BLVD. HUNTINGTON PARK, CA 90255
 OFFERING MEMORANDUM $1,295,000 7401 PACIFIC BLVD. HUNTINGTON PARK, CA 90255 90% FINANCING AVAILABLE STRIP CENTER - MTM TENANCY 1 This Memorandum ( Offering Memorandum ) has been prepared by Brookfield
Financing Solar Projects for Public and Affordable Housing. February 15, 2018
 Financing Solar Projects for Public and Affordable Housing February 15, 2018 Housekeeping Join audio: Choose Mic & Speakers to use VoIP Choose Telephone and dial using the information provided Use the
COLOMA AT CHASE PROFESSIONAL
 COLOMA AT CHASE PROFESSIONAL 10390 Coloma Road Rancho Cordova, CA 95670 For more information contact: dmincher@thevollmancompany.c 01703483 Amy Diedrich Commercial Agent 916-600-1559 ADiedrich@thevollmancompany.
Per EDCKC, the Project qualifies for the higher level of property tax abatement in Years 1-10 as it is located in a continuously distressed area.
 MEMO To: From: Bob Long, Economic Development Corporation of Kansas City, Missouri Lance Dorn, SB Friedman Development Advisors 312.424.4255, ldorn@sbfriedman.com Fran Lefor Rood, SB Friedman Development
Atwater ave Fiscal Year Beginning January 2019
 10-Year After Tax Cash Flow Analysis INITIAL INVESTMENT Purchase Price + Acquisition Costs - 1st Mortgage + Total Loan Fees and Points Initial Investment $949900 $9499 $474950 $4750 $489198 MORTGAGE DATA
Ocean View Mixed Use Building
 For more information contact: Founder & Principal andy@vreg.co Multi-tenant ocean view mixed use building Located in the World Class Marina District Building in excellent condition (newer torch down roof
TABLE OF CONTENTS 1300 E 81ST Street Kansas City, MO 64131
 TABLE OF CONTENTS Real Estate Investment Details... 2 Executive Summary... 3 Property Description... 4 Pro Forma Summary... 5 Cash Flow Analysis... 6 Loan Analysis... 7 Internal Rate of Return Analysis...
Broadway Corridor Framework Plan Pearl District Business Association November 10, 2015
 Broadway Corridor Framework Plan Pearl District Business Association November 10, 2015 Opportunity Central City Growth 2035 ~21,500 new households ~42,500 new jobs USPS Site Redevelopment ~2,400 new households
Historic Preservation Alliance of Arkansas (Preserve Arkansas) Property Assistance Program Application
 Property Assistance Program Application") Historic Preservation Alliance of Arkansas (Preserve Arkansas) Property Assistance Program Application The mission of the Historic Preservation Alliance of Arkansas (Preserve Arkansas) is to work to build
Historic Preservation Alliance of Arkansas (Preserve Arkansas) Property Assistance Program Application The mission of the Historic Preservation Alliance of Arkansas (Preserve Arkansas) is to work to build
Chapter 18. Investors have different required yields Different risk assessment Different opportunity cost of equity
 Decision Making in Real Estate Centers Around Valuation Chapter 18 Investment Decisions: Ratios We examined the concept of market value in Chapters 7 & 8 As noted, professional RE appraisers are often
National Housing Trust Fund. Alissa Ice Missouri Housing Development Commission
 National Housing Trust Fund Alissa Ice Missouri Housing Development Commission Purpose The National Housing Trust Fund (HTF) is a new affordable housing production program that will complement existing
Blakeslee Street Townhomes
 For more information contact: Managing Director ejordan@northeastpcg.com Bradley Balletto Regional Manager (203) 307-1574 bballetto@northeastpcg.com Taylor Perun Senior Associate (203) 307-1576 tperun@northeastpcg.com
Draft Roosevelt Income Restricted Housing Analysis
 APPENDIX F Draft Roosevelt Income Restricted Housing Analysis Prepared for: Presented by: Sound Transit May 5, 2016 C/o Jeff Lehman, KPFF 1601 5th Avenue, Suite1600 Seattle, WA 98101 (206) 622 5822 Jeff.Lehman@kpff.com
Hampton 6 Unit Hampton st Scranton, Pa 18504
 Property Report Hampton 6 Unit Presented by: Ron J. Parasole Jr. 1738 Brick ave Scranton, Pa 18508 Office: Mobile: (570) 903-8969 Fax: (570) 209-7753 www.realestatetools.com 2010-2014 Real Estate Tools
23 ACRES HEART OF THE BAKKEN. Williston, ND. Offering Memorandum Investment Opportunity NNN Leased Highway 2 Frontage Additional Development Land
 Offering Memorandum Investment Opportunity NNN Leased Highway 2 Frontage Additional Development Land Williston, ND 23 ACRES HEART OF THE BAKKEN MATT OLSON - ASSOC. BROKER, CCIM, SIOR Property Resources
Dolex Building Investment
 For more information contact: VP of Investments John@CREfirm.com Jerad Rector President 214-281-8616 Jerad@CREfirm.com Corporate Guaranty Sale/Lease back Absolute NNN lease 5 year term with 2, 5 year options
South Park Apartment Complex
 For more information contact: Founder & Principal andy@vreg.co Brian Suite Director of Operations Broker (808)927-1202 brian@vreg.co Six Unit Apartment Building 6,250 sf Lot Less Than 15 Minutes From Downtown
Pacific Ave Storage Units
 For more information contact: Certified Commercial Broker rroberts@ccim.net Phone: 509-248-9400 Fax: 509-965-9282 5625 Summitview Ave Yakima, WA 98908 www.heritagemoultray.com Real Estate Investment Details
Town of Clinton, Connecticut Action Plan for the Historic Unilever Property and Area. Steering Committee Meeting #5 Implementation Strategies
 Town of Clinton, Connecticut Action Plan for the Historic Unilever Property and Area Steering Committee Meeting #5 Implementation Strategies Wednesday, March 19, 2014 6:30pm Steering Committee Meeting
MEDICAL OFFICE BUILDING
 MEDICAL OFFICE BUILDING Emory Clinic, 3345 Hwy 34, Sharpsburg, GA Exclusively offered by Edify CRE, LLC 2 MEDICAL OFFICE BUILDING Property Summary 3345 Hwy 34, Sharpsburg, GA 30277 Price $1,795,000 Rentable
WEST PALM BEACH HOUSING AUTHORITY
 WEST PALM BEACH HOUSING AUTHORITY 1715 Division Ave West Palm Beach, Florida 33407 (561) 655-8530 FAX (561) 650-7490 REQUEST FOR PROPOSALS FOR PROJECT-BASED ALLOCATION OF UP TO SIXTY (60) NEWLY CONSTRUCTED
Miami Airport Center Warehouse 7500 NW 25th St Unit 2 Miami, FL 33122
 Miami Airport Center Warehouse Strategically located directly off of the Palmetto Express way and less than one mile from Miami International Airport Liberal zoning of IU-2 (heavy industrial) Class A industrial
Pier 70 Feasibility Analysis
 Final Report Pier 70 Feasibility Analysis Prepared for: Port of San Francisco Prepared by: Economic & Planning Systems, Inc. ROMA Design Group February 2010 EPS #17007 This page intentionally left blank
PROJECT FINANCE & APPRAISAL Translating the Value of Regenerative Design into Real Estate Speak. Matt Macko Environmental Building Strategies
 PROJECT FINANCE & APPRAISAL Translating the Value of Regenerative Design into Real Estate Speak Matt Macko Environmental Building Strategies The Developer Role Understand your client! How a developer thinks
Ashland Transit Triangle:
 Ashland Transit Triangle: Strategic Approach to Implementation Fregonese Associates Inc. 12/19/16 Phase I of the Transit Triangle Study Conducted in the Fall of 2015 Tasks Completed: Market analysis Initial
Office/Warehouse NNN. Deerfield Beach, FL Mario Abati. Adam P. Von Romer, CCIM
 NNN Leases Great Location 100% Occupied National Credit Tenant Great Cash Flow Ideal For 1031 Senior Investment Associate avonromer@ccim.net BK575531 Mario Abati Commercial & Investment Specialist 954-816-9836
Greenwich - For Sale
 Greenwich - For Sale PROMINENT RETAIL / COMMERCIAL BUILDING * * POTENTIAL RESIDENTIAL CONVERSION * * 406 EAST PUTNAM AVENUE (US Rte 1) Greenwich (Cos Cob), CT Prominent Route 1 frontage Convenient Cos
INNER LOOP Living and Income Property all in one
 INNER LOOP Living and Income Property all in one St HOUSTON TX 77004 www.kevinrilescommercial.com PRICE REDUCED $475,000 4 Unit Duplex with 2 Apartment Units Near Downtown (TSU/UH) Duplex Units have Central
Frederick St. Apartments
 554 frederick st hagerstown MD 21740 OFFERING MEMORANDUM Frederick St. Apartments Frederick St. Apartments CONTENTS 01 Executive Summary Executive Summary 5 Unit Mix Summary 6 Location Summary 7 02 Property
Dania Beach Multi Family 126 NW 8th Ave Dania Beach, FL 33004
 Dania Beach Multi Family Turn key apartment bulling with full management services in place. Completely renovated property with impact windows and newer roof. 8.07% Cash on Cash return with 30% down payment.
NYS HOME Local Program Small Rental Development Initiative Pro forma Budget Workbook Instructions
 NYS HOME Local Program Small Rental Development Initiative Pro forma Budget Workbook Instructions I. Overview This Excel Workbook consists of 6 worksheets: 1) Project Summary 2) HOME Limits 3) Units &
The Housing Authority of the County of Contra Costa. Subsidy Layering Review Checklist for Low-Income Housing Tax Credit Projects
 The Housing Authority of the County of Contra Costa Subsidy Layering Review Checklist for Low-Income Housing Tax Credit Projects Projection Name: Location: Narrative description of project including: Sources
EXECUTIVE SUMMARY PARTNERSHIP INFORMATION PARTNERSHIP NAME: GENERAL PARTNER: GUARANTOR: PROPERTY INFORMATION
 EXECUTIVE SUMMARY PARTNERSHIP INFORMATION PARTNERSHIP NAME: GENERAL PARTNER: GUARANTOR: PROPERTY INFORMATION PROPERTY NAME: PROPERTY LOCATION: PROPERTY TYPE Rural Urban Suburban CONSTRUCTION TYPE: New
SODO INDUSTRIAL BUILDING
 SODO INDUSTRIAL BUILDING 3628 E Marginal Way S Seattle, WA 98134 For more information contact: PROPERTY HIGHLIGHTS Well maintained warehouse & office space in the heart of Sodo Industrial District 1,734
Analysis of a Troubled Deal. Keith Broadnax Joshua Ghena David Helm Josh White
 Analysis of a Troubled Deal Keith Broadnax Joshua Ghena David Helm Josh White Identifying a Troubled Deal How to Spot and Fix Problem Deals Introduction to Presenters Josh Ghena- Lansing MI Director Special
BANK OF AMERICA PLAZA
 BANK OF AMERICA PLAZA LITTLE ROCK, ARKANSAS High-Rise Office Tower Exceptional Repositioning or Redevelopment Opportunity Little Rock Central Business District EXECUTIVE SUMMARY THE OFFERING CBRE, as exclusive
Marina 87 Developer's Resumes
 , Downtown Des Moines in the Marina District, on-site parking, secure building, tons of amenities, close 200th Link. Walking distance to all major services, restaurants, Waterfront Beach Park, Des Moines
Clark Apartments Clark Tarzana, CA Entitlements for 27 new condos and 68 parking. Waiver to tenant relocation fee from most tenants
 For more information contact: Broker farajkerendian@gmail.com 01022002 Entitlements for 27 new condos and 68 parking Waiver to tenant relocation fee from most tenants 20% rental upside while preparing
HOME Investment Partnership Program Project Development Funds. Application
 City of Spartanburg Neighborhood Services 145 West Broad Street Spartanburg, South Carolina 29306 HOME Investment Partnership Program Project Development Funds Application Applicant Name: Project Name:
General Market Analysis and Highest & Best Use. Learning Objectives
 General Market Analysis and Highest & Best Use Learning Objectives Module & Title Module 1 Real Estate Markets and Analysis Module 2 Types and Levels of Market Analysis Module 3 The Six-Step Process and
FOR SALE Investment Property near Cal Poly
 FOR SALE Investment Property near Cal Poly STEVEN R. BATTAGLIA 805.688.5333 steve@battagliare.com License #01318215 284 E Foothill Blvd San Luis Obispo, CA Investment property near Cal Poly. Older residential
Upper Lakeshore Mobile Home Park
 For more information contact: Certified Commerical Broker/Owner rroberts@ccim.net $1,295,000 New Asking Price $155,000 PRICE REDUCTION HUGE VALUE ADD PROPERTY MOTIVATED SELLER Phone: 509-248-9400 Fax:
North Seattle College RES 217 Session 5. Market Feasibility and Financial Analysis
 North Seattle College RES 217 Session 5 Market Feasibility and Financial Analysis Preliminary Analysis Completed Back-of-the-Envelope Analysis (aka, Back-of-the-Napkin) Main advantage to back-of-the envelope
DALLAS MIDTOWN PROJECT THE NEW CENTER OF DALLAS THE NEW CENTER OF DALLAS
 DALLAS MIDTOWN PROJECT THE NEW CENTER OF DALLAS LIVELY, DIVERSE, INTENSE CITIES CONTAIN THE SEEDS OF THEIR OWN REGENERATION. - JANE JACOBS OBJECTIVES - PROJECT GOALS - SUBJECT PROPERTY - DEVELOPMENT PLAN
Offering Memorandum 22 Elm Street, Worcester, Massachusetts Investment/Redevelopment Opportunity $1,400,000.00
 FIRST CLASS OFFICE BUILDING FOR SALE Executive Summary As exclusive sales agent, Kelleher & Sadowsky Associates, Inc. would like to introduce 22 Elm Street in Worcester, Massachusetts, a ±44,782 square
Offering Memorandum N 3RD ST Philadelphia, PA 19123
 Offering Memorandum Philadelphia, PA 19123 1 N O N - E N D O R S E M E N T A N D D I S C L A I M E R N O T I C E Non-Endorsements Marcus & Millichap is not affiliated with, sponsored by, or endorsed by
OFFERING MEMORANDUM. 627 MAGNOLIA AVENUE Long Beach, California. Offering Memorandum 1
 OFFERING MEMORANDUM 627 MAGNOLIA AVENUE Long Beach, California Offering Memorandum 1 PROPERTY OVERVIEW Price $3,500,000 ($398.34/SF) Rentable SF 9,300 SF* Assessor SF 8,788 SF* APN 7272-024-115 Price/RSF
THE POTENTIAL OF INFILL TRANSIT-ORIENTED DEVELOPMENT IN LEBANON, TENNESSEE
 THE POTENTIAL OF INFILL TRANSIT-ORIENTED DEVELOPMENT IN LEBANON, TENNESSEE T.K. Davis FAIA University of Tennessee College of Architecture and Design Thomas McDaniel Vanderbilt University Owen School of
CHAPTER V: IMPLEMENTING THE PLAN
 CHAPTER V: IMPLEMENTING THE PLAN A range of resources is available to fund the improvements included in the Action Plan. These resources include existing commitments of County funding, redevelopment-related
Cap Rate Trends, Methodology and Analysis. Dane R. Anderson MAI, CCIM Appraisal & Litigation Services Director
 Cap Rate Trends, Methodology and Analysis Dane R. Anderson MAI, CCIM Appraisal & Litigation Services Director 1 Quickly The Income Approach Basis of the Approach Present worth of future benefits Two Methods:
Village Street Multifamily
 For more information contact: Managing Director ejordan@northeastpcg.com Drew Kirkland Senior Associate (857) 990-6802 dkirkland@northeastpcg.com Francis Saenz Licensed Associate (857) 990-6803 fsaenz@northeastpcg.com
Hoffman Corners Retail Center II COUNTY ROAD E EAST, VADNAIS HEIGHTS MINNESOTA
 Hoffman Corners Retail Center II 1654-1658 COUNTY ROAD E EAST, VADNAIS HEIGHTS MINNESOTA Mike Brass Vice President Direct 952 837 3054 mike.brass@colliers.com Offering Overview THE OFFERING Colliers International
Presentation Material
 Presentation Material The Transaction of Entering into A 30-Year Land Lease Agreement For Analyst Meeting of Central Pattana Public Company Limited 11 December 2012 Independent Financial Advisor Content
Investit Software Inc. Investor Pro
 Investor Pro Table of Contents Investor Pro...3 Introduction...3 The fastest way to learn Investor Pro...4 Selecting a Template. Which Template should I use?...6 Setting and changing the Starting Date
Greystone Arms San Juan Road, San Diego, CA Brendan Erickson, BTE. Vice President
 , Upgraded Units with Large Square Footage & Contemporary Finishes Throughout Coveted Mission Hills Heritage Park Location Near Recreation, Restaurants, and Shopping New Appliances and Hardwood Floors
EXHIBIT E LOW INCOME HOUSING TAX CREDIT APPLICATION REQUIREMENTS
 EXHIBIT E LOW INCOME HOUSING TAX CREDIT APPLICATION REQUIREMENTS A. Application for Tax Credit Reservation or Tax-Exempt Bond Conditional Commitment shall Include: 1. Complete application form (current
6 Units on 430 N Palos Verdes Street 430 N Palos Verdes Street San Pedro, CA 90731
 6 Units on 430 N Palos Verdes Street Desirable Unit Mix of Four 1-Bedroom and Two 2-Bedroom Units Tremendous Upside in Rental Income as Units Turn Over Property is Separately Metered for Utilities Ample
Investment Summary & Highlights
 Investment Summary & Highlights Financial: New Loan: Analysis Asumptions: Price $ 2,500,000 Price per Sq. Ft. $ 185.19 Contract Rental Income $ 119,549 Gross Operating Income $ 164,226 Total Operating
Understanding the Economics & Financing Structures of Moderately Priced Life Plan Communities
 Understanding the Economics & Financing Structures of Moderately Priced Life Plan Communities 2 Today s Presenters Wayne Olson, Executive Vice President, Volunteers of America National Services Steve Kuhns,