PROPERTY BAROMETER FNB House Price Index Early signs of the positive national sentiment shift impacting on national house price trends
|
|
|
- Darlene Poole
- 5 years ago
- Views:
Transcription


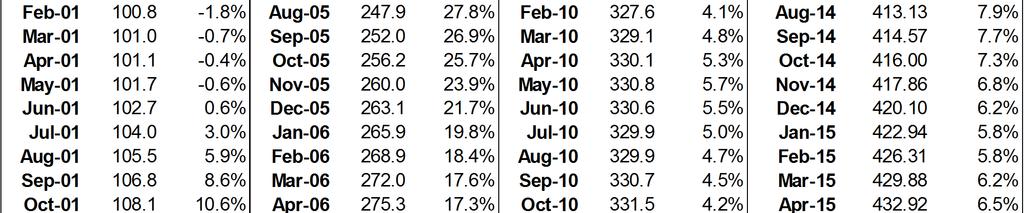
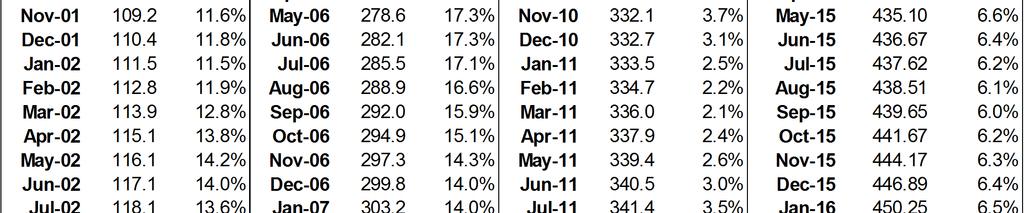
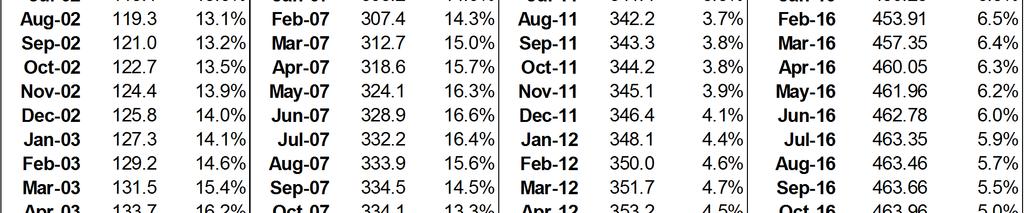
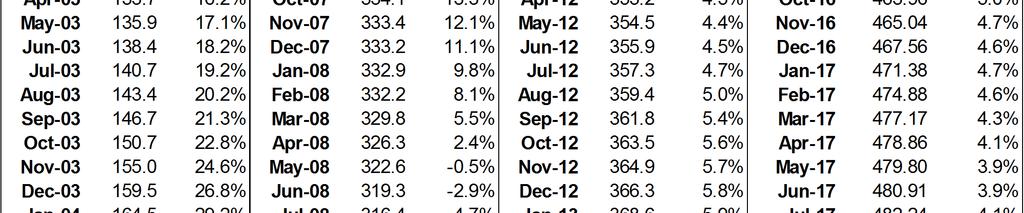
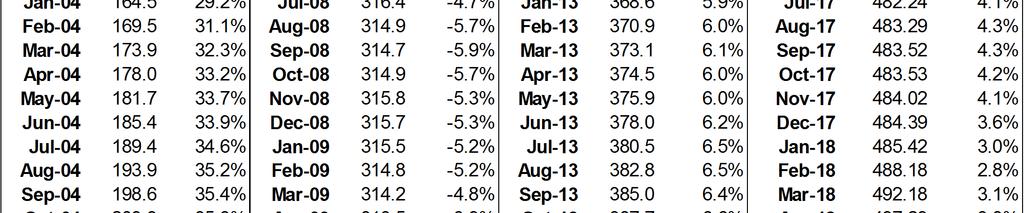
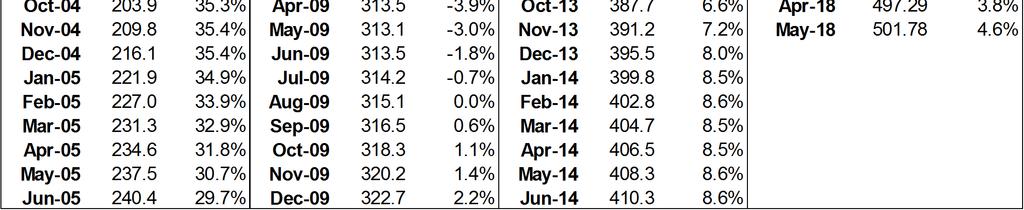
1 5 June 2018 MARKET ANALYTICS AND SCENARIO FORECASTING UNIT JOHN LOOS: HOUSEHOLD AND PROPERTY SECTOR STRATEGIST THULANI LUVUNO: ANALYST ZHARINA FRANCIS: STATISTICIAN The information in this publication is derived from sources which are regarded as accurate and reliable, is of a general nature only, does not constitute advice and may not be applicable to all circumstances. Detailed advice should be obtained in individual cases. No responsibility for any error, omission or loss sustained by any person acting or refraining from acting as a result of this publication is accepted by Firstrand Group Limited and / or the authors of the material. First National Bank a division of FirstRand Bank Limited. An Authorised Financial Services provider. Reg No. 1929/001225/06 PROPERTY BAROMETER FNB House Price Index Early signs of the positive national sentiment shift impacting on national house price trends May 2018 saw the FNB House Price Index growing by a faster 4.6%, year-onyear, up from the previous month s 3.8% in April, and from a February 2018 low of 2.8%. This 3 rd consecutive month of house price growth acceleration is an early sign that significantly improved sentiment in South Africa early in 2018 is beginning to impact positively on the housing market and house price growth. The early-2018 market strengthening has also been seen in other non-price FNB indicators, notably the increased FNB Estate Agent Survey s Residential Activity Rating, as well as in a shorter estimated average time of homes on the market prior to sale in the 1 st quarter of this year. A CHANGE IN THE FNB HOUSE PRICE INDEX After careful consideration, we have changed, from using the FNB Stratified Mean House Price Index as our main index, to using the FNB Repeat Sales House Price Index as our new primary index. The reasoning is that, after certain system and dataset migrations and mergers within FNB, the concern is that there may be structural changes in the data when using the average price approach. Such issues can never be entirely avoided, but we feel they would be minimized using the Repeat Sales Methodology in which unique homes prices are only compared with the same home s previous transaction value. Unlike the deeds office dataset, the FNB valuations dataset can avoid commercial properties, while also avoiding including initial social housing registrations (often registered at the deeds office at non-market related values), which could significantly distort the repeat sales picture. Admittedly, though, even though the Repeat Sales methodology attempts to compare apples with apples by comparing each unique home with its own previous value, one can never hope to entirely eliminate the impact of alterations and upgrades on a home s value between 2 transactions. The FNB Repeat Sales House Price Index has been one of our repertoire of national house price indices for some years, and is based on the well-known Case-Shiller methodology as used to compile the Standard & Poor s Case- Shiller Home Price Indices in the United States. We will continue to compile our repertoire of National FNB House Price Indices, including the Stratified Mean, Stratified Median, Simple Mean and Simple Median, Hedonic and our FNB Long History Repeat Sales Index compiled from deeds data and dating back to But the monthly FNB Repeat Sales House Price Index now becomes the favoured index, and will be published monthly.


2 FNB HOUSE PRICE INDEX RESULTS FOR MAY 2018 RENEWED ACCELERATION In recent years, the FNB House Price Index underwent a broad multi-year slowdown in yearon-year growth, all the way from an 8.6% high as at May 2014 to a lowly 2.8% by February Initially, rising interest rates from January 2014 to January 2016 were seen as the key cause of slowing growth. Thereafter, very weak economic growth arguably played the key role, and by 2017 very weak domestic Consumer Confidence, possibly inspired by adverse political conditions at the time. But sentiment appeared to turn significantly more positive late in 2017 after a change in leadership in the country s ruling party, followed by an early-2018 change in the country s president. Add to this a mild acceleration in year-on-year economic growth rates as the quarters ticked by in 2017, and a further 25 basis point interest rate cut in the 1 st quarter of 2018, and that should be expected to translate into some form of Housing Market strengthening. Some Housing Market strengthening would thus appear to make sense, given the general environment. Therefore, not surprisingly, we have started to see something of an uptick in year-on-year house price growth in recent months, from that low of 2.8% in February 2018 to 4.6% in May OTHER FNB INDICATORS ALSO POINT TO EARLY-2018 HOUSING MARKET STRENGTHENING While it is too early to draw conclusions regarding any sustained recovery in the housing market, there are other FNB indicators which also pointed to early signs of strengthening early in Strengthening was witnessed in our own FNB Estate Agent Survey, with agents reporting a significant jump in residential market activity in the February 2018 quarterly survey. In the survey, we ask respondents to provide a rating of market activity in their areas, a subjective rating on a scale of 1 to 10. After a broad decline through 2015 to 2017, the 1 st quarter 2018 FNB Activity Rating jumped noticeably from 5.29 in the previous quarter to Even on a seasonally adjusted basis, the jump was the most noticeable in over 3 years, from 5.4 in the prior quarter to 5.79.

3 Further support for the perception of a strengthened Housing Market in the 1 st quarter of 2018 was provided by a shortening in the estimated average time of homes on the market prior to sale, from 17 weeks and 2 days in the final quarter of 2017 to 14 weeks and 1 day, according to the Estate Agent Survey. REAL HOUSE PRICE PERFORMANCE At 4.6% year-on-year, house price growth is near to being positive in real terms, when adjusting for CPI (Consumer Price Index) inflation. Real, year-on-year house price deflation of -0.6% was recorded in April (May CPI data not yet available), with CPI inflation in that month measuring 4.5% year-on-year and house price growth 3.8%. But the May house price growth rate of 4.6% appears to be fast catching up with CPI inflation. Examining the longer run performance of the FNB Repeat Sales House Price Index, we still see it at relatively expensive levels, 90.9% up on the January 2001 pre-boom index level. This is despite significant cumulative correction of -20.1% since the all-time real high reached in August 2007 at the back end of the pre-2008 Housing Bubble. CONCLUSION We remain of the belief that average house price growth will be mildly faster in 2018 as a whole compared to The average price growth rate for 2017 was 4.2% using the FNB Repeat Sales House Price Index, which reflected the 3 rd successive year of average house price growth slowing is expected to be stronger on the back of a further small interest rate reduction as well as leading indicators having pointed towards further strengthening in economic growth as we ve moved into Furthermore, a noticeable improvement in domestic consumer and business sentiment alike, an improvement which is seemingly linked to the recent political leadership changes in the country, can further support housing demand in the near term. We thus expect average house price growth to be in the 5-6% range for 2018 as a whole, which would imply some mildly positive real house price growth given the FNB CPI inflation forecast of 4.9% for the year.
4
5 ADDENDUM - NOTES: Note on The FNB House Price Index: The FNB Repeat Sales House Price Index has been one of our repertoire of national house price indices for some years, and is based on the well-known Case-Shiller methodology which is used to compile the Standard & Poor s Case-Shiller Home Price Indices in the United States. This repeat sales approach is based on measuring the rate of change in the prices of individual houses between 2 points in time, based on when the individual homes are transacted. This means that each house price in any month s sample is compared with its own previous transaction value. The various price inflation rates of individual homes are then utilized to compile the average price inflation rate of the index over time. The index is compiled from FNB s own valuations database, thus based on the residential properties financed by FNB over the past 18 years. We apply certain filters and cut-offs to eliminate outliers in the data. They main ones are as follows: The maximum price cut-off is R15m, and the lower price cut-off is R20,000. The top 5% of repeat sales price growth rates, and the bottom 5% of growth rates are excluded from the data set. Repeat transactions that took place longer than 10 years after the previous transaction on the same home are excluded, as are repeat transactions that took place less than 6 months after the previous transaction on the same home. The index is very lightly smoothed using a Hodrick-Prescott smoothing function with a Lambda of 5.
2 July 2018 FNB HOUSE PRICE INDEX RESULTS FOR JUNE 2018 ACCELERATION, BUT FOR HOW LONG?
 2 July 2018 MARKET ANALYTICS AND SCENARIO FORECASTING UNIT JOHN LOOS: HOUSEHOLD AND PROPERTY SECTOR STRATEGIST 087-328 0151 john.loos@fnb.co.za THULANI LUVUNO: ANALYST 087-730 2254 thulani.luvuno@fnb.co.za
1 February FNB House Price Index - Real and Nominal Growth
 1 February 2017 MARKET ANALYTICS AND SCENARIO FORECASTING UNIT JOHN LOOS: HOUSEHOLD AND PROPERTY SECTOR STRATEGIST 087-328 0151 john.loos@fnb.co.za THEO SWANEPOEL: PROPERTY MARKET ANALYST 087-328 0157
PROPERTY BAROMETER FNB Mining Towns House Price Indices
 PROPERTY BAROMETER FNB Mining Towns House Price Indices A return to positive growth in Mining production from the latter stages of 2016 and into 2017 appears to be providing some improved support to Mining
16 April 2018 KEY POINTS
 16 April 2018 MARKET ANALYTICS AND SCENARIO FORECASTING UNIT JOHN LOOS: HOUSEHOLD AND PROPERTY SECTOR STRATEGIST FNB HOME LOANS 087-328 0151 john.loos@fnb.co.za THULANI LUVUNO: STATISTICIAN 087-730 2254
PROPERTY BAROMETER FNB House Price Index Year-on-year house price growth appears to be approaching a mini-peak, at 4.
 2 October 2017 MARKET ANALYTICS AND SCENARIO FORECASTING UNIT JOHN LOOS: HOUSEHOLD AND PROPERTY SECTOR STRATEGIST 087-328 0151 john.loos@fnb.co.za LIZE ERASMUS: STATISTICIAN 087-335 6664 lize.erasmus@fnb.co.za
1 June FNB House Price Index - Real and Nominal Growth MAY FNB HOUSE PRICE INDEX FINDINGS
 1 June 2016 MARKET ANALYTICS AND SCENARIO FORECASTING UNIT JOHN LOOS: HOUSEHOLD AND PROPERTY SECTOR STRATEGIST 087-328 0151 john.loos@fnb.co.za THEO SWANEPOEL: PROPERTY MARKET ANALYST 087-328 0157 tswanepoel@fnb.co.za
PROPERTY BAROMETER FNB Area Value Band House Price Indices
 PROPERTY BAROMETER FNB Area Value Band House Price Indices The Luxury Area Value Band has seen the most noticeable price growth slowdown since 2014, while the Lower End has done a little better of late.
6 April 2018 KEY POINTS
 6 April 2018 MARKET ANALYTICS AND SCENARIO FORECASTING UNIT JOHN LOOS: HOUSEHOLD AND PROPERTY SECTOR STRATEGIST 087-328 0151 john.loos@fnb.co.za THULANI LUVUNO: STATISTICIAN 087-730 2254 thulani.luvuno@fnb.co.za
14 September 2015 MARKET ANALYTICS AND SCENARIO FORECASTING UNIT. JOHN LOOS: HOUSEHOLD AND PROPERTY SECTOR STRATEGIST
 14 September 2015 MARKET ANALYTICS AND SCENARIO FORECASTING UNIT JOHN LOOS: HOUSEHOLD AND PROPERTY SECTOR STRATEGIST 087-328 0151 john.loos@fnb.co.za THEO SWANEPOEL: PROPERTY MARKET ANALYST 087-328 0157
PROPERTY BAROMETER Residential Property Affordability Review The recently improving Housing Affordability trend stalled in the 1 st quarter of 2017
 21 June 2017 MARKET ANALYTICS AND SCENARIO FORECASTING UNIT JOHN LOOS: HOUSEHOLD AND PROPERTY SECTOR STRATEGIST FNB HOME LOANS 087-328 0151 john.loos@fnb.co.za LIZE ERASMUS: STATISTICIAN 087-335 6664 lize.erasmus@@fnb.co.za
3 November rd QUARTER FNB SEGMENT HOUSE PRICE REVIEW. Affordability of housing
 3 November 2011 3 rd QUARTER FNB SEGMENT HOUSE PRICE REVIEW JOHN LOOS: HOUSEHOLD AND PROPERTY SECTOR STRATEGIST 011-6490125 John.loos@fnb.co.za EWALD KELLERMAN: PROPERTY MARKET ANALYST 011-6320021 ekellerman@fnb.co.za
3 October 2017 KEY POINTS
 3 October 2017 FNB HOME LOANS: MARKET ANALYTICS AND SCENARIO FORECASTING UNIT JOHN LOOS: HOUSEHOLD AND PROPERTY SECTOR STRATEGIST 087-328 0151 John.loos@fnb.co.za THEO SWANEPOEL: PROPERTY MARKET ANALYST
FNB-TPN RESIDENTIAL YIELDS REVIEW
 FNB-TPN RESIDENTIAL YIELDS REVIEW 17 November 2015 John Loos, Household and Property Sector Strategist Tel: (087) 328 0151 Cell:083-453 8096 E-mail: john.loos@fnb.co.za Website: http://blog.fnb.co.za/category/economics/
Smoothed Weighted National Housing Index (base = January 2008)
") HOUSING INDEX April 2013 Moderating House Prices 1 1 1 120 Smoothed Weighted National Housing Index (base = January 8) 174.2 119.9 Value Index Volume Index The FNB House Price Index regained some lost
HOUSING INDEX April 2013 Moderating House Prices 1 1 1 120 Smoothed Weighted National Housing Index (base = January 8) 174.2 119.9 Value Index Volume Index The FNB House Price Index regained some lost
Connecticut First Nine Months Housing Report 2014
 Connecticut First Nine Months Housing Report 2014 First Nine Months of 2014 Highlight Positive Outlook for Multi-family Home Construction Millennial buyers are finally increasing their rate of household
Smoothed Weighted National Housing Index (base = January 2008)
") HOUSING INDEX January 2014 Rising Volumes Decelerate House Prices For Now 220 200 180 160 1 120 100 80 60 Smoothed Weighted National Housing Index (base = January 2008) Value Index Volume Index Although
HOUSING INDEX January 2014 Rising Volumes Decelerate House Prices For Now 220 200 180 160 1 120 100 80 60 Smoothed Weighted National Housing Index (base = January 2008) Value Index Volume Index Although
REAL ESTATE SENTIMENT INDEX 2 nd Quarter 2018
 About Real Estate Sentiment Index (RESI) The Real Estate Sentiment Index (RESI) is jointly developed by the Real Estate Developers Association of Singapore (REDAS) and the Department of Real Estate (DRE),
Smoothed Weighted National Housing Index (base = January 2008)
") HOUSING INDEX February 2013 House Prices Remain Stubbornly High 1 1 1 120 Smoothed Weighted National Housing Index (base = January 8) 178.6 102.2 Value Index Volume Index The FNB House Price Index fell
HOUSING INDEX February 2013 House Prices Remain Stubbornly High 1 1 1 120 Smoothed Weighted National Housing Index (base = January 8) 178.6 102.2 Value Index Volume Index The FNB House Price Index fell
Smoothed Weighted National Housing Index (base = January 2008)
") HOUSING INDEX May 2013 Decelerating Real House Prices 1 1 1 120 Smoothed Weighted National Housing Index (base = January 8) 1.2 107.0 Value Index Volume Index The FNB House Price Index regained some lost
HOUSING INDEX May 2013 Decelerating Real House Prices 1 1 1 120 Smoothed Weighted National Housing Index (base = January 8) 1.2 107.0 Value Index Volume Index The FNB House Price Index regained some lost
Estimating National Levels of Home Improvement and Repair Spending by Rental Property Owners
 Joint Center for Housing Studies Harvard University Estimating National Levels of Home Improvement and Repair Spending by Rental Property Owners Abbe Will October 2010 N10-2 2010 by Abbe Will. All rights
CoStar Commercial Repeat Sales Indices (CCRSI)
") CoStar Commercial Repeat Sales Indices (CCRSI) Copyright 2011 CoStar Group, Inc. All Rights Reserved. This news release includes "forward-looking statements" including, without limitation, statements regarding
CoStar Commercial Repeat Sales Indices (CCRSI) Copyright 2011 CoStar Group, Inc. All Rights Reserved. This news release includes "forward-looking statements" including, without limitation, statements regarding
An Introduction to RPX INTRODUCTION
 An Introduction to RPX INTRODUCTION Radar Logic is a real estate information company based in New York. We convert public residential closing data into information about the state and prospects for the
MANHATTAN MARKET REPORT
 MANHATTAN MARKET REPORT Q1 MANHATTAN MARKET REPORT 1Q 2017 Manhattan s residential market is showing signs of improvement after a period of uncertainty leading up to the Presidential election, as it does
Residential building statistics 15 February 2018
 Compiled by Jacques du Toit Property Analyst Absa Home Loans 15 Troye Street Johannesburg 21 PO Box 7735 Johannesburg 2 South Africa Tel +27 ()11 35 7246 jacques@absa.co.za www.absa.co.za Explanatory note:
Quarterly Review The Australian Residential Property Market and Economy
 Quarterly Review The Australian Residential Property Released January 2018 Contents Introduction 3 Housing Market 4 Mortgage Lending 11 Housing Supply 17 Demographic Overview 20 Household Finances 22 National
Smoothed Weighted National Housing Index (base = January 2008)
") HOUSING INDEX November 2012 New Housing Supply Soften House Prices 200 180 160 140 120 100 80 Smoothed Weighted National Housing Index (base = January 2008) 164.1 143.0 60 40 Value Index Volume Index Data
HOUSING INDEX November 2012 New Housing Supply Soften House Prices 200 180 160 140 120 100 80 Smoothed Weighted National Housing Index (base = January 2008) 164.1 143.0 60 40 Value Index Volume Index Data
The OeNB property market monitor of April 2015: Residential property price growth in Austria slowed down markedly in the second half of 2014
 The OeNB property market monitor of April : Residential property price growth in slowed down markedly in the second half of Martin Schneider, Karin Wagner, Walter Waschiczek Residential property price
THE REAL ESTATE BOARD OF NEW YORK
 THE REAL ESTATE BOARD OF NEW YORK REAL ESTATE BROKER CONFIDENCE INDEX FIRST QUARTER 2018 EXECUTIVE SUMMARY The Real Estate Board of New York s (REBNY) Real Estate Broker Index for the first quarter of
Domain.com.au House Price Report December Quarter 2015
 Domain.com.au House Price Report December Quarter 2015 Dr Andrew Wilson Senior Economist for Domain.com.au Key findings Record drop in Sydney median house prices over the December quarter Melbourne and
THE REAL ESTATE BOARD OF NEW YORK REAL ESTATE BROKER CONFIDENCE INDEX THIRD QUARTER 2016
 THE REAL ESTATE BOARD OF NEW YORK REAL ESTATE BROKER CONFIDENCE INDEX THIRD QUARTER 2016 EXECUTIVE SUMMARY REAL ESTATE BROKER CONFIDENCE INDEX THIRD QUARTER 2016 The Real Estate Board of New York s (REBNY)
RESIDENTIAL PROPERTY PRICE INDEX (RPPI)
") EUROSYSTEM RESIDENTIAL PROPERTY PRICE INDEX (RPPI) Q3 The Residential Property Price Index continued to recover 1 The RPPI (houses and apartments) increased by 0,4% in Q3 1, its fifth consecutive quarterly
EUROSYSTEM RESIDENTIAL PROPERTY PRICE INDEX (RPPI) Q3 The Residential Property Price Index continued to recover 1 The RPPI (houses and apartments) increased by 0,4% in Q3 1, its fifth consecutive quarterly
Technical Description of the Freddie Mac House Price Index
 Technical Description of the Freddie Mac House Price Index 1. Introduction Freddie Mac publishes the monthly index values of the Freddie Mac House Price Index (FMHPI SM ) each quarter. Index values are
Residential building statistics 17 May 2018
 Compiled by Jacques du Toit Property Analyst Absa Home Loans 15 Troye Street Johannesburg 21 PO Box 7735 Johannesburg 2 South Africa Tel +27 ()11 35 7246 jacques@absa.co.za www.absa.co.za Explanatory note:
FNB PROPERTY BAROMETER
 HOME LOANS DIVISION FNB PROPERTY BAROMETER 4 TH Quarter 2009 - Ending the last decade on a strengthening note, but financial stress and affordability issues are far from over PROPERTY AND MORTGAGE MARKET
Rapid recovery from the Great Recession, buoyed
 Game of Homes The Supply-Demand Struggle Laila Assanie, Sarah Greer, and Luis B. Torres October 4, 2016 Publication 2143 Rapid recovery from the Great Recession, buoyed by the shale oil boom, has fueled
PROPERTY BAROMETER FNB City of Cape Town House Price Indices
 16 February 2018 MARKET ANALYTICS AND SCENARIO FORECASTING UNIT JOHN LOOS: HOUSEHOLD AND PROPERTY SECTOR STRATEGIST 087-328 0151 john.loos@fnb.co.za THULANI LUVUNO STATISTICIAN 087-730 2254 thulani.luvuno@@fnb.co.za
Planning and Development Department Building and Development Permit Summary Report
 Planning and Development Department 21 Building and Development Permit Summary Report February 22, 21 2 21 Building and Development Permit Summary Table of Contents Introduction... 3 Building Permits...
Young-Adult Housing Demand Continues to Slide, But Young Homeowners Experience Vastly Improved Affordability
 Young-Adult Housing Demand Continues to Slide, But Young Homeowners Experience Vastly Improved Affordability September 3, 14 The bad news is that household formation and homeownership among young adults
RESIDENTIAL PROPERTY PRICE INDEX (RPPI)
") EUROSYSTEM RESIDENTIAL PROPERTY PRICE INDEX (RPPI) 2017Q1 Residential property prices continued to increase moderately in 2017Q1 1 The RPPI (houses and apartments) recorded the third consecutive marginal
EUROSYSTEM RESIDENTIAL PROPERTY PRICE INDEX (RPPI) 2017Q1 Residential property prices continued to increase moderately in 2017Q1 1 The RPPI (houses and apartments) recorded the third consecutive marginal
Home Price Monitor August 2012 National Association of REALTORS
 Home Price Monitor August 2012 National Association of REALTORS Research Division Cutting Through the Noise: Various Home Price Measure Highlights Case Shiller data showed the first annual increase in
Commercial Property Price Indices for Greece
 Commercial Property Price Indices for Greece Vasiliki Vlachostergiou, Theodore Mitrakos, Calliope Akantziliotou Real Estate Analysis Section Bank of Greece November 2015 1.1 Bank of Greece - Synopsis of
ANALYSIS OF THE CENTRAL VIRGINIA AREA HOUSING MARKET 1st quarter 2013 By Lisa A. Sturtevant, PhD George Mason University Center for Regional Analysis
 ANALYSIS OF THE CENTRAL VIRGINIA AREA HOUSING MARKET 1st quarter By Lisa A. Sturtevant, PhD George Mason University Center for Regional Analysis Economic Overview Key economic factors in the first quarter
CITI HABITATS. Manhattan Residential Sales Market Report
 Manhattan Residential Sales Market Report Contents 4/7 12/17 3 8 9 10 Market Wide 4 Sales / Days on Market 5 / Months of Supply 6 7 Market Share Resale Co-ops Resale Condos New Developments 11 Luxury Neighborhoods
RESIDENTIAL PROPERTY PRICE INDEX (RPPI)
") EUROSYSTEM RESIDENTIAL PROPERTY PRICE INDEX (RPPI) 2017Q2 Moderate recovery in the Residential Property Price Index 1 The RPPI (houses and apartments) recorded an increase of 0,5% on a quarterly basis
EUROSYSTEM RESIDENTIAL PROPERTY PRICE INDEX (RPPI) 2017Q2 Moderate recovery in the Residential Property Price Index 1 The RPPI (houses and apartments) recorded an increase of 0,5% on a quarterly basis
2015 First Quarter Market Report
 2015 First Quarter Market Report CAAR Member Copy Expanded Edition Charlottesville Area First Quarter 2015 Highlights: Median sales price for the region was up 5.1% over Q1-2014, rising from $244,250 to
Sales Ratio: Alternative Calculation Methods
 For Discussion: Summary of proposals to amend State Board of Equalization sales ratio calculations June 3, 2010 One of the primary purposes of the sales ratio study is to measure how well assessors track
Building Consents Issued: June 2013
 Building Consents Issued: June 2013 Embargoed until 10:45am 30 July 2013 Key facts In June 2013, building consents were issued for: 1,487 new dwellings, including apartments 160 apartments, including 39
Housing market moving into a renewed up-cycle
 214 Housing market moving into a renewed up-cycle The growth in asking prices for property accelerated in the third quarter, up 3.1 per cent on the previous quarter, and 4.7 per cent on a year earlier
Performance of the Private Rental Market in Northern Ireland
 Summary Research Report July - December Performance of the Private Rental Market in Northern Ireland Research Report July - December 1 Northern Ireland Rental Index: Issue No. 8 Disclaimer This report
DATA FOR MAY Published June 23, Sales are up +11.3% month-over-month. The year-over-year comparison shows an increase of +11.1%.
 Permission is granted only to ARMLS Subscribers for reproduction with attribution on to ARMLS COPYRIGHT 2017. For questions regarding this publication contact Brand@ARMLS.com. DATA FOR MAY 2017 - Published
STATISTICAL REFLECTIONS
 STATISTICAL REFLECTIONS 9 November 2018 Contents Summary...1 Changes in property transactions...1 Annual price index...1 Quarterly pure price index...2 Distribution of existing home transactions...2 Regional
NATIONAL ASSOCIATION of REALTORS RESEARCH DIVISION. Prepared for Florida REALTORS
 NATIONAL ASSOCIATION of REALTORS RESEARCH DIVISION Prepared for Florida REALTORS NATIONAL ASSOCIATION OF REALTORS RESEARCH DIVISION Page 1 Page 3 Page 4 Page 6 Page 7 Page 8 Page 9 Page 10 Page 11 Page
DETACHED MULTI-UNIT APPROVALS
 HIA New Home Sales DETACHED MULTI-UNIT APPROVALS SALES MULTI-UNIT DETACHED A monthly update on the sales of new homes December 217 TAX BURDEN TAKES TOLL ON New Home Sales during 217 Sales still post modest
RESIDENTIAL PROPERTY PRICE INDEX (RPPI)
") EUROSYSTEM RESIDENTIAL PROPERTY PRICE INDEX (RPPI) 2016Q1 The stabilisation of residential property prices continued The stabilisation of residential property prices continued with small fluctuations in
EUROSYSTEM RESIDENTIAL PROPERTY PRICE INDEX (RPPI) 2016Q1 The stabilisation of residential property prices continued The stabilisation of residential property prices continued with small fluctuations in
CONSUMER CONFIDENCE AND REAL ESTATE MARKET PERFORMANCE GO HAND-IN-HAND
 CONSUMER CONFIDENCE AND REAL ESTATE MARKET PERFORMANCE GO HAND-IN-HAND The job market, mortgage interest rates and the migration balance are often considered to be the main determinants of real estate
Manhattan condo prices rose to
 Manhattan Market Report Q4 4 by the numbers +.8% StreetEasy Condo Price Index (QuarteroverQuarter) +.4% StreetEasy Condo Price Forecast (MonthoverMonth).7% Total (QuarteroverQuarter) +5.7% Number of Pending
Residential January 2010
 Residential January 2010 Karl L. Guntermann Fred E. Taylor Professor of Real Estate Adam Nowak Research Associate Another improvement to the ASU-RSI is introduced this month with new indices for foreclosure
2019 Housing Market Forecast. Palos Verdes Peninsula AOR January 8, 2019 Jordan G. Levine Senior Economist
 2019 Housing Market Forecast Palos Verdes Peninsula AOR January 8, 2019 Jordan G. Levine Senior Economist Overview Good News: Economic fundamentals solid Homeownership still the dream Rates might not go
Residential August 2009
 Residential August 2009 Karl L. Guntermann Fred E. Taylor Professor of Real Estate Adam Nowak Research Associate Summary The latest data for May 2009 reveals that house prices declined by 33 percent in
Residential January 2009
 Residential January 2009 Karl L. Guntermann Fred E. Taylor Professor of Real Estate Adam Nowak Research Associate Methodology The use of repeat sales is the most reliable way to estimate price changes
RESIDENTIAL PROPERTY PRICE INDEX (RPPI)
") CENTRAL BANK OF CYPRUS EUROSYSTEM RESIDENTIAL PROPERTY PRICE INDEX (RPPI) Q4 The residential property price index is on an upward trend 1 The RPPI (houses and apartments) increased by 0,4% in Q4. Increases
CENTRAL BANK OF CYPRUS EUROSYSTEM RESIDENTIAL PROPERTY PRICE INDEX (RPPI) Q4 The residential property price index is on an upward trend 1 The RPPI (houses and apartments) increased by 0,4% in Q4. Increases
Housing Markets: Balancing Risks and Rewards
 Housing Markets: Balancing Risks and Rewards October 14, 2015 Hites Ahir and Prakash Loungani International Monetary Fund Presentation to the International Housing Association VIEWS EXPRESSED ARE THOSE
L U X U R Y M A R K E T R E P O R T 2 Q
 L U X U R Y M A R K E T R E P O R T 2 Q 2 1 8 The quarterly Luxury Market Report provided by Trump International Realty is a resource compiling pertinent data and analytics to give you a pulse on the current
Housing Price Forecasts. Illinois and Chicago PMSA, May 2018
 Housing Price Forecasts Illinois and Chicago PMSA, May 2018 Presented To Illinois Realtors From R E A L Regional Economics Applications Laboratory, Institute of Government and Public Affairs University
RESIDENTIAL PROPERTY PRICE INDEX (RPPI)
") EUROSYSTEM RESIDENTIAL PROPERTY PRICE INDEX (RPPI) 2018 Q1 The residential property price index is still on an upward trend 1 The RPPI 1 (houses and apartments) increased by 0,6% in 2018Q1. This was the
EUROSYSTEM RESIDENTIAL PROPERTY PRICE INDEX (RPPI) 2018 Q1 The residential property price index is still on an upward trend 1 The RPPI 1 (houses and apartments) increased by 0,6% in 2018Q1. This was the
The Manhattan real estate market
 Manhattan Market Report Q 04 by the numbers +.6% StreetEasy Condo Price Index (QuarteroverQuarter) 0.% StreetEasy Condo Price Forecast (MonthoverMonth) 6.0% Total (QuarteroverQuarter) 6.0% Number of Pending
RESIDENTIAL MARKET ANALYSIS
 RESIDENTIAL MARKET ANALYSIS CLANCY TERRY RMLS Student Fellow Master of Real Estate Development Candidate Oregon and national housing markets both demonstrated shifting trends in the first quarter of 2015
RESIDENTIAL PROPERTY PRICE INDEX
 EUROSYSTEM RESIDENTIAL PROPERTY PRICE INDEX Q4 Main developments in residential property prices during Q4 Residential property prices (houses and apartments) recorded a smaller reduction in the fourth
Cycle Monitor Real Estate Market Cycles Third Quarter 2017 Analysis
 Cycle Monitor Real Estate Market Cycles Third Quarter 2017 Analysis Real Estate Physical Market Cycle Analysis of Five Property Types in 54 Metropolitan Statistical Areas (MSAs). Income-producing real
HOME Survey. Housing Opportunities and Market Experience. June National Association of REALTORS Research Group
 HOME Survey Housing Opportunities and Market Experience June 2018 National Association of REALTORS Research Group Introduction The Housing Opportunities and Market Experience (HOME) report was created
Residential May Karl L. Guntermann Fred E. Taylor Professor of Real Estate. Adam Nowak Research Associate
 Residential May 2008 Karl L. Guntermann Fred E. Taylor Professor of Real Estate Adam Nowak Research Associate The use of repeat sales is the most reliable way to estimate price changes in the housing market
Seattle Housing Market Overview January 2019
 Seattle Housing Market Overview January 2019 A review of recent trends and thoughts about the future of the Seattle housing market. Bill King President, Chief Valuation Officer Real Info, Inc. City of
REAL ESTATE SENTIMENT INDEX 1 st Quarter 2014
 About Real Estate Sentiment Index (RESI) The Real Estate Sentiment Index (RESI) is jointly developed by the Real Estate Developers Association of Singapore (REDAS) and the Department of Real Estate (DRE),
PROPERTY OUTLOOK REPORT 2018
 PROPERTY OUTLOOK REPORT 2018 Table of Contents 1 2 3 4 5 6 7 8 9 10 0Outlook Report 2018 Overview 02017: Year at a Glance PropertyGuru Market Index 2017 Kuala Lumpur Selangor Penang Johor Malaysian Property
Residential December 2009
 Residential December 2009 Karl L. Guntermann Fred E. Taylor Professor of Real Estate Adam Nowak Research Associate Year End Review The dramatic decline in Phoenix house prices caused by an unprecedented
Value of Building Work Put in Place: March 2013 quarter
 Value of Building Work Put in Place: March 2013 quarter Embargoed until 10:45am 05 June 2013 Key facts For the March 2013 quarter, after price changes and seasonal variations are removed: Residential building
The Daft.ie House Price Report
 The Daft.ie House Price Report An analysis of recent trends in the Irish residential sales market for 2018 Introduction by Ronan Lyons, Assistant Professor at Trinity College Dublin and author of the Daft
nd Quarter Market Report
 2015 2 nd Quarter Market Report The voice of real estate in Central Virginia CAAR Member Copy Expanded Edition Charlottesville Area 2 nd Quarter 2015 Highlights: Closed sales in the Greater Charlottesville
Kitchener-Cambridge-Waterloo and Guelph CMAs
 H o u s i n g M a r k e t I n f o r m a t i o n Housing Now Kitchener-Cambridge-Waterloo and Guelph CMAs C a n a d a M o r t g a g e a n d H o u s i n g C o r p o r a t i o n Date Released: Kitchener-Cambridge-Waterloo
Shaping Housing and Community Agendas
 CIH Response to: DCLG Rents for Social Housing from 2015-16 consultation December 2013 Submitted by email to: rentpolicy@communities.gsi.gov.uk This consultation response is one of a series published by
REAL ESTATE SENTIMENT INDEX 1 st Quarter 2016
 About Real Estate Sentiment Index (RESI) The Real Estate Sentiment Index (RESI) is jointly developed by the Real Estate Developers Association of Singapore (REDAS) and the Department of Real Estate (DRE),
Summary Statistics. Closed Sales. Paid in Cash. Median Sale Price. Average Sale Price. Dollar Volume. Median Time to Sale.
 ly Market Detail - Q1 216 Summary Statistics Q1 216 Q1 215 Paid in Cash 57,913 57,742.3% 2,133 23,724-15.1% $23,5 $182, 11.8% Average Sale Price Dollar Volume $285,447 $266,453 7.1% $16.5 Billion $15.4
OFFICE MARKET ANALYSIS:
 OFFICE MARKET ANALYSIS: DAVID WEST RMLS Fellow Certificate of Real Estate Development Student Masters of Urban and Regional Planning Candidate While the Portland office market continues the slow recovery
Economic Highlights. Payroll Employment Growth by State 1. Durable Goods 2. The Conference Board Consumer Confidence Index 3
 August 26, 2009 Economic Highlights Southeastern Employment Payroll Employment Growth by State 1 Manufacturing Durable Goods 2 Consumer Spending The Conference Board Consumer Confidence Index 3 Real Estate
ECONOMIC CURRENTS. Vol. 5 Issue 2 SOUTH FLORIDA ECONOMIC QUARTERLY. Key Findings, 2 nd Quarter, 2015
 ECONOMIC CURRENTS THE Introduction SOUTH FLORIDA ECONOMIC QUARTERLY Economic Currents provides an overview of the South Florida regional economy. The report presents current employment, economic and real
Domain House Price Report March Quarter 2016
 Domain House Price Report March Quarter 2016 Dr Andrew Wilson Chief Economist for Domain Key findings Sydney median house price drops below $1 million House and unit prices are down in Sydney, Brisbane,
Residential September 2010
 Residential September 2010 Karl L. Guntermann Fred E. Taylor Professor of Real Estate Adam Nowak Research Associate For the first time since March, house prices turned down slightly in August (-2 percent)
YOUR LINK TO THE HOUSING MARKET
 H ousing now Gatineau YOUR LINK TO THE HOUSING MARKET www.cmhc.ca Very active third quarter for residential construction Canada Mortgage and Housing Corporation VOLUME 7, EDITION 3 Third Quarter 2 0 0
Residential March 2010
 Residential March 2010 Karl L. Guntermann Fred E. Taylor Professor of Real Estate Adam Nowak Research Associate The latest data for December 2009 reveals that overall house prices declined by 13 percent
Manhattan Rental Market Report Year End 2010
 Manhattan Rental Market Report Year End 2010 Table of Contents Introduction 3 A Quick Look 4 Mean Manhattan Rental Prices 5 Notable Trends 7 Manhattan Price Trends 7 Neighborhood Price Trends Upper West
ARLA Members Survey of the Private Rented Sector
 Prepared for The Association of Residential Letting Agents ARLA Members Survey of the Private Rented Sector Second Quarter 2014 Prepared by: O M Carey Jones 5 Henshaw Lane Yeadon Leeds LS19 7RW June, 2014
Rightmove House Price Index
 Rightmove House Price Index The largest monthly sample of residential property prices September 2018 National edition Under embargo for 00.01 hours, Monday 17 th September 2018 Some positive signs for
2Q2017 L O N G ISLAND CITY
 2Q2017 L O N G ISLAND CITY M A R K E T R E P O R T INTRODUCTION L O N G I S L A N D C I T Y S A L E S R E P O R T Q 2 2 0 1 7 : LONG ISLAND CITY IS THE FASTEST GROWING NEIGHBORHOOD IN THE COUNTRY. The
Has The Office Market Reached A Peak? Vacancy. Rental Rate. Net Absorption. Construction. *Projected $3.65 $3.50 $3.35 $3.20 $3.05 $2.90 $2.
 Research & Forecast Report OAKLAND METROPOLITAN AREA OFFICE Q1 Has The Office Market Reached A Peak? > > Vacancy remained low at 5. > > Net Absorption was positive 8,399 in the first quarter > > Gross
PROPERTY BAROMETER FNB City of Cape Town House Price Indices
 13 November 2017 MARKET ANALYTICS AND SCENARIO FORECASTING UNIT JOHN LOOS: HOUSEHOLD AND PROPERTY SECTOR STRATEGIST 087-328 0151 john.loos@fnb.co.za LIZE ERASMUS STATISTICIAN 087-335 6664 lize.erasmus@@fnb.co.za
Residential Commentary - Perth Apartment Market
 Residential Commentary - Perth Apartment Market March 2016 Executive Summary The Greater Perth apartment market has attracted considerable interest from local and offshore developers. Projects under construction
Nothing Draws a Crowd Like a Crowd: The Outlook for Home Sales
 APRIL 2018 Nothing Draws a Crowd Like a Crowd: The Outlook for Home Sales The U.S. economy posted strong growth with fourth quarter 2017 Real Gross Domestic Product (real GDP) growth revised upwards to
Linkages Between Chinese and Indian Economies and American Real Estate Markets
 Linkages Between Chinese and Indian Economies and American Real Estate Markets Like everything else, the real estate market is affected by global forces. ANTHONY DOWNS IN THE 2004 presidential campaign,
CANADA ECONOMICS FOCUS
 CANADA ECONOMICS FOCUS House prices likely to fall for several years 3 rd Feb. 211 The recent housing boom has resulted in the largest rises in house prices ever seen in Canada, which have been similar
REAL ESTATE BROKER CONFIDENCE INDEX
 REAL ESTATE BROKER CONFIDENCE INDEX FIRST QUARTER 2013 Rob SpeyeR, ChaiRman Steven Spinola, president 570 Lexington Avenue / New York, NY 10022 / 212.532.3100 www.rebny.com EXECUTIVE SUMMARY REAL ESTATE