Montana Trust Land Grazing Lease Rate Valuation Analysis
|
|
|
- Homer Blake
- 5 years ago
- Views:
Transcription

1 Montana Trust Land Grazing Lease Rate Valuation Analysis 4/26/2011 Report Prepared for: State of Montana Department of Natural Resources & Conservation: Trust Management Division Bioeconomics, Inc. Missoula, Montana
2 Table of Contents LIST OF TABLES AND FIGURES... 4 EXECUTIVE SUMMARY... 5 Setting and Objectives... 5 Methods... 7 Data Sources... 8 Summary Results and Conclusions DNRC Montana Base Trust land Grazing Rate Hedonic Model Predicted Rate for typical State Trust Land Leases DNRC Competitively Bid Lease Rates National Agricultural Statistics Service Montana Private Grazing Rates Department of the Interior Montana National Wildlife Refuge Rates Bureau of Indian Affairs Montana reservation Land grazing Rates Literature Review-Based Estimate of Fair Value Trust Land Leases BLM and USFS (1978 PIRA) Rates Conclusions and Recommendations Qualifications INTRODUCTION Sources of Data Overview of Montana State School Trust Lands PREVIOUS RESEARCH AND REVIEW OF THE LITERATURE ON GRAZING LEASE VALUATION Overview of Montana DSL 1993 Report Methods and Conclusions Hedonic Model of Montana Grazing Lease Rates Predicted Fair Market Grazing Rates for State Trust Land Leases Summary of 1993 Grazing Report Findings and Conclusions UPDATED DATA RELEVANT TO ANALYSIS National Agricultural Statistics Service Private Grazing Fees U.S. Department of the Interior Grazing fees for CM Russell NWR Bureau of Indian Affairs Grazing Fees for Montana Reservations DNRC Competitively Bid Trust Land Leases ADDITIONAL ANALYSIS OF TRUST LAND GRAZING LEASE RATES BASED ON UPDATED DATA Analysis of Differences between Montana DNRC Base lease Rates per AUM and NASS Private Average Rates per AUM Analysis of Trends in DNRC Grazing Lease Rates for Competitively Bid Leases Comparison of Montana and Benchmark Grazing Lease Fee Levels: 1992 and Page 2
3 4.3.1 DNRC Montana Base Trust land Grazing Rate Hedonic Model Predicted Rate for typical State Trust Land Leases DNRC Competitively Bid Lease Rates National Agricultural Statistics Service Montana Private Grazing Rates Department of the Interior Montana National Wildlife Refuge Rates Bureau of Indian Affairs Montana reservation Land grazing Rates Literature Review-Based Estimate of Fair Value Trust Land Leases BLM and USFS (1978 PIRA) Rates CONCLUSIONS AND RECOMMENDATIONS ON GRAZING LEASE VALUATION METHODS AND LEVELS DISCUSSION OF LIMITATIONS OF ANALYSIS AND ADDITIONAL CONSIDERATIONS Competitively Bid vs. Non-Competitive DNRC Leases BIBLIOGRAPHY APPENDIX A: HISTORICAL STATE OF MONTANA TRUST LAND GRAZING LEASE BASE RATES APPENDIX B: MARCH 2011 COMPETITIVELY BID DNRC GRAZING LEASES. 46 APPENDIX C: COMMUNICATION ON BIA GRAZING LEASE RATES APPENDIX D: NASS MONTANA PRIVATE GRAZING FEES APPENDIX E: ADDITIONAL AND SUPPORTING ANALYSIS Page 3
4 LIST OF TABLES AND FIGURES Table 1. Comparison of State Trust Land Grazing Fees for 17 Western States (Source: Kevin Chappell MT DNRC) Table 2. Comparison of Montana Grazing Lease Rates per AUM: 1992 and Table 3. Final Reduced hedonic AUM lease rate models: (Duffield and Anderson 1993) Table 4. Summary Of Alternative Estimates Of Fair Market Value For Montana State Lands Grazing Leases (1992 Dollar/AUM Basis). (Duffield and Anderson 1993) Table 5. Private grazing Fee Rates per AUM for Non-Irrigated land: (source: Joe Samson, Statistician USDA/NASS Economics Section, Pers. Com. March 14, 2011) Table 6. Bureau of Indian Affairs Minimum Reported Grazing Lease Rates, by Reservation Table 7. Montana DNRC County-level Statistics for Competitively Bid Trust Land Grazing Leases Table 8. Montana Trust Land Competitively Bid Leases, by Year of Lease Signing (as of March 2011) Table 9. Comparison of Montana Grazing Lease Rates per AUM: 1992 and Table 10. Comparison of NASS Private Montana Lease Rates and DNRC Trust Land Base Rates: in Constant 2010 Dollars Table 11. Comparison of PRivate and DNRC Average Competitively Bid Lease Rates: in COnstant 2010 Dollars Table GAO Report State and Federal Grazing Lease Rates Figure 1. Comparison of Private and DNRC Base Grazing Rates for Montana: Figure 2. Comparison of Private and DNRC COmpetitively Bid Lease Rates: Figure 3. Comparison of NASS Private Grazing Rates for Montana and Surrounding States: Figure 4. Comparison of NASS Private Grazing Rates: Figure 5. Montana Grazing Lease Rates per AUM for Private and State Trust Lands: Figure 6. Conparison of Private Montana and DNRC Competitively Bid Grazing Lease Rates per AUM: Figure 7. Comparison of Montana Private and DNRC Base Grazing Rates in Constant 2010 Dollars Figure 8. Comparison of Private and DNRC Competitively Bid Lease Rates: in Constant 2010 Dollars Page 4
5 EXECUTIVE SUMMARY Setting and Objectives Through the Enabling Act of February 22, 1889, the Congress of the United States gave to the State of Montana two sections of land from every township for common school support. The Enabling and other acts also granted acreage for other educational and state institutions. The original common school grant was for 5,188,000 acres. The additional acreage provided for other endowed institutions included 668,720 acres, for a total of 5,856,720 acres. The total acreage fluctuates through the years due to land sales and acquisitions. This study focuses on those Montana trust lands that are currently leased to parties for grazing livestock. The MCA stipulates that in the leasing of these lands The tract must be leased to the highest bidder unless the board determines that the bid is not in the state's best interest for the reasons set forth in (2). The board may not accept a bid that is below full market value. (MCA ). The formula for setting the annual rental fee for grazing use of state trust lands is also outlined in Montana Statutes Formula for fixing annual rental. (1) In this section: (a) "animal unit" means one cow, one horse, five sheep, or five goats; (b) "animal-unit-month carrying capacity" means that amount of natural feed necessary for the complete subsistence of one animal unit for 1 month. (2) The board shall establish the per annum rental rate per section of all grazing lands that are the property of the state by multiplying a factor established by the board pursuant to times the average price per pound of beef cattle on the farm in Montana for the previous year times the animal-unit-month carrying capacity of the land. (3) The carrying capacity of the land to be used in the above formula must be in accordance with the determinations of the department made under (4) The average price per pound of beef cattle on the farm in Montana must be taken from statistics published by the United States department of agriculture current at the time of computation of the rental or from other reliable sources current at that time. (5) In establishing the rental rate described in subsection (2), the board shall consider applicable elements that include but are not limited to those set forth in In 2011, the state of Montana included grazing use of trust lands within approximately 8,500 lease agreements. The 4.07 million acres of classified grazing lands and forest lands have an estimated carrying capacity of 975,766 animal-unit-months (AUMs). The minimum rental rate for 2011 of $6.23/AUM for grazing leases is set annually by a formula which includes the average weighted Page 5
6 price for beef cattle sold in Montana during the previous year. In FY 2010, grazing leases generated $6,483,884. While grazing leases of state trust lands are let by competitive bid as mandated by statute, fully 95 percent of state grazing leases are renewed by application of the current leaseholder without competing bids. These renewed leases are thus leased at the minimum rate per AUM established annually by the state. One reason that there are not more competitively bid leases is that often state grazing leases are inholdings (due to the original designation of single sections within townships to support schools). Because of this, the number of livestock producers that can efficiently use the DNRC parcel may be limited by access or lack of fencing or other reasons (Duffield and Anderson 1993). Accordingly, it is appropriate to look to other methods to determine the fair market value of these leases. Given that such a large proportion of state grazing leases are not priced within a competitive market setting, the state of Montana has an interest in determining the appropriate fullmarket value for state trust land leases to help inform the setting of the annually determined base rental rate per AUM. While grazing is by far the largest single use of Montana school trust lands, earlier work (Duffield and Anderson 1993) estimated that, despite the legal mandate to obtain full market value for use of these lands, the average rate per AUM received is approximately 50% of the estimated full market value. This report, by Bioeconomics, Inc. of Missoula, Montana, has been prepared under contract number CSO with the State of Montana Department of Natural Resources and Conservation. The primary task associated with this contract is to: Furnish DNRC with a report that estimates the statewide fair market rental rate for Montana state grazing leases given the terms and characteristics of those leases. The estimated fair market value rental rate must be made on a per animal unit month (AUM) basis. The full market rate shall be identified through a review and reconciliation of existing data on grazing lease rental rates in Montana, including current private market rates and an earlier assessment by Bioeconomics, Inc. of the market rate for livestock grazing undertaken in Current private market rates shall be obtained from the National Agricultural Statistics Service (NASS) which gathers information on and reports average private grazing rates per AUM on an annual basis. The hedonic price model of the Montana market for grazing leases, developed in , may be used in conjunction with current market price data to predict the full market price of grazing leases with the characteristics of state trust land grazing leases. The state trust land full market grazing lease rate per AUM for 2010 will be predicted as a ratio to the current private market average lease rate. The contractor shall also review the current economic literature to identify other recent studies that may relate to the issue. Page 6
7 Methods This section briefly summarizes the methods used in this study to identify the full market value for Montana DNRC grazing leases. Results are summarized below. There are at least four general methods for identifying the full market value of Montana school trust land grazing leases. These methods are: 1) interpreting private market data: an hedonic model, 2) competitive bids for these lands, 3) grazing fees charged on other similar public lands, such as school trust lands in other states or for federal-administered leases, and 4) economic studies of this issue. Hedonic model. One approach to identifying the full market lease rate for state trust land grazing leases is to identify how similar leases are valued in the private market. Like many commodities, such as automobiles, the value of grazing leases depends on the characteristics of the lease. In an hedonic model the price of a commodity is explained as a function of the commodity s characteristics; for example, car prices are a function of horsepower, size of the vehicle, and various amenities such as power steering and high quality interiors. This is a widely applied economic tool to explain price differences for market commodities. State leases are known to differ from the average private market lease in that they are longer term and no landowner services are provided such as fencing or water improvements. Duffield and Anderson (1993) developed a model to explain how private market lease rates (using data on actual Montana private leases) vary depending on the term and other factors such as landowner services. Based on this model, it was found that the full market value for state leases was 70% of the average private market lease rate. Competitive bids for Montana DNRC grazing leases. Another approach is to look at the rate per AUM for the share of DNRC grazing leases that are competitively bid. There are around 40 to 50 such leases that are competitively bid each year, which provides direct evidence of the market for state school trust leases. These competitively bid leases for Montana DNRC lands average around 78% of the private market lease rate as detailed below. Grazing fees on other public or trust lands. Another approach to potentially identifying market values for Montana DNRC leases is to examine lease rates used on other public or trust lands. The U.S. General Accounting Office (GAO) reviewed this data in 2005; in this study we update this data for several types of federal leases in Montana. We also review briefly lease rates on state lands in other, mostly western, states. In general there is a dichotomy in terms of public policy toward grazing lease rates. In many cases, such as leases administered by the USDA Forest Service and the Bureau of Land Management rates are far below the market rate and provide a considerable subsidy to the livestock industry. For other public leases (as described below, for example for Bureau of Indian Affairs and Department of Interior leases on federal National Wildlife Refuges in Montana) rates are actually the same as the private market. Among states with regard to school trust land grazing leases, there is the same dichotomy with many states, like Montana, providing a considerable subsidy to ranchers. Table 1 shows the current grazing lease fees for 17 western states for state school trust lands. Several states were identified in Duffield Page 7
8 and Anderson (1993) where school advocates successfully challenged state grazing leases in court, specifically in Nebraska and Oklahoma. Based on GAO (2005) data for 2004, these are currently the only two states where full market values are being realized, with minimum bids at 70% and 87%, respectively, of the private market lease rates in Montana. These findings support the hedonic model estimates of Duffield and Anderson (1993) for Montana. Economic literature. A final general approach to identifying the full market value for state trust land leases is to examine studies of this issue published in the economics literature. One such study, described more fully below, is Torell et al (1988) which is a study of lease rates in New Mexico. The findings from this study are similar to the Duffield and Anderson (1993) hedonic model for Montana, with the conclusion of a full market value at a lease rate of 74% of the private market rate. Data Sources The current analysis takes as its starting point the 1993 report for the Montana Department of State Lands on the fair market value for state land grazing leases (Duffield and Anderson 1993). This original report provided a discussion of relevant studies on grazing lease prices and valuation as well as extensive analysis based on original data collected on a broad spectrum of grazing leases in the State of Montana. The results and conclusions from the 1993 DSL study have been augmented and updated in the current report using a number of sources of data, including: 1. U.S. Department of Agriculture, National Agricultural Statistics Service (NASS) data on statewide average private grazing fee rates (USDA National Agricultural Statistics Service 2011) 2. Montana DNRC lease rate data 3. Bureau of Indian Affairs (BIA) grazing lease rates data for Montana reservation lands 4. Federal National Wildlife Area (NWA) grazing lease rate data for the state of Montana. Page 8
9 TABLE 1. COMPARISON OF STATE TRUST LAND GRAZING FEES FOR 17 WESTERN STATES (SOURCE: KEVIN CHAPPELL MT DNRC). STATE GRAZING FEE HOW FEE IS SET ACRES UNDER LEASE FY2010 GRAZING REVENUE AZ $2.28/AUM Appraisal of value of forage 8,408,004 $2,403,080 CA No set fee Fair market rate appraisal 24,616 $7,759 CO 35% less than private Through independent survey 2,651,950 $6,162,561 ID $5.12/ AUM By formula 1,415,667 $1,532,652 MN $10-$40/acre Per acre basis or by AUM 1,767 $16,114 varies by county MT Minimum of 7.54 X prior yr weighted beef ~4,070,000 $6,483,887 $6.12/AUM price/lb ND Set by auction Opening bid based on private markets. Auctioned every 5 years. Fee adjusted for fencing, soils, and weed control. ~ 687,000 $5,007,855 NE $22.50-$38/AUM or $5.40-$41.85/acre Based on private rates, economics of area, forage, soil types, and credits for lessee's fencing and wells. NM $3.19/AUM Fee formula based on NASS Economic Indices NV Variable Greater of average of last 3 yrs Beef Price Index divided by PPI or base value adjusted for inflation. 1,011,771 $13,492,766 8,821,745 $5,216,784 None $0 OK $8.34-$20.83/AUM Market comparables set 592,087 minimum at public auction OR $5.30/AUM By formula based on animal gain ~ 621,000 $356,911 SD 10.82/AUM Set by statute 760,800 $4,360,000 TX $65-$150/AUM Market rate. 638,000 $500,000 UT $3.92-$7/AUM Fee formula with higher rent per 3,170,403 $790,761 AUM on larger blocks. WA $8.78/AUM Private rate less $2/AUM for services provided on private lands. 550,000 $677,405 WY $4.64/AUM By carrying capacity of land 3,494,197 $5,247,021 Page 9
10 Summary Results and Conclusions Sections 3 and 4 of this report discuss Montana grazing lease data that was previously compiled (Duffield and Anderson 1993), as well as current data on public and private land grazing fees for the state of Montana. Table 2 summarizes this information and presents it from two comparative perspectives. First, the grazing fee data are presented as a comparison between the annual DNRC base grazing lease rate per AUM and the six alternative benchmark grazing rates examined. Additionally, a comparison is made between the DNRC base rate and alternative benchmark rates for 1992 and the most recent available years ( ). These comparisons are discussed in turn for each of the benchmark rates and for the DNRC base rate. Not all of the benchmark grazing rates shown in Table 2 are necessarily strictly comparable to the appropriate lease rates for state trust lands. Different leases are characterized by different levels of landowner services, different durations of the lease, and different land characteristics. The six benchmark estimates are presented to demonstrate the general range of Montana grazing lease rates. DNRC Montana Base Trust land Grazing Rate Consistent data series are available for both the private grazing fee rates published annually by NASS (APPENDIX D), and the base rental rate for Montana trust grazing land (APPENDIX A). Figure 1 shows a graph of those respective rates for the period A comparison of the two data series and their respective trendlines points out two clear and consistent differences between the rates over the time period. First, as noted in the 1993 report, the NASS private grazing fee rate is substantially higher than the DNCR base rate throughout the time period. 1 Additionally, the annual increase in the average private grazing fee is more than double that of the DNRC base rate. 2 The combination of these two trends results in a persistent gap between private and state grazing rates that increases over time. The implication is that state grazing fees on average are falling further and further behind benchmark fair market rates over time. Row (A) of Table 2shows the DNRC base lease rate per AUM for 1992 and for Also shown for this rate (and for the following benchmark rates) are the percentage change in this rate from 1992 to 2010, what percentage of the NASS average Montana private lease rate this state rate was in 1992, and what percentage of the NASS private rate it is in the most recent year. From 1992 to 2010 the DNRC base rate for grazing increases from $4.17 to $6.23 per AUM. This represents a 49% increase over the period. Between 1992 and 2010 the DNRC base rate decreased as a percent of the NASS-published average private grazing fee for Montana. In 1992 the DNRC base rate was 37% of the private rate, and in 2010 it was 34% of the private rate. 1 Over the period the private rate per AUM reported by NASS averages 281% of the DNRC base rate per AUM. 2 The private grazing fee per AUM for Montana increases by an average of 34.3 cents per year (95% C.I to 37.8 cents), while the DNRC base rate increase at an average 14.4 cents per AUM per year (95% C.I to 17.2 cents) Page 10
11 Appendix E details changes in DNRC and NASS grazing rates over time in inflation adjusted (2010) dollars. The trends over this period show that in real (constant dollar terms corrected for inflation) rates are flat to declining for both the DNRC base and the NASS private lease rates. For the period 2001 to 2010 private grazing rates corrected for inflation have been very stable at around $18.40 per AUM (see Appendix E). Lease Rate per AUM $20.00 $18.00 $16.00 $14.00 $12.00 $10.00 $8.00 $6.00 $4.00 $2.00 $- Montana Grazing Lease Rates per AUM for Private and State Trust Lands: y = 0.144x R² = y = x R² = Year NASS Montana Private Lease Rate DNRC Trust Land Base Rate FIGURE 1. COMPARISON OF PRIVATE AND DNRC BASE GRAZING RATES FOR MONTANA: Hedonic Model Predicted Rate for typical State Trust Land Leases The 1993 Montana grazing fee study utilized collected statewide grazing lease data to estimate a hedonic model of grazing rates in the state. This type of model was used to predict the fair market lease rate for a state trust land lease that had the characteristics of the typical state lease (no landowner provided services, and a lease term of > 5 years). The 1992 predicted fair market rate for a state lease reported by (Duffield and Anderson 1993) was $7.69 per AUM. This rate was 68% of the 1992 NASS private land lease rate for Montana. Using this relationship and current NASS private rates for Montana, leads to an estimated predicted fair market rate for state leases in 2010 of $12.56 per AUM. 3 The hedonic model explains the difference in private market and state lease rates 3 This estimate is based on the assumptions that the underlying relationship between the true value of state and private leases has not change significantly over this period. Conversations with DNRC personnel indicate that the Page 11
12 one would expect if state leases were all competitively bid. A competitive market would price state leases at about 70% of the private lease average because state leases are longer term and provide no landowners services such as fencing and water improvements that are more typical in a private lease. (See Section 2 for more information on the hedonic model.) Because the updated predicted state rate is directly proportional to changes in the NASS private rate, the percentage change in the predicted hedonic rate from 1992 to 2010 is the same as the actual change in the private rate, a 63% increase. The predicted state rate based on the hedonic model is 68% of the NASS private rate for both 1992 and DNRC Competitively Bid Lease Rates In 2011, DNRC reported that of an estimated 975,766 AUMs of trust land grazing leased, only about 5% of leases, constituting 46,339 AUMs had received competing bids, and thus were issued above the base lease rate of $6.23 per AUM. Duffield and Anderson in their 1993 statewide grazing survey and analysis found no significant differences in terms of land type and services provided between those state leases that received multiple bids and those that were issued to a single bidder. Figure 2 shows a comparison of average lease prices for competitively bid trust land grazing leases and for private grazing leases in Montana. Also shown in the figure are the estimated linear trendlines for the two series. Annual inflation accounts for about 64 percent of the year to year variation in the average competitively bid lease rate per AUM. Over the 10 year period, average winning lease bids increased an average of 64 cents per AUM year over year. Clearly, as with the NASS private Montana grazing lease rates, the DNRC competitive bids have also seen a consistent upward trend in recent years. In constant dollar terms, competitively bid state leases have seen a modest upward trend from while prices for private grazing in Montana have remained flat(see Appendix E). The average price of the sub-population of state trust land leases that received competitive bids when awarded has grown substantially in nominal terms from 1992 to In 1992 the average rate for competitively bid leases was $8.34 per AUM. As of March 2011 this average rate was $14.28 per AUM. The average rate of the winning bids for competitive state leases increased 71% from 1992 to In 1992 the average competitive bid rate was 74% of the NASS private lease rate, and in 2010, this had increased to 78% of the private lease rate per AUM. structure of state leases has remained generally unchanged in respect to the key factors incorporated in the hedonic model over the relevant years. Page 12
13 Comparison of Private Montana and DNRC Competitively Bid Grazing Lease Rates per AUM: $20.00 $19.00 $18.00 DNRC Competitively Bid $/AUM y = 0.46x R² = $ per Aum $17.00 $16.00 $15.00 $14.00 NASS Montana Private Lease Rate y = x R² = $13.00 $12.00 $11.00 $ FIGURE 2. COMPARISON OF PRIVATE AND DNRC COMPETITIVELY BID LEASE RATES: National Agricultural Statistics Service Montana Private Grazing Rates Figure 3 shows the average private grazing lease rates for Montana and its surrounding states for the period While there is substantial variation between the private lease rates in the five states, they all show a consistent trend of increasing rates over the period shown. Additionally, Montana rates are generally consistently higher than all but the South Dakota rates. NASS-reported private lease grazing fees for Montana increased 63% from 1992 to 2010, from $11.27 to $18.40 per AUM. Page 13
14 $25.00 $23.00 $21.00 Comparison of Private Grazing Lease Rates per AUM in MT, ID, ND, SD, and WY: Lease Rate per AUM $19.00 $17.00 $15.00 $13.00 $11.00 $9.00 $7.00 $ MONTANA IDAHO NORTH DAKOTA SOUTH DAKOTA WYOMING FIGURE 3. COMPARISON OF NASS PRIVATE GRAZING RATES FOR MONTANA AND SURROUNDING STATES: Department of the Interior Montana National Wildlife Refuge Rates The 1993 Montana grazing report did not include information on grazing rates for federal National Wildlife Refuges within the state. This information is now available, and provides a new benchmark for comparison to state lease rates. Currently the DOI-administered rates for Montana National Wildlife Refuges are based on the NASS private grazing rate (currently $18.40/AUM). 4 These leases differ from state leases in that they are one-year leases, and there is some landowner participation in land management costs and improvement (such as fencing) costs. Bureau of Indian Affairs Montana reservation Land grazing Rates The 1993 grazing report found an average lease rate for BIA-administered grazing lease in Montana of $8.37/AUM. The current average lease rate across the five reservations administered by the BIA Rocky Mountain Region is $18.65/AUM. This represents a 123% increase in estimated BIA lease rates per AUM from 1992 to In 1992 it was estimated that BIA rates were 74% of NASS private rates. In 2010 it is estimated that grazing rates on BIA-administered lands are on average 4 The Montana DFWP also uses the NASS private grazing rate as an initial basis for setting grazing fees on state Wildlife Management Area lands. For new WMA leases, FWP charges the NASS rate unless either 1) the lessee is required to perform significant fence installation or maintenance (in which case the DNRC rate is charged, or 2) the lease is a component of a larger exchange of use agreement with the lessee (Per. Comm. Steve Knapp, Wildlife Habitat Section Supervisor, DFWP. April 14, 2011). Page 14
15 101% of private rates. BIA-administered grazing leases are similar in structure and services to state of Montana trust land leases. Literature Review-Based Estimate of Fair Value Trust Land Leases An additional perspective on a fair market rate was provided by Duffield and Anderson (1993) based on their review of the economics literature. New Mexico researchers (Torell, Ghosh and Fowler 1988) found that about 30% of the amount paid for private market grazing leases was for services (such as fencing, water, weed control). This suggests that (applying the New Mexico results to Montana) the fair market rate for state trust lands can be approximated as 70% of the NASS average private market rate. In 1992, 70% of the NASS private rate was $8.30 per AUM. In 2010, this value was $12.88 per AUM. No additional citations to this earlier work were identified in our literature review. BLM and USFS (1978 PIRA) Rates A final point of comparison is the federal grazing rate for 16 western states set annually by the BLM and USFS. This rate (set by formula) was $1.92/AUM in 1992 and is $1.35/AUM in The federal rate has been a source of considerable controversy, and today stands in stark contrast to other Montana rates such as the BIA and DOI (national wildlife refuge) rates. It appears that this rate is intended to provide a subsidy to the livestock industry and is not a reflection of the market value of these leases (GAO 2005). TABLE 2. COMPARISON OF MONTANA GRAZING LEASE RATES PER AUM: 1992 AND Estimate/rate % Change % of Private 1992 Rate % of Private 2010 Rate (A) DNRC Base Rate $ 4.17 $ % 37% 34% (B) Private Rate (NASS) $ $ % (C) Montana (DNRC) Specific Estimates (1) Hedonic model (typical state lease) Rate $ 7.69 $ % 68% 68% (2) DNRC Competitive Bids $ 8.34 $ % 74% 78% (3) Economics Literature Torell et al. (1988) $ 8.30 $ % 74% 70% (D) Federal Rates (1) CMR (DOI) $ % (2) BIA $ 8.37 $ % 74% 101% (3) BLM & USFS (1978 PIRA) $ 1.92 $ % 17% 7% Page 15
16 Conclusions and Recommendations The 1993 Montana grazing study (Duffield and Anderson 1993) presented as its overall conclusion regarding the appropriate state trust lease rates the following: As a result of an intensive (and extensive) survey of Montana ranchers concerning grazing lease rates and four additional methods of analysis, we conclude that current state lease rates are much lower than current fair market value. Lease rates on Montana DSL grazing leases currently average $4.24 per AUM. The preceding analysis suggests that fair market value for these leases is on the order of $7.50 to $8.50 per AUM. (Duffield and Anderson 1993, ES-7) The 1993 analysis estimated that an appropriate level for state land lease rates in that year was between 66% and 75% of the NASS Montana average private lease rates. The analysis presented in this report updates and expands on the 1993 study and results. Table 2 shows four alternative classes of Montana grazing lease fees. Class (A) is the DNRC base rate, Class (B) is the NASS private lease rate, Class (C) includes rates based on DNRC-specific data or estimates, and Class (D) includes federally set rates. Probably the best estimate of the fair market rate for DNRC trust land grazing leases is the actual lease rate realized in the share of DNRC leases that are competitively bid. Accordingly, the longer term target for state grazing leases should be to move toward 75%-80% of the private market lease rate. For the near term, there is considerable empirical support for initially moving to a DNRC trust land grazing lease that is at least 70% of the private market rate. This is supported by the 1993 Montana hedonic model, the Torrell et al. (1988) study, and the DNRC leases that are competitively bid. There is even some evidence to support using 100% of the private market rate as in current BIA lease rates on Indian Reservations and DOI rates on federal National Wildlife Refuges in Montana. However, these federal leases sometimes provide more landowner services than state leases. The specific experience in Nebraska and Oklahoma with increased grazing rates is also supportive of the conclusion that Montana DNRC grazing rate should be substantially increased. To conclude, for the near term, there is substantial empirical evidence that DNRC trust land grazing leases should be raised to at least 70 percent of the NASS-published average Montana private market rate in order to realize full market value on these assets. Page 16
17 Qualifications This report was developed by Dr. John Duffield (Yale PhD. Economics 1974), Dr. David Patterson (University of Iowa, PhD. Statistics, 1983), and Mr. Chris Neher (MA Economics, University of Montana 1989). This research team s area of specialization within natural resource economics is the valuation of the services provided by market and nonmarket resources. Their prior most closely related work includes a suite of fair market value studies undertaken for the then, MT Department of State Lands in the early 1990s, including grazing leases, cropland, cabin rentals and recreation use. That work has since been relied on by the courts in several landmark cases, for example relating to cabin leases in Montana Supreme Court cases that have come to be known as Montrust I, and Montrust II. This research team also recently completed a study for Montana DNRC to develop methodologies to assess an annual lease fee, whereby State Trust Lands may be utilized for recreational purposes (Bioeconomics, Inc Montana School Trust Lands Valuation Methodologies: Application to Whitefish School Trust Lands Neighborhood Plan.) Other closely related work includes serving as the economics expert witness for the Montana Attorney General in PPL Montana, LLC v. State of Montana. In that case the district court relied on Dr. Duffield s theory and findings of facts with respect to the fair market rental for hydropower use of state trust lands. Other related work includes assisting the Montana Natural Resource Damage Program over the last 20 years in valuation of foregone recreation values and groundwater services in the context of the Clark Fork Superfund cases (Montana v. Arco) as well as similar issues recently resolved (2008) concerning the Mike Horse Dam and E. Helena smelter, all of which resulted in significant settlements for the state. Page 17
18 1.0 INTRODUCTION This report, by Bioeconomics, Inc. of Missoula, Montana, has been prepared under contract number CSO with the State of Montana Department of Natural Resources and Conservation. The primary task associated with this contract is to: Furnish DNRC with a report that estimates the statewide fair market rental rate for Montana state grazing leases given the terms and characteristics of those leases. The estimated fair market value rental rate must be made on a per animal unit month (AUM) basis. The full market rate shall be identified through a review and reconciliation of existing data on grazing lease rental rates in Montana, including current private market rates and an earlier assessment by Bioeconomics, Inc. of the market rate for livestock grazing undertaken in Current private market rates shall be obtained from the National Agricultural Statistics Service (NASS) which gathers information on and reports average private grazing rates per AUM on an annual basis. The hedonic price model of the Montana market for grazing leases, developed in , may be used in conjunction with current market price data to predict the full market price of grazing leases with the characteristics of state trust land grazing leases. The state trust land full market grazing lease rate per AUM for 2010 will be predicted as a ratio to the current private market average lease rate. The contractor shall also review the current economic literature to identify other recent studies that may relate to the issue. This report is organized as follows: Section 1: Provides introduction to the problem addressed and the methods and data sources used in the analysis. Section 2: Provides a discussion of the existing literature on Grazing lease values, and previous work on valuing State of Montana trust land grazing leases. Section 3: Presents data and other information available since 1993 used to inform the analysis. Section 4: Presents the core analysis of data-supported State of Montana trust land grazing lease Base rates. Section5: Provides the authors recommendations for the appropriate methods and levels associated with setting base grazing lease rates for trust lands. Page 18
19 Section 6: Discusses limitations of the preceding analysis and the likely sensitivity of proposed lease rates to alternative assumptions. 1.1 Sources of Data The current analysis takes as its starting point the report for the Montana Department of State Lands in 1993 on the fair market value for state land grazing leases (Duffield and Anderson 1993). This report provided a discussion of recent studies on grazing lease prices and valuation as well as extensive analysis based on original data collected on a broad spectrum of grazing leases in the State of Montana. The results and conclusions from the 1993 DSL study have been augmented and updated in the current report using a number of sources of data, including: 1. U.S. Department of Agriculture, National Agricultural Statistics Service data on statewide average private grazing fee rates (USDA National Agricultural Statistics Service 2011) 2. Montana DNRC lease rate data 3. Bureau of Indian Affairs grazing lease rates data for Montana reservation lands 4. CM Russell NWA grazing lease rate data. The following analysis utilizes the above information and data on grazing lease rates in the state of Montana to estimate a current (2011) lease rate for Montana trust lands on a per AUM basis, that is consistent with 1.2 Overview of Montana State School Trust Lands Through the Enabling Act of February 22, 1889, the Congress of the United States gave to the State of Montana two sections of land from every township for common school support. The Enabling and other acts also granted acreage for other educational and state institutions. The original common school grant was for 5,188,000 acres. The additional acreage provided for other endowed institutions included 668,720 acres, for a total of 5,856,720 acres. The total acreage fluctuates through the years due to land sales and acquisitions. 5 Any proceeds from the sale and permanent disposition of trust lands, or part thereof, must become permanent funds for the support and maintenance of the public schools and the various state institutions for which the lands had been granted. Any rentals received on leased lands, 5 The discussion of Montana School Trust Lands is adapted from The DNRC website provides additional information on the location of trust lands statewide and the beneficiaries of the trust. Page 19
20 interest earned on the permanent funds arising from these lands, interest earned on deferred payments on lands sold, and all other actual income shall be available for the maintenance and support of the beneficiary schools and institutions. Approximately 8,500 agreements include grazing use of trust lands. The 4.07 million acres of classified grazing lands and forest lands have an estimated carrying capacity of 975,766 animalunit-months (AUMs). The minimum rental rate for 2011 of $6.23/AUM for grazing leases is set annually by a formula which includes the average weighted price for beef cattle sold in Montana during the previous year. In FY 2010, grazing leases generated $6,483,884. The purpose of the DNRC Trust Land Management Division (TLMD) is to administer and manage the state trust timber, surface, and mineral resources for the benefit of the common schools and the other endowed institutions in Montana, under the direction of the State Board of Land Commissioners. The board consists of Montana's top elected officials. As was done in the 1993 report, the central question examined in this report is whether the current lease rate returns a "full market value" to the school trust as required by the Montana Enabling Act of 1889 and by the Montana Constitution of Page 20
21 2.0 PREVIOUS RESEARCH AND REVIEW OF THE LITERATURE ON GRAZING LEASE VALUATION The 1993 Montana grazing fee study detailed the key literature to that date on grazing lease fees in the western US. Most of the literature in this area has focused on setting fees on federal lands (Torell and Doll 1991) (Workman 1988) (Borman 1990). Work cited specific to grazing fees on state lands included a study of rangeland conditions in Colorado (Rouse 1991) and policy studies emphasizing differences in grazing land management and fee strategies across states (Bartlett 1983) (J. Souder 1990) (Souder and Fairfax, The State School Trust Lands 1990) (Souder and Fairfax 1991). Since the 1993 Montana grazing fee report analysis and studies on Federal grazing fees has continued to focus largely on federal grazing fees (for example, (L. R. Torell 2003)). What was true in 1993 continues to be true today. Private grazing leases are priced at much higher rates on average than fees on much public ground (including Montana State trust lands). This has led to the general perception that many public leases are underpriced. The minimum (base) trust land lease rate in Montana in 2010 was $6.12 per AUM while the average private grazing lease for the year was $18.40 per AUM (USDA National Agricultural Statistics Service 2011). The basis for annual data on private market lease rates is the July Cattle Survey implemented by the Agricultural Statistics Service in each state (including Montana). The survey basically asks the respondent to "report" what the average private grazing lease rate is in their area. There are two limitations to this data as far as providing a basis for determining a fair market value on public lands. First, the question does not ask the person to identify actual transactions but "to recall or speculate on values" (U.S. Department of Agriculture and the Department of Interior 1992). Secondly, it is not obvious that the terms, conditions of the land, and services provided on the average private lease correspond to the average public lease. For example, if the average public lease does not include important services which affect the cost and productivity of holding the lease (such as who pays for fencing, water improvements, etc.), the fair market value for these leases may in fact be below the market average. Despite limitations associated with the NASS-published private grazing rate estimates, these estimates have been increasingly accepted by agencies such as the Department of Interior, for setting public land lease rates on national wildlife refuge grazing lands. 6 Additionally, the Bureau of Indian Affairs uses a market analysis for many Montana reservations to set minimum grazing fees for the competitive bidding process. These market-based minimum rents for BIA administered Montana 6 Personal Communication, Bill Berg, C.M. Russell NWR. March 17, 2011 Page 21
22 reservation grazing lands currently are on average approximately equal to the NASS private 2010 lease rate for the state. 7 A comprehensive review of these issues is provided by a report of the Secretaries of Agriculture and Interior to the U.S. Congress in 1986, entitled "Grazing Fee Review and Evaluation". This study was updated in April, As discussed in this report, federal fees are based on the so-called PRIA formula. The PRIA formula is: Calculated Fee = $1.23 x (FVI + BCPI-PPI)/100 where $1.23 is the base price from a survey in 1966, FVI is a the Forage Value Index (based on the July Cattle Survey index of annually surveyed private grazing land lease rates with =100), BCPI is a beef cattle price index and PPI is an index of prices that livestock producer costs. This formula generates very low fees at present because it includes the factor to take account of producer costs, which have been generally increasing. 2.1 Overview of Montana DSL 1993 Report Methods and Conclusions The following discussion presents the key results and conclusions from the 1993 Montana grazing fee study. Section 3 of this applies current grazing rate data published since the 1993 report to update and expand on the 1993 findings Hedonic Model of Montana Grazing Lease Rates One approach to identifying the full market lease rate for state trust land grazing leases is to identify how similar leases are valued in the private market. Like many commodities, such as automobiles, the value of grazing leases depends on the characteristics of the lease. In an hedonic model the price of a commodity is explained as a function of the commodity s characteristics; for example, car prices are a function of horsepower, size of the vehicle, and various amenities such as power steering and high quality interiors. This is a widely applied economic tool to explain price differences for market commodities (Rosen 1974). State leases are known to differ from the average private market lease in that they are longer term and no landowner services are provided such as fencing or water improvements. Duffield and Anderson (1993) developed a model to explain how private market lease rates (using data on actual Montana private leases) vary depending on the term and other factors such as landowner services. Based on this model, it was found that the full market value for state leases was 70% of the average private market lease rate. 7 The current average minimum bid across the Ft. Peck, Ft. Belknap, Crow, Northern Cheyenne, and Blackfeet reservations is $ It should be noted that this is the average minimum bid for the leases and not the average lease rate, which would be higher for competitively bid leases. Personal Communication, Dave Hopkins, BIA- Rocky Mountain Regional Office. March 17, Page 22
23 The final estimated hedonic price model for explaining observed differences in Montana private AUM lease rates is shown in Table 3. This estimated model explains AUM prices in terms of location (Whether the lease was located in Districts 30 or 50), services provided by the lessor (such as fence and water development costs), land type (if irrigation is available), lease terms (if the lease is for > 5 years), and whether the lease had been held for one year or less (hereafter called "New Lease"). Other characteristics of the leases such as whether the lease was an inholding on a larger ranch, whether there were noxious weed problems, or location of the leases in districts besides 30 and 50 were not found to have any statistically significant predictive power in the estimated model.. The explanatory variables in the model were generally significant at the 99% confidence level, with the exception of District 30, and New Lease, which were significant at the 90% level. TABLE 3. FINAL REDUCED HEDONIC AUM LEASE RATE MODELS: (DUFFIELD AND ANDERSON 1993) Variable 8 Reduced Model Coefficient t-statistic Intercept (28.14) District (-1.81) District (3.72) New Lease (1.95) Terms (-2.58) Fence Maintenance (3.90) Water Development (2.66) Land Type (2.76) Adj R 2 Sample Size The estimated model explained about 26.8% of the observed variability in lease prices. District 30 tended to be less expensive, and District 50 more expensive. All other things being equal, leases in 8 DISTRICT 30 and 50= dummy variable 0/1, coded 1 if lease is located in a given district, 0 otherwise. WATER DEVELOPMENT= Landowner participation in water development costs. Dummy variable coded 1 if landowner contributes to development and 0 otherwise. NEW LEASE= Dummy variable coded 1 if lease held for 1 year only, and 0 if lease has been held for more than one year. TERMS= Dummy variable coded 1 if lease terms are more than 5 years, and 0 if less than or equal to 5 years. FENCE MAINTENANCE= Landowner participation in fence maintenance costs. Dummy variable coded 1 if landowner contributes to development and 0 otherwise. LAND TYPE= Dummy variable, coded as dummy 1 if lease is irrigated, and 0 if subirrigated or dryland lease. Page 23
24 District 30 were lower by -$0.86/AUM and District 50 was more expensive by +$1.60/AUM. All other things being equal, lessor participation in services resulted in higher lease prices. Contribution to water development, either materials, labor, or a combination of costs added +$0.95/AUM. Similar participation in fence maintenance added +$1.44/AUM to the lease price. Irrigated leases added an additional $2.27/AUM to the lease rate. Recently negotiated leases, held one year only, were more expensive by $0.75/AUM, and leases with terms exceeding 5 years were less expensive by -$1.94. One would expect many other variables such as inholding status, lease acreage, productivity, operating expenses, etc. to play a determining role in AUM lease prices. These variables are not present in the multivariate model reported by Duffield and Anderson (1993) because they do not add any additional explanatory power to the model given the presence of district, water development, irrigation, the lease held one year variable, fence maintenance, and lease terms Predicted Fair Market Grazing Rates for State Trust Land Leases The 1993 hedonic model for AUM price derived from the private lease sample was used to predict AUM prices for state leases in the sample. The estimated hedonic model indicated that state leases were generally underpriced relative to private leases of comparable quality. State leases in the 1993 data base averaged $4.74/AUM. The hedonic model predicted an average market value for all state leases to be $8.16, and for the typical state lease to be $7.69/AUM. 9 The 1993 report concluded that state leases were on average significantly underpriced relative to full market value for those leases Summary of 1993 Grazing Report Findings and Conclusions In addition to using the estimated hedonic model of Montana grazing lease rates to predict the fair market value of state grazing leases, the 1993 report also included a number of grazing rate benchmarks from both their survey of Montana ranchers and other sources as well. Table 4 shows the full summary of comparable estimates of fair market grazing rates from the 1993 report. Four specific approaches are shown to estimate a fair market value for state grazing leases. Estimate one is based on a statistical model (a so-called "hedonic model") that relates lease characteristics and terms to price for private market grazing leases. Lease characteristics that could influence price include the term (number of years) of the lease, whether the lease is a newly held lease, provision of fencing maintenance and other services by the landlord, whether the lease is irrigated or dryland and region the lease is located in (e.g. central versus northeast Montana). The latter factor is included to account for differing market conditions across the state. 9 The 1993 report defined the typical state lease to include no services, be dryland, have a 10 year lease, and to have been held for more than one year. In 1993, approximately 76% of state leases were considered typical under these conditions. Page 24
25 This model was used to predict the market value of leases with characteristics similar to the typical state lease (no landlord provided fencing or water development services, terms greater than five years, not newly held, and dryland). For the "typical" state lease the specific estimate of fair market value is $7.69. Based on the estimated confidence interval for this predicted value, one can be 95 percent sure that the true mean is between $6.23 and $9.14. This range reflects the uncertainty in the parameters of the model and how close the values of the explanatory variables used in the prediction are to the means of these variables in the sample of private leases. These prices based on the hedonic model are somewhat lower than the average market price because state leases are less likely to be on irrigated land and generally offer much lower levels of landlord services with regard to fencing and water. Additionally, state leases are much more likely to have been held for more than one year and are for a longer term. A second way to estimate a market value of state leases is to look at the average competitive bid for the 8% of all state school land grazing leases which were competitively bid in Leases which were competitively bid were not significantly different from other state leases regarding services and land type. The average competitive bid for state leases in 1992 was $8.34, based on a sample of all 613 competitively bid state leases in that year. A third approach used was to examine what other public land management agencies charge for private grazing leases. The 1993 study noted that BLM and Forest Service lease rates are set by formula (at $1.92 for the study year) and do not provide useful information on the forage lease market. However, Bureau of Indian Affairs (BIA) leases do appear to represent market leasing rates. According to BIA personnel, BIA leases are determined by competitive bid and negotiation. In a sample of 32 BIA leases in 1992, the average lease was at $8.37 and the range was from $5.85 to $ These leases are similar to state leases in that they typically have few landlord services. In May 1992, the BIA issued an appraisal for leases on the Fort Peck Reservation. The appraiser, Anita Bauer, reported that through a phone survey she identified 17 useable private leases both on and off the Fort Peck Reservation. The average market price where landlord provided all the livestock care was $11.00/AUM and where the tenant provided all the care the average price was $8.35/AUM. A final perspective on a fair market AUM-based price was provided by Duffield and Anderson through a literature review. Torell, et al., did a study of the value of public grazing leases in New Mexico (Torell, Ghosh and Fowler 1988). The study found that about 30% of the private market lease rate was for services. Accordingly, they suggest that the value of forage on public leases (at least for New Mexico) is appropriately given by taking 70% of the private market lease rate for nonirrigated lands. Assuming that this ratio holds for Montana, and applying it to the dryland private reference price in Table 4 (at $11.27/AUM) yields an estimate of the value of state grazing leases in Montana at $7.89. These four methods tend to lead to a fair market value for state grazing leases that is around 70% of the private dryland lease rate. All the estimates are bracketed by the fairly narrow range of $7.69 to $8.37. This evidence suggests a fair market price of between $7.50 and $8.50, with a point estimate of $8.00 for Montana State trust land grazing leases in Page 25
26 TABLE 4. Summary Of Alternative Estimates Of Fair Market Value For Montana State Lands Grazing Leases (1992 Dollar/AUM Basis). (DUFFIELD AND ANDERSON 1993) Estimate Mean $/AUM 95% Confid. Interval Standard Error Sample Size Percent of private dryland A. Private market reference prices. Dryland private leases B. Estimates of fair market value for Montana state grazing leases. 1. Hedonic model "typical state lease" (no services, term > 5 years) 2. Competitive bids for state grazing leases BIA Montana Leases Literature review: (Torell, Ghosh, and Fowler, 1988) ratio of public lease forage value to private Note: Standard error for estimate 5. assumes the ratio.70 is a known constant. Page 26
27 3.0 UPDATED DATA RELEVANT TO ANALYSIS This section uses data from to update and expand upon the results from the 1993 report show in Table 4. Updated data is now available on: 1. The National Agricultural Statistic Service estimated average dryland private grazing lease rate per AUM for Montana (as well as for surrounding states) 2. The current lease rates for the sample of Montana trust land grazing leases that are competitively bid (not issued at the minimum rate) 3. Current minimum lease rates for BIA-administered grazing leases on Montana reservations Additionally, new information is available on grazing lease rates set by the Department of the Interior for grazing lands contained within Montana national wildlife refuges. This section provides updated estimates of the current predicted fair market rates based on applying the 1993 hedonic model results to current levels of private lease rates in the state. Finally, the literature-based estimate of state trust land values (Torell, Ghosh and Fowler 1988) is updated using the most recent 2010 private lease rates for Montana. 3.1 National Agricultural Statistics Service Private Grazing Fees The 1993 Montana grazing report utilized several sources of data to construct a time series of private grazing rates in the state. The NASS data only provided 14 years of consistent information on private lease rates in Today that data series has been extended to include 31 years of data. Table 5 shows the average private grazing lease rates for Montana and its surrounding states for the period While there is substantial variation between the private lease rates in the five states, they all show a consistent trend of increasing rates over the period shown. Additionally, Montana rates are generally consistently higher than all but the South Dakota rates (Figure 4). Private land grazing lease rates are important to the analysis of determining the fair market value of state leases for a number of reasons. First, the 1993 Montana grazing survey data and analysis confirmed that the NASS private rates for that year corresponded closely to the reported actual average Montana private lease rates (based on a statewide sample of 243 private lessees and lessors). The NASS private lease rates, therefore, provide a consistent benchmark of how full market value grazing leases in the state have varied over time. A second characteristic of the NASS reported lease rates is that these rates have been adopted by the Federal government for setting minimum grazing rates on national wildlife refuges in the state. Page 27
28 TABLE 5. PRIVATE GRAZING FEE RATES PER AUM FOR NON-IRRIGATED LAND: (SOURCE: JOE SAMSON, STATISTICIAN USDA/NASS ECONOMICS SECTION, PERS. COM. MARCH 14, 2011) Year MONTANA IDAHO NORTH DAKOTA SOUTH DAKOTA WYOMING 1979 $ 7.78 $ 6.47 $ 6.29 $ $ $ 9.07 $ 6.61 $ 6.35 $ $ $ 9.40 $ 8.20 $ 8.69 $ $ $ 8.90 $ 7.98 $ 8.34 $ $ $ 9.23 $ 8.02 $ 7.90 $ $ $ 9.48 $ 7.83 $ 8.23 $ 9.71 $ $ 8.80 $ 6.97 $ 6.97 $ 9.10 $ $ 8.30 $ 7.51 $ 7.63 $ 9.19 $ $ 7.94 $ 6.60 $ 7.41 $ 8.61 $ $ 9.79 $ 6.99 $ 7.67 $ 9.98 $ $ 9.61 $ 6.93 $ 8.26 $ $ $ 9.61 $ 8.42 $ 8.52 $ $ $ $ $ 8.93 $ $ $ $ 9.49 $ $ $ $ $ 9.25 $ $ $ $ $ 9.70 $ 9.75 $ $ $ $ $ $ $ $ $ $ $ $ $ $ $ 9.30 $ $ $ $ $ $ $ $ $ $ $ $ $ $ $ $ $ $ $ $ $ $ $ $ $ $ $ $ $ $ $ $ $ $ $ $ $ $ $ $ $ $ $ $ $ $ $ $ $ $ $ $ $ $ $ $ $ $ $ $ $ $ $ $ $ $ $ In 2010, the average private grazing rate for the state of Montana reported by NASS was $18.40 per AUM Page 28
29 $25.00 $23.00 $21.00 Comparison of Private Grazing Lease Rates per AUM in MT, ID, ND, SD, and WY: Lease Rate per AUM $19.00 $17.00 $15.00 $13.00 $11.00 $9.00 $7.00 $ MONTANA IDAHO NORTH DAKOTA SOUTH DAKOTA WYOMING FIGURE 4. COMPARISON OF NASS PRIVATE GRAZING RATES: U.S. Department of the Interior Grazing fees for CM Russell NWR The 1993 Montana grazing study did not include information on fee levels charged for grazing leases on Federal national wildlife refuges in the state. Conversations with refuge personnel at C.M. Russell NWR confirm that minimum lease rates are set by the Department of Interior for all grazing leases on refuge lands within Montana. For the past several years that rate has been the NASSpublished Montana statewide average private lease rate. Currently the refuge lease rate for Montana is $18.40/AUM. Leases on refuge lands in Montana are one-year leases issued at the discretion of the refuge. Services provided by the landowner include provision of fencing materials, and at some refuges, allowance on the lease rate for costs associated with weed control Personal Communication, Bill Berg, C.M. Russell NWR. March 17, 2011 Page 29
30 3.3 Bureau of Indian Affairs Grazing Fees for Montana Reservations The 1993 Montana grazing report included estimated grazing rates for BIA-administered leases in the state. This estimate was based on 74 BIA leases included in the statewide survey data collected for the study. Additional information from the Fort Peck Reservation for the study confirmed the general range of BIA lease rates at approximately $8.37 per AUM. In recent years the BIA has conducted reservation-specific appraisals of fair market grazing rates in Montana. These fair market values are then used as a basis to set the minimum bid levels for BIA leases. Table 6 shows the current BIA base lease rate per AUM for the 5 Montana reservations in the BIA Rocky Mountain Region. Actual lease rates for many leases on these reservations are for more than the minimum rate reported. The structure of BIA leases is quite comparable to Montana trust land leases, in that the landowner generally provides no services such as fencing, water development, and weed control. Therefore, one would expect competitively bid BIA leases with minimum bid levels that are based on market appraisals to provide a good, comparable benchmark for the fair market value of state trust grazing leases. A simple average of the five reservations shown in Table 6 leads to a base grazing fee of $18.65 per AUM. It should be noted that while market appraisals are the initial basis for BIA setting base rates, the rate of $25/AUM for the Crow Reservation was set by the Tribe. TABLE 6. BUREAU OF INDIAN AFFAIRS MINIMUM REPORTED GRAZING LEASE RATES, BY RESERVATION. Reservation BIA Base Rate/AUM Blackfeet $ Crow $ Ft. Belknap $ Ft. Peck $ N. Cheyenne $ Reservation Average $ DNRC Competitively Bid Trust Land Leases The 1993 Montana grazing study reported the subsample of State of Montana trust land leases that were competitively bid (not issued at the minimum rate) had an average lease value of $8.34/AUM. These competitively bid leases constitute less than 10% of all trust land leases in the state. The 1993 report found that those leases that were competitively bid were not significantly different from other state leases as for as services and land type. Table 7 shows the 2011 summary of competitively bid leases by county. The current average lease value for this subsample of state leases is $14.28/AUM. Page 30
31 TABLE 7. MONTANA DNRC COUNTY-LEVEL STATISTICS FOR COMPETITIVELY BID TRUST LAND GRAZING LEASES. County Average of $/AUM Sum of AUMs Sum of Acres Beaverhead $ ,782 Big Horn $ Blaine $ ,155 3,903 Broadwater $ Carbon $ ,186 Carter $ ,878 Cascade $ ,474 6,112 Chouteau $ ,857 7,770 Custer $ ,974 23,898 Daniels $ ,263 Dawson $ ,677 Deer Lodge $ Fallon $ ,019 Fergus $ ,495 14,111 Flathead $ ,962 Gallatin $ ,099 3,799 Garfield $ ,319 Glacier $ Golden Valley $ Granite $ Hill $ ,038 3,899 Jefferson $ ,290 Judith Basin $ ,230 3,703 Lake $ ,869 Lewis and Clark $ ,318 13,562 Liberty $ ,129 Lincoln $ Madison $ ,413 McCone $ ,013 3,284 Meagher $ Missoula $ ,403 30,418 Musselshell $ ,018 Park $ ,515 Petroleum $ Phillips $ ,746 6,696 Pondera $ ,197 Powder River $ ,708 Powell $ ,560 Ravalli $ ,279 Richland $ ,465 Roosevelt $ ,586 Rosebud $ ,923 Sanders $ ,094 Sheridan $ ,025 Silver Bow $ Stillwater $ ,686 Sweet Grass $ ,181 4,405 Teton $ ,240 4,569 Toole $ ,931 Treasure $ ,583 Valley $ ,413 6,807 Wheatland $ ,049 Wibaux $ ,318 Yellowstone $ ,551 6,297 Total $ , ,270 Page 31
32 4.0 ADDITIONAL ANALYSIS OF TRUST LAND GRAZING LEASE RATES BASED ON UPDATED DATA Section 3, above, provided updated point estimates of several of the Montana grazing rate comparisons discussed in the 1993 Montana grazing report. This section expands on those point estimates by analyzing and discussing similarities and differences among different grazing lease rates in the state within the context of relationships and changes over time. Three perspectives on these relationships are presented: 1. The relationship over time between NASS-published private grazing rates, and the Montana trust land base rate per AUM, 2. The trend in DNRC competitively bid grazing rates over time, and 3. Comparisons of changes in all available grazing rate data between 1993 and 2010/ Analysis of Differences between Montana DNRC Base lease Rates per AUM and NASS Private Average Rates per AUM Consistent data series are available for both the private grazing fee rates published annually by NASS (APPENDIX D), and the base rental rate for Montana trust grazing land (APPENDIX A). Figure 5 shows a graph of those respective rates for the period A comparison of the two data series and their respective trendlines points out two clear and consistent differences between the rates over the time period. First, as noted in the 1993 report, the NASS private grazing fee rate is substantially higher than the DNCR base rate throughout the time period. 11 Additionally, the annual increase in the average private grazing fee is more than double that of the DNRC base rate. 12 The combination of these two trends results in a persistent gap between private and state grazing rates that increases over time. The implication is that state grazing fees on average are falling further and further behind benchmark fair market rates over time. 11 Over the period the private rate per AUM reported by NASS averages 281% of the DNRC base rate per AUM. 12 The private grazing fee per AUM for Montana increases by an average of 34.3 cents per year (95% C.I to 37.8 cents), while the DNRC base rate increase at an average 14.4 cents per AUM per year (95% C.I to 17.2 cents) Page 32
33 $20.00 $18.00 $16.00 Montana Grazing Lease Rates per AUM for Private and State Trust Lands: y = x R² = Lease Rate per AUM $14.00 $12.00 $10.00 $8.00 $6.00 y = 0.144x R² = NASS Montana Private Lease Rate DNRC Trust Land Base Rate $4.00 $2.00 $ Year FIGURE 5. MONTANA GRAZING LEASE RATES PER AUM FOR PRIVATE AND STATE TRUST LANDS: Analysis of Trends in DNRC Grazing Lease Rates for Competitively Bid Leases The 1993 grazing report discussed the small share of state trust grazing lands that are competitively bid in the leasing process. In 2011, DNRC reported that of an estimated 975,766 AUMs of trust land grazing leased, only about 5% of leases, constituting 46,339 AUMs were issued above the base lease rate. Duffield and Anderson in their 1992 statewide grazing survey and analysis found no significant differences in terms of land type and services provided between those state leases that received multiple bids and those that were issued to a single applicant. Before examining potential reasons for the low numbers of competitive bids on state leases, it is of interest to look at the characteristics of the currently held competitively bid state leases. These leases Page 33
34 are issued for up to 10 year terms. Because there are a substantial number of competitively bid leases (402 leases currently), and because a portion of these leases are bid each year, the pool of currently held competitively bid state leases can be examined as a set of 10 samples of leases bid and issued in the years 2002 through Table 8 shows summary information on currently held competitively bid Montana trust land grazing leases. The average lease price for the entire 10 year period is $14.28 per AUM. TABLE 8. MONTANA TRUST LAND COMPETITIVELY BID LEASES, BY YEAR OF LEASE SIGNING (AS OF MARCH 2011) Year Number of Leases Total AUMs Average of $/AUM ,552 $ ,584 $ ,365 $ ,119 $ ,973 $ ,520 $ ,597 $ ,632 $ ,325 $ ,672 $ Total ,339 $ In addition to deriving an average lease rate from the competitively bid lease data, it is possible to estimate the annual trend in winning prices paid for the competitively bid leases over the 10 year period. Figure 6 shows a comparison of average lease prices for competitively bid trust land grazing leases and for private grazing leases in Montana. Also shown in the figure are the estimated linear trendlines for the two series. Annual inflation accounts for about 64 percent of the year to year variation in the average competitively bid lease rate per AUM. Over the 10 year period, average winning lease bids increased an average of 66 cents per AUM year over year. Clearly, as with the NASS private Montana grazing lease rates, the DNRC competitive bids have also seen a consistent upward trend in recent years. Page 34
35 $ per Aum $20.00 $19.00 $18.00 $17.00 $16.00 $15.00 $14.00 $13.00 $12.00 $11.00 $10.00 Comparison of Private Montana and DNRC Competitively Bid Grazing Lease Rates per AUM: DNRC Competitively Bid $/AUM NASS Montana Private Lease Rate y = 0.46x R² = y = x R² = FIGURE 6. CONPARISON OF PRIVATE MONTANA AND DNRC COMPETITIVELY BID GRAZING LEASE RATES PER AUM: Comparison of Montana and Benchmark Grazing Lease Fee Levels: 1992 and 2010 Sections 3 and 4 of this report have discussed previously compiled and current data on public and private land grazing fees for the state of Montana. Table 9 summarizes this information and presents it from two comparative perspectives. First, the grazing fee data are presented as a comparison between the DNRC base grazing lease rate per AUM and the six alternative benchmark grazing rates in the state. Additionally, a comparison is made between lease rates for the DNRC base and alternative benchmark rates for 1992 and the most recent years ( ). These comparisons are discussed in turn for each of the benchmark rates and for the DNRC base rate. Not all of the benchmark grazing rates shown in Table 9 are necessarily strictly comparable to the appropriate lease rates for state trust lands. Different leases are characterized by different levels of landowner services, different durations of the lease, and different land characteristics. The six benchmark estimates are presented to demonstrate the general range of Montana grazing lease rates. Page 35
36 4.3.1 DNRC Montana Base Trust land Grazing Rate Row (A) of Table 9 shows the DNRC base lease rate per AUM for 1992 and for Also shown for this rate (and for the following benchmark rates) are the percent change in this rate from 1992 to 2010, what percent of the NASS Montana private lease rate this state rate was in 1992, and what percent of the private rate it is currently. From 1992 to 2010 the DNRC base rate for grazing increases from $4.17 to $6.23 per AUM. This represents a 49% increase over the period. Between 1992 and 2010 the DNRC base rate decreased as a percent of the NASS-published average private grazing fee for Montana. In 1992 the DNRC base rate was 37% of the private rate, and in 2010 it was 34% of the private rate Hedonic Model Predicted Rate for typical State Trust Land Leases The 1993 Montana grazing fee study utilized collected statewide grazing lease data to estimate a hedonic model of grazing rates in the state. This model was then used to predict the fair market rate for a state trust land lease that had the characteristic of the typical state lease (no landowner provided services, and a lease term of > 5 years). The 1992 predicted fair market rate for a state lease reported by (Duffield and Anderson 1993) was $7.69 per AUM. This rate was 68% of the 1992 NASS private land lease rate for Montana. Using this relationship and current NASS private rates for Montana, leads to an estimated predicted fair market rate for state leases in 2010 of $12.56 per AUM. 13 Because the updated predicted state rate is based off of changes in the NASS private rate, the change in the predicted hedonic rate from 1992 to 2010 is the same as the actual change in the private rate, a 63% increase. The predicted state rate based on the hedonic model is 68% of the private rate for both 1992 and DNRC Competitively Bid Lease Rates The average price of the sub-population of state trust land leases that received competitive bids when awarded has grown substantially from 1992 to In 1992 the average rate for competitively bid leases was $8.34 per AUM. As of March 2011 this average rate was $14.28 per AUM. The average rate of the winning bids for competitive state leases increased 71% from 1992 to In 1992 the average competitive bid rate was 74% of the NASS private lease rate, and in 2010, this had increased to 78% of the private lease rate per AUM National Agricultural Statistics Service Montana Private Grazing Rates NASS-reported private lease grazing fees for Montana increased 63% from 1992 to 2010, from $11.27 to $18.40 per AUM. 13 This estimate is based on the assumptions that the underlying relationship between the true value of state and private leases has not change significantly over this period. Conversations with DNRC personnel indicate that the structure of state leases has remained generally unchanged in respect to the key factors incorporated in the hedonic model over the relevant years. Page 36
37 4.3.5 Department of the Interior Montana National Wildlife Refuge Rates The 1993 Montana grazing report did not include information on grazing rates for national wildlife refuges within the state. This information is now available, and provides a new benchmark for comparison to state lease rates. As previously noted, the DOI-administered rates for Montana national wildlife refuges are based on the NASS private grazing rate (currently $18.40/AUM). 14 These leases differ from state leases in that they are one-year leases, and there is landowner participation in land management and improvements Bureau of Indian Affairs Montana reservation Land grazing Rates The 1993 grazing report found an average lease rate for BIA-administered grazing lease in Montana of $8.37/AUM. The current average lease rate across the five reservations administered by the BIA Rocky Mountain Region is $18.65/AUM. This represents a 123% increase in estimated BIA lease rates per AUM from 1992 to In 1992 it was estimated that BIA rates were 74% of NASS private rates. In 2010 it is estimated that grazing rates on BIA-administered lands are on average 101% of private rates. As noted, BIA-administered grazing leases are similar in structure and services to state of Montana trust land leases Literature Review-Based Estimate of Fair Value Trust Land Leases A final perspective on a fair market rate was provided by Duffield and Anderson (1993) based on their review of the economics literature. New Mexico researchers (Torell, Ghosh and Fowler 1988) found that about 30% of the amount paid for private market grazing leases was for services (such as fencing, water, weed control) This suggests that (applying the New Mexico results to Montana) the fair market rate for state trust lands can be approximated as 70% of the NASS average private market rate. In 1992, 70% of the NASS private rate was $8.30 per AUM. In 2010, this value was $12.88 per AUM BLM and USFS (1978 PIRA) Rates A final point of comparison is the federal grazing rate for 16 western states set annually by the BOM and USFS. This rate (set by formula) was $1.92/AUM in 1992 and is $1.35/AUM in The federal rate has been a source of considerable controversy, and today stands in stark contrast to other Montana rates such as the BIA and DOI (national wildlife refuge) rates. 14 The Montana DFWP also uses the NASS private grazing rater as an initial basis for setting grazing fees on state Wildlife Management Area lands. For new WMA leases, FWO charges the NASS rate unless either 1) the lessee is required to perform significant fence installation or maintenance (in which case the DNRC rate is charged, or 2) the lease is a component of a larger exchange of use agreement with the lessee (Per. Comm. Steve Knapp, Wildlife Habitat Section Supervisor, DFWP. April 14, 2011). Page 37
38 TABLE 9. COMPARISON OF MONTANA GRAZING LEASE RATES PER AUM: 1992 AND Estimate/rate % Change % of Private 1992 Rate % of Private 2010 Rate (A) DNRC Base Rate $ 4.17 $ % 37% 34% (B) Private Rate (NASS) $ $ % (C) Montana (DNRC) Specific Estimates (1) Hedonic model (typical state lease) Rate $ 7.69 $ % 68% 68% (2) DNRC Competitive Bids $ 8.34 $ % 74% 78% (3) Economics Literature Torell et al. (1988) $ 8.30 $ % 74% 70% (D) Federal Rates (1) CMR (DOI) $ % (2) BIA $ 8.37 $ % 74% 101% (3) BLM & USFS (1978 PIRA) $ 1.92 $ % 17% 7% Page 38
39 5.0 CONCLUSIONS AND RECOMMENDATIONS ON GRAZING LEASE VALUATION METHODS AND LEVELS The 1993 Montana grazing study (Duffield and Anderson 1993) presented as its overall conclusion regarding the appropriate state trust lease rates the following: As a result of an intensive (and extensive) survey of Montana ranchers concerning grazing lease rates and four additional methods of analysis, we conclude that current state lease rates are much lower than current fair market value. Lease rates on Montana DSL grazing leases currently average $4.24 per AUM. The preceding analysis suggests that fair market value for these leases is on the order of $7.50 to $8.50 per AUM. (Duffield and Anderson 1993, ES-7) The 1993 analysis estimated that an appropriate level for state land lease rates in that year was between 66% and 75% of private lease rates. The analysis presented in this report updates and expands on the 1993 study and results. Table 9 shows four alternative classes of Montana grazing lease fees. Class (A) is the DNRC base rate, Class (B) is the NASS private lease rate, Class (C) includes rates based on DNRC-specific data or estimates, and Class (D) includes federally set rates. Of these groups, the estimates in Class (C) provide the most appropriate guidance in determining fair market levels for Montana trust land leases. This updated analysis suggests fair market rates for DNRC trust land grazing leases (expressed as a percentage of the NASS-published average annual Montana private grazing lease rate), should be on the order of 70% to 80% of private grazing rates. The recommendation of this report would be to increase Montana trust land grazing leases to 70% of annual NASS private rates initially in order to give time for lessees to transition to the new higher leases. The best measure of whether this lease rate level continues to be less than the prevailing fair market rate for comparable leases will be the extent to which trust land leases go vacant at the 70% of private level. If few leases go unsold at the 70% level, DNRC could look toward raising the DNRC/Private ratio to 75% -80% in the future. Page 39
40 6.0 DISCUSSION OF LIMITATIONS OF ANALYSIS AND ADDITIONAL CONSIDERATIONS The 1993 Montana grazing study was a comprehensive analysis of grazing lease valuation in Montana, including statewide original data collection and analysis and participation and peer review by a wide spectrum of industry, agency and academic experts on grazing issues, survey design and statistical analysis. This report uses the 1993 study as a base reference point upon which to update and expand the analysis consistent with the structure of the original report. The results presented in section 5, above, suggests that in the intervening 18 years between the completion of the 1993 study and this report State of Montana trust land grazing lease rates have consistently lagged behind what other evidence suggests should be the fair market value of these rates. This updated analysis is limited in several ways. However, this analysis also provides additional estimates of Montana grazing rates that strengthen the 1993 conclusions. The updated predicted fair market value of a typical Montana trust land grazing lease from the 1993 hedonic model is constrained in that the estimate is not based on 2010 data, but rather on data collected in 1992 and applied to 2010 average private lease rates for the state. To the extent that the general characteristics of different classes of leases in the state may have changed significantly between 1992 and 2010, the accuracy and applicability of this estimate may be limited. The authors of the 1993 report found that competitively bid state trust leases did not differ from those not receiving multiple bids with regard to land type and services provided. The 2011 average lease price for these competitively bid leases of $15.04 per AUM is presented as a benchmark comparison point on the assumption that these leases are currently not significantly different from other DNRC leases with regard to characteristics generally found to impact lease value. The current updated analysis strengthens the 1993 findings with the inclusion of lease rates charged by DOI for leases on Montana national wildlife refuge lands. These rates (currently set at the state NASS private lease rate) provide an additional perspective and benchmark for comparison that was not available in the 1993 study. 6.1 Competitively Bid vs. Non-Competitive DNRC Leases As discussed previously, about 5% of DNRC grazing leases currently not issued at the minimum rate during the lease bidding process. Also, as noted, the average lease price for the sub-group of competitively bid state leases is nearly 2.5 times the base price for the remaining 95% of state leases. On the surface, there appears to be a logical contradiction between the primary conclusion of this study (and the 1993 study before it) and market evidence from the leasing process. Our analysis Page 40
41 suggests that Montana state trust lands have a base price that is set significantly below a fair market price for the resource. However, within a market auction setting the vast majority of these lands are not valued above this low base price. The 1993 grazing report survey asked several questions that explain these seemingly contradictory conclusions. Duffield and Anderson found in their survey data that 29% of state land leases were unfenced parcels and inholdings wholly surrounded by land owned or controlled by the lessee. This 29% of state leases is therefore not suitable for competitive bidding. The 1993 grazing survey also asked ranchers a question on their willingness to bid against neighbors for state land leases. The question asked was, Suppose that there was a state lands grazing lease in your area that could work well in your livestock operation, but the lease is currently held by a neighbor. At the time of lease renewal, would you submit a competitive bid? Over 55% of ranchers responded that they would NOT submit a competing bid against a neighbor. Only 21.8% said they definitely would under the hypothetical situation presented. The combination of the 5% of DNRC leases that are currently competitively bid, the estimated 29% that are unfenced inholdings unsuitable for competitive bid, and the strong reluctance expressed by over 55% of surveyed ranchers to submit a competing bid against a neighbor, even if a state parcel fit in well with their operation, suggests that a significant share of state grazing leases cannot be competitively bid. This underscores the need to provide another approach for setting fair market lease prices, which is the point of the current analysis. Page 41
42 BIBLIOGRAPHY Ashenfelter, O. and C. Rouse, "Income, Schooling, And Ability: Evidence From A New Sample Of Identical Twins," The Quarterly Journal of Economics, MIT Press, vol. 113(1), pages , February. Bartlett, E.T., J.R. McKean and W. Winger. Grazing Lease Fee Arrangements of Western Governments and Agencies for Study of Western State, Local Governments, and Other Federal Agencies Grazing Leasing Arrangements and User Charges. USDA Forest Service, COlorado State University, Borman, M.E. and D.E. Johnson. "Evolution of Grazing and Land Tenure Policies on Public Lands." Rangelands, 1990: Duffield, J., and B Anderson. Economic Analysis of the Values of Surface Uses of Stste Lands. Helena: Montana Department of State Lands, General Accounting Office Livestock Grazing: Federal Expenditures and Receipts Vary, Depending on the Agency and the Purpose of the Fee Charged. Report to Congressional Requesters. Spetember GAO : 109 pp. Rosen, J. "Hedonic Prices and Implicit Markets: Product Differentiation in Pure Competition." Journal of Political Economy, 1974: Rouse, L.R. Final Report, Rangeland Survey for the State Land Board (Colorado). Colorado State Land Board, Souder, J. "Economic Strategies for the Management of School and Institutional Trust Lands: A Comparative Study of Ten Western States." Ph.D. Dissertation, University of California at Berkeley. Berkeley, Souder, J., and S. Fairfax. "The State School Trust Lands." Annual Meeting of the Western Political Science Association. Newpoer Beach, CA, Souder, J., and S. Fairfax. Western States Trust and Sovereign Lands Survey Results. Project #4548- H, Berkeley: Agricultural Experiment Station, University of California at Berkeley, Torell, L. A., and J.P. Doll. "Public Land Policy and the Value of Grazing Permits." Western Journal of Agricultural Economics, 1991: Torell, L., Rimbey, N., Van Tassell, L., Tanaka, J., Bartlett, T. "An Evaluation of the Federal Grazing Fee Formula." Journal of Range Management, 2003: Page 42
43 Torell, L.A., S. Ghosh, and J.M. Fowler. Economic Considerations for Setting Grazing Fees on New Mexico State Trust Lands. Special Report 81, New Mexico State University Agricultural Experiment Station, U.S. Department of Agriculture and the Department of Interior. "Grazing Fee Review and Evaluation, Update of the 1986 Final Report." USDA National Agricultural Statistics Service. Private Grazing Fee Rates: Average Rates by Method of Payment, Montana, USA (accessed February 16, 2011). Workman, J.P. "Federal grazing Fees: a Controversy that Won't Go Away." Rangelands, 1988: Page 43
44 APPENDIX A: HISTORICAL STATE OF MONTANA TRUST LAND GRAZING LEASE BASE RATES Page 44
45 Page 45
46 APPENDIX B: MARCH 2011 COMPETITIVELY BID DNRC GRAZING LEASES Page 46
47 Lease # County $/AUM Terms Efftective Date AUMs Acres 3952 Beaverhead $7.32 3/1/ Beaverhead $ /1/ Big Horn $ /12/ Big Horn $ /1/ Big Horn $ /1/ Big Horn $9.00 5/5/ Big Horn $ /1/ Blaine $6.26 7/24/ Blaine $6.23 3/1/ Blaine $ /9/ Blaine $ /1/ Blaine $ /1/ Blaine $ /1/ Blaine $ /1/ Blaine $ /1/ Broadwater $ /1/ Broadwater $9.00 3/1/ Carbon $7.11 3/1/ Carbon $8.77 3/1/ Carbon $9.77 3/1/ Carbon $ /1/ Carbon $6.80 9/6/ Carbon $ /1/ Carbon $ /1/ Carbon $ /1/ Carter $ /1/ Carter $ /1/ Carter $ /2/ Carter $ /1/ Carter $ /1/ Cascade $ /1/ Cascade $ /20/ Cascade $ /25/ Cascade $ /1/ Cascade $ /1/ Cascade $ /18/ Cascade $6.23 7/27/ Cascade $7.50 3/1/ Cascade $6.64 3/1/ Page 47
48 Lease # County $/AUM Terms Efftective Date AUMs Acres 9509 Cascade $ /1/ Cascade $9.98 3/1/ Cascade $6.85 1/4/ Cascade $ /1/ Cascade $8.00 6/11/ Cascade $ /1/ Cascade $ /22/ Cascade $ /30/ Cascade $ /1/ Cascade $ /11/ Cascade $ /1/ Cascade $ /1/ Cascade $ /1/ Cascade $ /1/ Chouteau $7.50 3/1/ Chouteau $ /1/ Chouteau $6.50 3/1/ Chouteau $ /1/ Chouteau $ /1/ Chouteau $ /1/ Chouteau $ /5/ Chouteau $7.00 6/23/ Chouteau $ /1/ Chouteau $7.15 3/1/ Chouteau $7.15 3/1/ Chouteau $7.00 5/4/ Chouteau $ /1/ Chouteau $ /1/ Chouteau $ /1/ Chouteau $8.00 3/1/ Chouteau $ /1/ Chouteau $6.37 3/1/ Chouteau $7.00 3/1/ Chouteau $ /1/ Custer $9.02 3/1/ Custer $ /1/ Custer $6.50 3/1/ Custer $ /1/ Custer $ /1/ Page 48
49 Lease # County $/AUM Terms Efftective Date AUMs Acres 7406 Custer $8.00 3/1/ Custer $ /1/ Custer $ /1/ Custer $ /1/ Custer $ /31/ Custer $ /1/ Custer $ /1/ Custer $ /1/ Custer $ /1/ Custer $ /1/ Custer $ /1/ Daniels $ /5/ Daniels $ /1/ Daniels $ /1/ Daniels $9.50 7/3/ Dawson $ /1/ Dawson $ /1/ Dawson $ /5/ Dawson $ /1/ Dawson $7.87 3/1/ Dawson $7.00 7/7/ Deer Lodge $6.94 5/8/ Fallon $ /1/ Fallon $ /1/ Fallon $ /1/ Fallon $6.23 9/27/ Fallon $ /1/ Fallon $ /1/ Fergus $8.00 3/1/ Fergus $ /1/ Fergus $8.00 3/1/ Fergus $ /1/ Fergus $8.00 3/1/ Fergus $ /1/ Fergus $8.00 3/1/ Fergus $ /1/ Fergus $ /1/ Fergus $ /1/ Fergus $ /1/ Page 49
50 Lease # County $/AUM Terms Efftective Date AUMs Acres Fergus $6.65 3/1/ Fergus $ /10/ Fergus $ /1/ Fergus $ /1/ Fergus $ /1/ Fergus $ /1/ Fergus $ /1/ Fergus $ /1/ Fergus $ /1/ Fergus $ /1/ Fergus $ /1/ Fergus $ /1/ Flathead $6.23 6/28/ Flathead $ /22/ Flathead $ /1/ Flathead $6.23 5/11/ Flathead $ /1/ Gallatin $ /1/ Gallatin $ /1/ Gallatin $6.23 3/1/ Gallatin $7.48 3/1/ Gallatin $9.37 3/1/ Gallatin $ /1/ Gallatin $ /1/ Gallatin $6.99 3/1/ Gallatin $9.00 3/1/ Gallatin $ /1/ Gallatin $6.94 3/1/ Gallatin $ /1/ Gallatin $ /2/ Gallatin $ /27/ Gallatin $7.12 3/1/ Garfield $ /1/ Garfield $7.08 3/1/ Garfield $8.00 8/12/ Garfield $6.23 8/13/ Garfield $ /1/ Garfield $ /1/ Garfield $ /1/ Page 50
51 Lease # County $/AUM Terms Efftective Date AUMs Acres 4051 Glacier $ /1/ Glacier $ /1/ Golden Valley $ /1/ Golden Valley $ /1/ Granite $ /1/ Granite $ /1/ Granite $ /5/ Hill $8.45 3/1/ Hill $ /21/ Hill $ /1/ Hill $ /1/ Hill $ /12/ Hill $9.00 3/1/ Hill $ /1/ Hill $ /1/ Hill $ /11/ Hill $ /1/ Jefferson $ /1/ Jefferson $ /1/ Jefferson $8.07 7/30/ Jefferson $8.33 3/1/ Jefferson $ /1/ Judith Basin $7.50 3/1/ Judith Basin $ /1/ Judith Basin $ /1/ Judith Basin $ /1/ Judith Basin $ /21/ Judith Basin $ /1/ Judith Basin $ /1/ Judith Basin $ /1/ Judith Basin $ /1/ Judith Basin $ /1/ Lake $7.12 3/21/ Lake $ /1/ Lewis and Clark $9.25 3/1/ Lewis and Clark $7.20 7/24/ Lewis and Clark $6.23 6/5/ Lewis and Clark $ /1/ Lewis and Clark $ /1/ Page 51
52 Lease # County $/AUM Terms Efftective Date AUMs Acres 2006 Lewis and Clark $9.00 3/1/ Lewis and Clark $ /1/ Lewis and Clark $ /1/ Lewis and Clark $ /1/ Lewis and Clark $8.25 3/1/ Lewis and Clark $ /1/ Lewis and Clark $7.00 8/11/ Lewis and Clark $7.20 3/1/ Lewis and Clark $8.00 4/28/ Lewis and Clark $ /1/ Lewis and Clark $ /1/ Liberty $ /1/ Liberty $ /1/ Liberty $ /1/ Lincoln $7.00 8/5/ Lincoln $ /1/ Madison $6.87 3/1/ Madison $ /25/ Madison $9.00 3/1/ Madison $8.64 3/1/ Madison $ /1/ Madison $ /1/ Madison $ /1/ Madison $ /1/ Madison $ /1/ Madison $ /1/ Madison $ /1/ Madison $6.23 8/2/ McCone $9.00 3/1/ McCone $9.00 3/1/ McCone $ /22/ McCone $8.00 7/11/ McCone $ /1/ McCone $ /1/ McCone $ /1/ McCone $ /1/ McCone $ /1/ Meagher $ /1/ Meagher $ /1/ Page 52
53 Lease # County $/AUM Terms Efftective Date AUMs Acres 9570 Meagher $ /1/ Meagher $ /1/ Missoula $ /1/ Missoula $ /1/ Missoula $8.36 3/1/ Missoula $7.05 3/1/ Missoula $ /1/ Missoula $8.75 1/1/ Missoula $8.75 1/1/ Missoula $8.75 1/1/ Missoula $8.75 1/1/ Missoula $8.75 1/1/ Missoula $8.75 1/1/ Musselshell $ /1/ Musselshell $ /1/ Musselshell $ /1/ Musselshell $ /1/ Musselshell $ /1/ Park $ /1/ Park $ /1/ Park $ /1/ Park $ /1/ Petroleum $6.23 7/21/ Petroleum $9.96 3/1/ Phillips $6.50 7/24/ Phillips $ /1/ Phillips $ /5/ Phillips $ /26/ Phillips $6.23 3/1/ Phillips $7.87 3/1/ Phillips $ /1/ Phillips $ /1/ Phillips $7.10 4/28/ Phillips $6.23 3/1/ Phillips $6.50 3/1/ Phillips $6.23 4/7/ Phillips $6.62 5/28/ Pondera $ /1/ Pondera $7.00 3/1/ Page 53
54 Lease # County $/AUM Terms Efftective Date AUMs Acres Pondera $ /12/ Pondera $ /1/ Pondera $ /1/ Pondera $ /1/ Pondera $ /1/ Pondera $ /1/ Pondera $ /1/ Pondera $ /1/ Powder River $7.50 3/1/ Powder River $8.00 3/1/ Powder River $ /6/ Powder River $ /1/ Powell $ /1/ Powell $6.23 6/12/ Powell $8.25 3/1/ Powell $8.63 7/20/ Powell $8.50 3/1/ Powell $8.50 3/1/ Ravalli $6.50 3/1/ Ravalli $ /1/ Richland $ /1/ Richland $7.48 3/1/ Richland $6.23 8/12/ Richland $ /1/ Richland $7.00 3/23/ Richland $ /9/ Richland $ /31/ Richland $ /1/ Roosevelt $ /1/ Roosevelt $6.23 3/1/ Roosevelt $ /29/ Roosevelt $ /1/ Roosevelt $ /1/ Roosevelt $ /1/ Roosevelt $ /1/ Rosebud $9.00 3/1/ Rosebud $6.50 8/1/ Rosebud $6.23 3/1/ Rosebud $7.48 8/13/ Page 54
55 Lease # County $/AUM Terms Efftective Date AUMs Acres Rosebud $6.23 8/25/ Rosebud $ /1/ Rosebud $ /27/ Rosebud $6.50 3/1/ Sanders $8.50 3/1/ Sanders $6.23 6/27/ Sanders $6.23 3/1/ Sanders $ /1/ Sanders $9.00 3/1/ Sheridan $ /1/ Sheridan $ /1/ Sheridan $ /1/ Sheridan $ /1/ Sheridan $8.00 1/5/ Sheridan $8.97 4/22/ Sheridan $ /1/ Silver Bow $ /1/ Silver Bow $ /1/ Silver Bow $ /6/ Stillwater $8.00 3/1/ Stillwater $7.00 3/1/ Stillwater $8.00 6/5/ Stillwater $8.00 3/1/ Stillwater $ /1/ Stillwater $7.26 3/1/ Sweet Grass $ /1/ Sweet Grass $ /1/ Sweet Grass $ /1/ Sweet Grass $ /12/ Sweet Grass $ /1/ Sweet Grass $ /1/ Sweet Grass $ /1/ Sweet Grass $ /1/ Teton $ /1/ Teton $ /25/ Teton $7.50 3/1/ Teton $7.50 3/1/ Teton $ /1/ Teton $ /1/ Page 55
56 Lease # County $/AUM Terms Efftective Date AUMs Acres 3643 Teton $ /1/ Teton $7.89 4/8/ Teton $ /8/ Teton $8.00 3/1/ Teton $ /1/ Teton $ /1/ Toole $8.00 7/8/ Toole $ /1/ Toole $ /1/ Toole $8.00 3/1/ Toole $7.00 3/1/ Toole $7.00 8/12/ Toole $ /1/ Toole $ /1/ Toole $ /1/ Toole $ /1/ Toole $ /1/ Treasure $ /27/ Valley $9.44 3/1/ Valley $7.77 3/1/ Valley $ /1/ Valley $ /1/ Valley $ /1/ Valley $ /1/ Valley $ /1/ Valley $ /1/ Wheatland $ /1/ Wheatland $ /1/ Wheatland $ /1/ Wheatland $ /1/ Wibaux $ /1/ Wibaux $ /1/ Wibaux $ /27/ Wibaux $8.00 3/1/ Wibaux $ /1/ Wibaux $ /1/ Yellowstone $7.00 3/1/ Yellowstone $8.50 3/1/ Yellowstone $ /8/ Page 56
57 Lease # County $/AUM Terms Efftective Date AUMs Acres Yellowstone $ /22/ Yellowstone $ /1/ Yellowstone $ /1/ Yellowstone $ /1/ Yellowstone $ /1/ Yellowstone $ /1/ Yellowstone $ /1/ Yellowstone $ /5/ Yellowstone $ /1/ Yellowstone $9.68 3/1/ Yellowstone $ /1/ Yellowstone $7.36 6/15/ Page 57
58 APPENDIX C: COMMUNICATION ON BIA GRAZING LEASE RATES Page 58
59 Chris, I don t have average prices but here are the rates I do have for reservations in Montana, Wyoming, and Idaho. The minimum AUM rental rates on the following reservations: Blackfeet Crow (tribally determined) Fort Belknap Fort Peck N. Cheyenne Wind River Wyo Ft. Hall Idaho Hope this helps, Dave Hopkins BIA-Rocky Mountain Regional Office 316 N 26 th St Billings, Mt From: Chris Neher [mailto:bioecon@montana.com] Sent: Tuesday, March 15, :44 PM To: Hopkins, David Subject: Grazing Lease Rates Hi Dave, Thanks for chatting with me. To recap, we are working on a contract for MT DNRC to look at the pricing of state trust grazing lease rates. I am looking at other leases in the state to set some benchmark lease rates for comparison. I would be interested in getting from you: 1) the minimum bid per AUM for each of the reservations you have data on, and 2) if available, the average price per AUM by reservation for current leases. Also, the typical terms of the leases would be helpful to me. Thanks for any help you can provide. Chris Chris Neher Bioeconomics, Inc. 315 S. 4th Street E. Missoula, MT (406) Page 59
60 APPENDIX D: NASS MONTANA PRIVATE GRAZING FEES Page 60
61 PRIVATE GRAZING FEE RATES: Average Rates by Method of Payment 1/, Montana, USA Last updated January 31, 2011 Year Animal Unit 2/ Cow-Calf Per Head Dollars Per Month 1/ Non-irrigated grazing land. 2/Includes animal unit plus cow-calf rates. Cow- calf rate converted to animal unit (AUM) using (1 aum= cow-calf *0.833). 2/ Insufficient reports to compute average Page 61
62 Page / /
63 APPENDIX E: ADDITIONAL AND SUPPORTING ANALYSIS Page 63
64 TABLE 10. COMAPRISON OF NASS PRIVATE MONTANA LEASE RATES AND DNRC TRUST LAND BASE RATES: IN CONSTANT 2010 DOLLARS Year NASS Private Montana Lease Rate (constant 2010 $) DNRC Trust Land Base Rate (constant 2010 $) 1980 $ $ $ $ $ $ $ $ $ $ $ $ $ $ $ $ $ $ $ $ $ $ $ $ $ $ $ $ $ $ $ $ $ $ $ $ $ $ $ $ $ $ $ $ $ $ $ $ $ $ $ $ $ $ $ $ $ $ $ $ $ $ 6.12 Page 64
65 $25.00 $20.00 Montana Grazing Lease Rates per AUM for Private and State Trust Lands: Constant 2010 Dollars y = x R² = $15.00 $10.00 NASS Private Montana Lease Rate DNRC Trust Land Base Rate $5.00 y = x R² = $ FIGURE 7. COMPARISON OF MONTANA PRIVATE AND DNRC BASE GRAZING RATES IN CONSTANT 2010 DOLLARS TABLE 11. COMPARISON OF PRIVATE AND DNRC AVERAGE COMPETITIVELY BID LEASE RATES: IN CONSTANT 2010 DOLLARS DNRC Competitively Bid $/AUM (constant 2010 $) NASS Montana Private Lease Rate (constant 2010 $) Year 2002 $ $ $ $ $ $ $ $ $ $ $ $ $ $ $ $ $ $ Page 65
66 $20.00 $19.00 $18.00 $17.00 $16.00 Comparison of Private Montana and DNRC Competitively Bid Grazing Lease Rates per AUM: Constant 2010 Dolars y = x R² = $ / AUM $15.00 $14.00 $13.00 $12.00 y = x R² = DNRC Competitively Bid $/AUM $11.00 $10.00 NASS Montana Private Lease Rate FIGURE 8. COMPARISON OF PRIVATE AND DNRC COMPETITIVELY BID LEASE RATES: IN CONSTANT 2010 DOLLARS Page 66

67 TABLE GAO REPORT STATE AND FEDERAL GRAZING LEASE RATES Page 67
68 Page 68
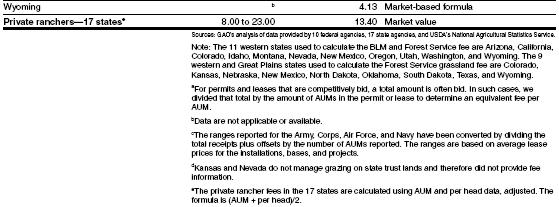
69 Page 69
PUBLIC GRAZING IN THE WEST: THE IMPACT OF RANGELAND REFORM 94
 PUBLIC GRAZING IN THE WEST: THE IMPACT OF RANGELAND REFORM 94 Jeffrey T. LaFrance 1 INTRODUCTION The general public seems to believe that public lands ranchers pay substantially less for livestock grazing
A COMPARATIVE STUDY OF GRAZING FEES ON MONTANA PUBLIC SCHOOL LANDS AND OTHER GRAZING LANDS IN MONTANA KENNETH L. SIDERIUS
 A COMPARATIVE STUDY OF GRAZING FEES ON MONTANA PUBLIC SCHOOL LANDS AND OTHER GRAZING LANDS IN MONTANA BY KENNETH L. SIDERIUS Submitted in partial fulfillment of the requirements for the Master of Education
The Economics of Grazing Livestock on Public Lands
 Utah State University DigitalCommons@USU Economic Research Institute Study Papers Economics and Finance 1991 The Economics of Grazing Livestock on Public Lands Darwin Nielsen Utah State University Follow
LIMITED-SCOPE PERFORMANCE AUDIT REPORT
 LIMITED-SCOPE PERFORMANCE AUDIT REPORT Agricultural Land Valuation: Evaluating the Potential Impact of Changing How Agricultural Land is Valued in the State AUDIT ABSTRACT State law requires the value
OTHER FREQUENTLY ASKED QUESTIONS
 OTHER FREQUENTLY ASKED QUESTIONS 1) CAN I BUY STATE LEASE LAND? Generally, no the Commissioner s policy is to retain state ownership of all state trust land absent extenuating circumstances. 2) HOW DO
MODERNIZING ALBERTA S PUBLIC LAND GRAZING FRAMEWORK
 Frequently Asked Questions: 1) Question: Who does this rate calculation change apply to? Answer: Grazing dispositions affected by rental rate changes include grazing leases (GRL) grazing licences (FGL)
DETAILED ANALYSIS. Wyoming Board of Land Commissioners. Consideration for Disposal of State Trust Land. Prepared on July 11, 2014
 WYOMING OFFICE OF STATE LANDS AND INVESTMENTS 122 West 25 th Street Cheyenne, WY 82002 Phone: 307.777.7331 Fax: 307.777.3524 slfmail@wyo.gov MATTHEW H. MEAD Governor BRIDGET HILL Director DETAILED ANALYSIS
February 12, 2009 BOARD MATTER H 2 CHASE FARMS SALE PROPOSAL IN SHERIDAN COUNTY, WYOMING
 February 12, 2009 BOARD MATTER H 2 ACTION: CHASE FARMS SALE PROPOSAL IN SHERIDAN COUNTY, WYOMING AUTHORITY: W.S. 36-9-101; Rules Chapter 26, Section 4 ALTERNATIVES: Authorize the Land Sale, Establish the
ALBERTA GRAZING LEASE 2005 IN-KIND COST SURVEY RESULTS
 ALBERTA GRAZING LEASE 2005 IN-KIND COST SURVEY RESULTS NOVEMBER 15, 2007 2007 Redstone Management Consulting Ltd. 1 INTRODUCTION ALBERTA GRAZING LEASE 2005 IN-KIND COST SURVEY RESULTS Redstone Management
SRD Grazing Lease Rental Rates
 SRD Grazing Lease Rental Rates Special Areas Spring Advisory Council April 2 nd, 2009 Agenda Scope Background Options and Examples Cost Survey Two Options Preferred Rent Structure Questions 1 Developing
February 2, 2012 BOARD MATTER C - 1 WYOMING LAND AND IMPROVEMENT COMPANY, PROPOSAL TO ACQUIRE REAL PROPERTY IN ALBANY COUNTY, WYOMING
 February 2, 2012 BOARD MATTER C - 1 ACTION: WYOMING LAND AND IMPROVEMENT COMPANY, PROPOSAL TO ACQUIRE REAL PROPERTY IN ALBANY COUNTY, WYOMING AUTHORITY: W.S. 9-4-715(k); Rules Chapter 26, Section 3 ALTERNATIVES:
AN EVALUATION OF THE PRIA GRAZING FEE FORMULA
 AN EVALUATION OF THE PRIA GRAZING FEE FORMULA L. Allen Torell 1, Neil R. Rimbey 2, E. Tom Bartlett 3, Larry W. Van Tassell 4, and John A. Tanaka 5 Paper presented at the Annual Meeting of the Society for
Grazing Disposition Royalty Proposal Alberta Environment and Parks
 Grazing Disposition Rental Rates and Assignment Fees on Agricultural Public Lands Background In 1960 the province of Alberta created a public land grazing disposition framework based around a three zone
Exploring Ecosystem Services on State Trust Lands in the West
 Exploring Ecosystem Services on State Trust Lands in the West Rocky Mountain Land Use Institute Conference Denver, CO March 2, 2012 Susan Culp, Project Manager The Sonoran Institute inspires and enables
Current Grazing Practices and the Relationship to Communities
 Current Grazing Practices and the Relationship to Communities 143 Frank Eathorne Thunder Basin Grazing Association Within the boundaries the Thunder Basin Grasslands Prairie Ecosystem Association (TBGPE)
Agricultural Leasing in Maryland
 Agricultural Leasing in Maryland By: Paul Goeringer, Research Associate, Center for Agricultural and Natural Resource Policy Note: This publication is intended to provide general information about legal
DRAFT REVISED NORTHERN CHEYENNE LAW & ORDER CODE TITLE 21 GRAZING ORDINANCE
 DRAFT REVISED NORTHERN CHEYENNE LAW & ORDER CODE TITLE 21 GRAZING ORDINANCE TITLE 21 TRIBAL GRAZING CODE TABLE OF CONTENTS DEFINITIONS CHAPTER 1 CHAPTER 2 CHAPTER 3 CHAPTER 4 CHAPTER 5 CHAPTER 6 CHAPTER
GENERAL ASSESSMENT DEFINITIONS
 21st Century Appraisals, Inc. GENERAL ASSESSMENT DEFINITIONS Ad Valorem tax. A tax levied in proportion to the value of the thing(s) being taxed. Exclusive of exemptions, use-value assessment laws, and
AGRICULTURAL LEASING STUDY
 AGRICULTURAL LEASING STUDY Montana Department of Revenue AUGUST 8, 2014 Montana State University-Extension TABLE OF CONTENTS Introduction... 1 Methods... 1 Data Collection... 1 Questionnaire... 2 Analysis...
Summary of State Trust Land Revenue
 Summary of State Trust Land Revenue Data as of June 30, 2010 Narrative Summary: Attached are summary schedules of revenues earned on state trust lands for the period ending June 30, 2010. These schedules
Measuring the Scope of Federal Land Ownership
 Measuring the Scope of Federal Land Ownership Angela Logomasini During much of American history, landuse regulation was not a federal issue. The American system was biased against an active federal role
Pasture Leases. Overview. Overview. Finding and assessing land/tenants. What to include in the lease. Type of leases
 Pasture Leases Kate Binzen Fuller, Ph.D Ag Economics Extension Specialist Montana State University Overview Finding and assessing land/tenants What to include in the lease Type of leases Lease rates: Information
Additionality in Conservation Easements Programs: Grassland Easements in the Prairie Pothole Region
 Additionality in Conservation Easements Programs: Grassland Easements in the Prairie Pothole Region Jeffrey Savage, USDA-ERS, jsavage@ers.usda.gov Roger Claassen, USDA-ERS Vince Breneman, USDA-ERS Chuck
Regression Estimates of Different Land Type Prices and Time Adjustments
 Regression Estimates of Different Land Type Prices and Time Adjustments By Bill Wilson, Bryan Schurle, Mykel Taylor, Allen Featherstone, and Gregg Ibendahl ABSTRACT Appraisers use puritan sales to estimate
Trends in Affordable Home Ownership in Calgary
 Trends in Affordable Home Ownership in Calgary 2006 July www.calgary.ca Call 3-1-1 PUBLISHING INFORMATION TITLE: AUTHOR: STATUS: TRENDS IN AFFORDABLE HOME OWNERSHIP CORPORATE ECONOMICS FINAL PRINTING DATE:
Agricultural Leasing Study
 Agricultural Leasing Study Agricultural Marketing Policy Center Linfield Hall P.O. Box 172920 Montana State University Bozeman, MT 59717-2920 Tel: (406) 994-3511 Fax: (406) 994-4838 Email: ampc@montana.edu
Application for 1-d-1 (Open-Space) Agricultural Use Appraisal
 Agricultural Use Appraisal") Application for 1-d-1 (Open-Space) Agricultural Use Appraisal Texas Comptroller of Public Accounts Travis Central Appraisal District (512) 834-9138 Appraisal District s Name Phone (area code and number)
Application for 1-d-1 (Open-Space) Agricultural Use Appraisal Texas Comptroller of Public Accounts Travis Central Appraisal District (512) 834-9138 Appraisal District s Name Phone (area code and number)
ARIZONA HISTORICAL SOCIETY 949 East Second Street Library and Archives Tucson, AZ (520)
") ARIZONA HISTORICAL SOCIETY 949 East Second Street Library and Archives Tucson, AZ 85719 (520) 617-1157 ahsref@azhs.gov MS 1260 Indian Claims Commission Papers, 1966-1971 DESCRIPTION The Indian Claims Commission
ARIZONA HISTORICAL SOCIETY 949 East Second Street Library and Archives Tucson, AZ 85719 (520) 617-1157 ahsref@azhs.gov MS 1260 Indian Claims Commission Papers, 1966-1971 DESCRIPTION The Indian Claims Commission
Agricultural. Credit Conditions. Farmland Values and Farm Income Soar. Burgeoning farm profits accelerated District cropland and ranchland value gains
 SURVEY of TENTH DISTRICT Agricultural Credit Conditions S4 te hp tqeuma br te er r 22 1 FF ee dd ee rraall RReesseerrvvee BBa annk k o of f KKa an ns sa as s C Ci ti ty y Farmland Values and Farm Income
FOR LEASE STATE TRUST LAND
 FOR LEASE STATE TRUST LAND NOTICE IS HEREBY GIVEN THAT PURSUANT TO WYOMING STATUTE 36-5-109, THE OFFICE OF STATE LANDS AND INVESTMENTS OFFERS THE FOLLOWING STATE TRUST LAND FOR GRAZING AND AGRICULTURAL
Public Review Draft. January 2007
 Lee County, Florida SUPPORT STUDY: AFFORDABLE HOUSING METHODOLOGY January 2007 Public Review Draft Submitted by: CLARION ASSOCIATES, LLC 1526 East Franklin Street, Suite 102 Chapel Hill, NC 27514 (919)
. Federal Land Transaction Facilitation Act: Operation and Issues for Congress Carol Hardy Vincent Specialist in Natural Resources Policy June 13, 201
 Federal Land Transaction Facilitation Act: Operation and Issues for Congress Carol Hardy Vincent Specialist in Natural Resources Policy June 13, 2011 Congressional Research Service CRS Report for Congress
Colorado State Board of Land Commissioners. FY Annual Report
 Colorado State Board of Land Commissioners FY 2014-15 Annual Report Director s Message Supporting Colorado s Schoolchildren I am proud to present the Colorado State Board of Land Commissioners (State Land
Past & Present Adjustments & Parcel Count Section... 13
 Assessment 2017 Report This report includes specific information regarding the 2017 assessment as well as general information about both the appeals and assessment processes. Contents Introduction... 3
Application for 1-d-1 (Open-Space) Agricultural Use Appraisal
 Agricultural Use Appraisal") Application for 1-d-1 (Open-Space) Agricultural Use Appraisal Property Tax Bastrop Central Appraisal District Appraisal District s Name 512-303-1930 Phone (area code and number) P.O. Drawer 578, Bastrop,
Application for 1-d-1 (Open-Space) Agricultural Use Appraisal Property Tax Bastrop Central Appraisal District Appraisal District s Name 512-303-1930 Phone (area code and number) P.O. Drawer 578, Bastrop,
Before the Minnesota Public Utilities Commission State of Minnesota. Docket No. E002/GR Exhibit (LMC-1) Property Taxes
 Property Taxes") Direct Testimony and Schedules Leanna M. Chapman Before the Minnesota Public Utilities Commission State of Minnesota In the Matter of the Application of Northern States Power Company for Authority to Increase
Direct Testimony and Schedules Leanna M. Chapman Before the Minnesota Public Utilities Commission State of Minnesota In the Matter of the Application of Northern States Power Company for Authority to Increase
Using Hedonics to Create Land and Structure Price Indexes for the Ottawa Condominium Market
 Using Hedonics to Create Land and Structure Price Indexes for the Ottawa Condominium Market Kate Burnett Isaacs Statistics Canada May 21, 2015 Abstract: Statistics Canada is developing a New Condominium
Impact Of Financing Terms On Nominal Land Values: Implications For Land Value Surveys
 Economic Staff Paper Series Economics 11-1983 Impact Of Financing Terms On Nominal Land Values: Implications For Land Value Surveys R.W. Jolly Iowa State University Follow this and additional works at:
US Code (Unofficial compilation from the Legal Information Institute) TITLE 43 - PUBLIC LANDS CHAPTER 37 PUBLIC RANGELANDS IMPROVEMENT
 TITLE 43 - PUBLIC LANDS CHAPTER 37 PUBLIC RANGELANDS IMPROVEMENT") US Code (Unofficial compilation from the Legal Information Institute) TITLE 43 - PUBLIC LANDS CHAPTER 37 PUBLIC RANGELANDS IMPROVEMENT Please Note: This compilation of the US Code, current as of Jan. 4,
US Code (Unofficial compilation from the Legal Information Institute) TITLE 43 - PUBLIC LANDS CHAPTER 37 PUBLIC RANGELANDS IMPROVEMENT Please Note: This compilation of the US Code, current as of Jan. 4,
Meeting of Group of Experts on CPI 30 May 1 June 2012
 Meeting of Group of Experts on CPI 30 May 1 June 2012 Content Introduction and Objective of study Data Source and Coverage Methodology Results Limitations of the study and recommendation Introduction House
Procedures Used to Calculate Property Taxes for Agricultural Land in Mississippi
 No. 1350 Information Sheet June 2018 Procedures Used to Calculate Property Taxes for Agricultural Land in Mississippi Stan R. Spurlock, Ian A. Munn, and James E. Henderson INTRODUCTION Agricultural land
PROPERTY TAX IS A PRINCIPAL REVENUE SOURCE
 TAXABLE PROPERTY VALUES: EXPLORING THE FEASIBILITY OF DATA COLLECTION METHODS Brian Zamperini, Jennifer Charles, and Peter Schilling U.S. Census Bureau* INTRODUCTION PROPERTY TAX IS A PRINCIPAL REVENUE
INSTITUTE FOR PROFESSIONALS IN TAXATION REAL PROPERTY TAX SCHOOL REVIEW AND INTRODUCTION
 INSTITUTE FOR PROFESSIONALS IN TAXATION REAL PROPERTY TAX SCHOOL REVIEW AND INTRODUCTION This section is an overview of the major topics covered by IPT s Property Tax School which are directly relevant
REPORT. Research. Determining a Fair Rental Arrangement. Introduction. Types of Rental Arrangements. Kenneth W.. Paxton and Michael E.
 REPORT Research Number 110 - Summer 2001 Determining a Fair Rental Arrangement Kenneth W.. Paxton and Michael E. Salassi Introduction Most of the crop agriculture in Louisiana is produced on rented land.
Protecting Farmland in Maryland: A Review of the Agricultural Land Preservation Program
 Protecting Farmland in Maryland: A Review of the Agricultural Land Preservation Program Craig Shollenberger Planning Intern (former) Anne Arundel County Maryland INTRODUCTION During the past ten to twelve
Paper for presentation at the 2005 AAEA annual meeting Providence, RI July 24-27, 2005
 NEXT YEAR ON THE U.S. FARMLAND MARKET: AN INFORMATIONAL APPROACH Charles B. Moss, Ashok K. Mishra, And Kenneth Erickson Paper for presentation at the 2005 AAEA annual meeting Providence, RI July 24-27,
A Comparison of Economic Impact Estimates for Changes in the Federal Grazing Fee: Secondary vs. Primary Data I/O Models 1
 A Comparison of Economic Impact Estimates for Changes in the Federal Grazing Fee: Secondary vs. Primary Data I/O Models 1 Hans Radtke, Stan Detering and Ray Brokken This paper compares estimates of local
2017 Land Market Survey
 2017 Land Market Survey Presented By National Association of REALTORS Research Division Lawrence Yun, Ph.D. Senior Vice President & Chief Economist Danielle Hale, MS, Managing Director, Housing Research
New Tax Law Could Enhance the Attractiveness of Conservation
 New Tax Law Could Enhance the Attractiveness of Conservation Easements Farm Business Management Update, February 1998 By Jesse J. Richardson, Jr. of the Department of Agricultural and Applied Economics,
FINAL REPORT AN ANALYSIS OF SECONDARY ROAD MAINTENANCE PAYMENTS TO HENRICO AND ARLINGTON COUNTIES WITH THE DECEMBER 2001 UPDATE
 FINAL REPORT AN ANALYSIS OF SECONDARY ROAD MAINTENANCE PAYMENTS TO HENRICO AND ARLINGTON COUNTIES WITH THE DECEMBER 2001 UPDATE Robert A. Hanson, P.E. Senior Research Scientist Cherie A. Kyte Senior Research
Calculating Crop Share, Cash and Flexible Cash Lease Rates
 ase nt Calculating Crop Share, Cash and Flexible Cash Lease Rates By Duane Griffith Montana State University Bozeman January 1998 Instructions for the Crop Leasing program. This program requires Excel
Stocker Lease Agreements
 Oklahoma Cooperative Extension Service AGEC-572 Stocker Lease Agreements October 2017 Damona Doye Extension Economist and Regents Professor Rodney Jones Associate Professor Roger Sahs Assistant Extension
Residential New Construction Attitude and Awareness Baseline Study
 Residential New Construction Attitude and Awareness Baseline Study Real Estate Appraiser Survey Report on Findings Prepared for the New Jersey Residential New Construction Working Group January 2001 Roper
Do Family Wealth Shocks Affect Fertility Choices?
 Do Family Wealth Shocks Affect Fertility Choices? Evidence from the Housing Market Boom Michael F. Lovenheim (Cornell University) Kevin J. Mumford (Purdue University) Purdue University SHaPE Seminar January
Land Value Estimates and Forecasts for Reston. Prepared for Reston Community Center April 2013
 Land Value Estimates and Forecasts for Reston Prepared for Reston Community Center April 2013 LAND VALUE ESTIMATES AND FORECASTS FOR RESTON COMMUNITY CENTER Purpose of the Analysis RCLCO (Robert Charles
Cook County Assessor s Office: 2019 North Triad Assessment. Norwood Park Residential Assessment Narrative March 11, 2019
 Cook County Assessor s Office: 2019 North Triad Assessment Norwood Park Residential Assessment Narrative March 11, 2019 1 Norwood Park Residential Properties Executive Summary This is the current CCAO
86 years in the making Caspar G Haas 1922 Sales Prices as a Basis for Estimating Farmland Value
 2 Our Journey Begins 86 years in the making Caspar G Haas 1922 Sales Prices as a Basis for Estimating Farmland Value Starting at the beginning. Mass Appraisal and Single Property Appraisal Appraisal
The Subject Section. Chapter 2. Property Address
 Chapter 2 The Subject Section The SUBJECT section of the URAR introduces the appraisal assignment by presenting important information about the subject property. The SUBJECT section provides spaces for
Agricultural Lease Bid Process and Policy Updated September 21, 2017
 Agricultural Lease Bid Process and Policy Updated September 21, 2017 Introduction: Pitkin County Open Space & Trails (OST) was established by the voters of Pitkin County in 1990 with the following mission;
Torch Lake Township Antrim County, Michigan
 Torch Lake Township Antrim County, Michigan Farmland and Open Space Development Rights Ordinance Ordinance No. 04-01 Effective September 3, 2004 AN ORDINANCE creating a farmland and open space protection
Cook County Assessor s Office: 2019 North Triad Assessment. Elk Grove Residential Assessment Narrative April 16th, 2019
 Cook County Assessor s Office: 2019 North Triad Assessment Elk Grove Residential Assessment Narrative April 16th, 2019 1 Elk Grove Residential Properties Executive Summary Since the 2016 re-assessment,
Introduction. Bruce Munneke, S.A.M.A. Washington County Assessor. 3 P a g e
 Assessment 2016 Report This report includes specific information regarding the 2016 assessment as well as general information about both the appeals and assessment processes. Contents Introduction... 3
Assessment-To-Sales Ratio Study for Division III Equalization Funding: 1999 Project Summary. State of Delaware Office of the Budget
 Assessment-To-Sales Ratio Study for Division III Equalization Funding: 1999 Project Summary prepared for the State of Delaware Office of the Budget by Edward C. Ratledge Center for Applied Demography and
ESP 172: Public Land Management. Professor Mark Lubell TA Rodd Kelsey
 ESP 172: Public Land Management Professor Mark Lubell TA Rodd Kelsey Public Lands of the US (Lower 48) Public Lands in Alaska Arctic National Wildlife Refuge Public Lands Background Ownership Statistics
Nevada Public Land Management Task Force Final Report, SJR 1 of the 78 th Nevada Legislature and Implementation through Federal Legislation
 Nevada Public Land Management Task Force Final Report, SJR 1 of the 78 th Nevada Legislature and Implementation through Federal Legislation Churchill County Public Meeting Churchill County Commission Chamber
CONSUMER CONFIDENCE AND REAL ESTATE MARKET PERFORMANCE GO HAND-IN-HAND
 CONSUMER CONFIDENCE AND REAL ESTATE MARKET PERFORMANCE GO HAND-IN-HAND The job market, mortgage interest rates and the migration balance are often considered to be the main determinants of real estate
7224 Nall Ave Prairie Village, KS 66208
 Real Results - Income Package 10/20/2014 TABLE OF CONTENTS SUMMARY RISK Summary 3 RISC Index 4 Location 4 Population and Density 5 RISC Influences 5 House Value 6 Housing Profile 7 Crime 8 Public Schools
Q. How is Agricultural property valued? A. GENERAL INFORMATION Many states have laws regarding the preferential assessment of agricultural land.
 Q. How is Agricultural property valued? A. GENERAL INFORMATION Many states have laws regarding the preferential assessment of agricultural land. This means that farm and ranch assessments are usually based
Farm Real Estate Ownership Transfer Patterns in Nebraska s Panhandle Region
 University of Nebraska Lincoln Research Bulletin RB349 Farm Real Estate Ownership Transfer Patterns in Nebraska s Panhandle Region Bruce B. Johnson, Professor, Agricultural Economics Dennis M. Conley,
CONSERVATION EASEMENTS. Public Policy Considerations for PRIVATE Land Management Harriet M. Hageman Hageman & Brighton, P.C.
 CONSERVATION EASEMENTS Public Policy Considerations for PRIVATE Land Management Harriet M. Hageman Hageman & Brighton, P.C. Conservation Easements What are They? A legally-binding agreement b/w a property
So You ve Inherited a Farm, Now What?
 So You ve Inherited a Farm, Now What? Allan Vyhnalek Farm Succession & Transition Email: avyhnalek@unl.edu Phone: (402) 472-1771 Co Author: Jim Jansen Agricultural Economist Email: jjansen4@unl.edu Phone:
Market Segmentation: The Omaha Condominium Market
 Market Segmentation: The Omaha Condominium Market Roger P. Sindt Steven Shultz University of Nebraska at Omaha Introduction A highly visible and growing niche in the homeownership market is the condominium
Cook County Assessor s Office: 2019 North Triad Assessment. Evanston Residential Assessment Narrative Updated: April 8 th, 2019
 Cook County Assessor s Office: 2019 North Triad Assessment Evanston Residential Assessment Narrative Updated: April 8 th, 2019 1 Updates to this report A previous version of this report was rendered in
ANSWERS TO COMMONLY ASKED QUESTIONS ABOUT AGRICULTURAL LAND VALUE IN KANSAS
 ANSWERS TO COMMONLY ASKED QUESTIONS ABOUT AGRICULTURAL LAND VALUE IN KANSAS By The Ag Use Section Property Valuation Division (PVD) February 28, 2017 General Questions: Who establishes the appraised value
DIRECTIVE # This Directive Supersedes Directive # and #92-003
 Division Of Property Valuation Docking State Office Building 915 SW Harrison St., Room 400N Topeka, KS 66612-1588 Nick Jordan, Secretary David N. Harper, Director phone: 785-296-2365 fax: 785-296-2320
Document under Separate Cover Refer to LPS State of Housing
 Document under Separate Cover Refer to LPS5-17 216 State of Housing Contents Housing in Halton 1 Overview The Housing Continuum Halton s Housing Model 3 216 Income & Housing Costs 216 Indicator of Housing
Decades of dysfunctional federal bureaucracy is literally dismantling the environmental well being of Nevada and the West.
 For All Americans! Decades of dysfunctional federal bureaucracy is literally dismantling the environmental well being of Nevada and the West. Recent record-setting wildfires are not only destroying wildlife
APPLICATION OF GEOGRAPHIC INFORMATION SYSTEM IN PROPERTY VALUATION. University of Nairobi
 APPLICATION OF GEOGRAPHIC INFORMATION SYSTEM IN PROPERTY VALUATION Thesis Presented by STEPHEN WAKABA GATHERU F56/69748/2013 Supervised by DR. DAVID NYIKA School of Engineering Department of Geospatial
Rent Policy. Approved on: 9 December 2010 Board of Management Consolidated November 2015
 Rent Policy Approved on: 9 December 2010 Board of Management Consolidated November 2015 BIELD HOUSING ASSOCIATION LIMITED Registered Office: 79 Hopetoun Street, Edinburgh EH7 4QF Scottish Charity No SC006878
RENITA HURDSMAN BEAR RIVER STATE PARK LAND EXCHANGE PROPOSAL
 DETAILED ANALYSIS RENITA HURDSMAN BEAR RIVER STATE PARK LAND EXCHANGE PROPOSAL June 1, 2006 Prepared by the Office of State Lands and Investments Herschler Building, 3W 122 West 25 th Street Cheyenne,
An Examination of Potential Changes in Ratio Measurements Historical Cost versus Fair Value Measurement in Valuing Tangible Operational Assets
 An Examination of Potential Changes in Ratio Measurements Historical Cost versus Fair Value Measurement in Valuing Tangible Operational Assets Pamela Smith Baker Texas Woman s University A fictitious property
Review of the Prices of Rents and Owner-occupied Houses in Japan
 Review of the Prices of Rents and Owner-occupied Houses in Japan Makoto Shimizu mshimizu@stat.go.jp Director, Price Statistics Office Statistical Survey Department Statistics Bureau, Japan Abstract The
Economics of Leasing. Introduction
 Economics of Leasing Introduction Lease or Buy: The average annual per acre rental rate in Virginia for the period of 2002-2013 is been $43 for cropland and $19 for pastureland (NASS, Quick Stats). Over
Moriah Ranch Request for Proposal For Farm and Ranch Management Lease
 Moriah Ranch Request for Proposal For Farm and Ranch Management Lease PURPOSE OF REQUEST The Office of State Lands and Investments (OSLI) is seeking a long term farm and ranch management lease on the Moriah
Chapter 8. How much would you pay today for... The Income Approach to Appraisal
 How much would you pay today for... Chapter 8 One hundred dollars paid with certainty each year for five years, starting one year from now. Why would you pay less than $500 Valuation Using the Income Approach
Understanding Mississippi Property Taxes
 Understanding Mississippi Property Taxes Property tax revenues are a vital component of the budgets of Mississippi s local governments. Property tax revenues allow these governments to provide important
August 3, To Whom It May Concern:
 415 Lincoln St. P.O. Box 740 Holdrege, NE 68949-0740 Phone: (308) 995-8601 Fax: (308) 995-5705 Web: www.cnppid.com August 3, 2016 To Whom It May Concern: Central contracted with a firm to conduct a comprehensive
Comparison of Selected Financial Ratios for the Pallet Industry. by Bruce G. Hansen 1 and Cynthia D. West
 Comparison of Selected Financial Ratios for the Pallet Industry by Bruce G. Hansen 1 and Cynthia D. West Abstract This paper presents the results of a financial ratio survey conducted by the National Wooden
How to Read a Real Estate Appraisal Report
 How to Read a Real Estate Appraisal Report Much of the private, corporate and public wealth of the world consists of real estate. The magnitude of this fundamental resource creates a need for informed
State entrusted grazing lands : a study of regulation and price
 State entrusted grazing lands : a study of regulation and price by David Karsten Gaarder A thesis submitted in partial fulfillment of the requirements for the degree of MASTER OF SCIENCE in Applied Economics
Analysis Prepared by David L. Sjoquist and Robert J. Eger III
 GEORGIA STATE UNIVERSITY ANDREW YOUNG SCHOOL OF POLICY STUDIES FISCAL RESEARCH CENTER DECEMBER 1, 2006 SUBJECT: Estimated Effects of Population Growth on Atlanta Public School s Revenue and Expenditures
Technical Description of the Freddie Mac House Price Index
 Technical Description of the Freddie Mac House Price Index 1. Introduction Freddie Mac publishes the monthly index values of the Freddie Mac House Price Index (FMHPI SM ) each quarter. Index values are
BUSI 330 Suggested Answers to Review and Discussion Questions: Lesson 10
 BUSI 330 Suggested Answers to Review and Discussion Questions: Lesson 10 1. The client should give you a copy of their income and expense statements for the last 3 years showing their rental income by
LAND AUCTION.
 LAND AUCTION 919+/- Acre Farm Charles Mix County, South Dakota Offered in Eight Tracts! Friday, December 7, 2018 1:30 PM at the National Guard Armory Building 610 East SD Highway 46, Wagner, South Dakota
METHODOLOGY GUIDE VALUING LANDS IN TRANSITION IN ONTARIO. Valuation Date: January 1, 2016
 METHODOLOGY GUIDE VALUING LANDS IN TRANSITION IN ONTARIO Valuation Date: January 1, 2016 August 2017 August 22, 2017 The Municipal Property Assessment Corporation (MPAC) is responsible for accurately assessing
Re-sales Analyses - Lansink and MPAC
 Appendix G Re-sales Analyses - Lansink and MPAC Introduction Lansink Appraisal and Consulting released case studies on the impact of proximity to industrial wind turbines (IWTs) on sale prices for properties
The purpose of the appraisal was to determine the value of this six that is located in the Town of St. Mary s.
 The purpose of the appraisal was to determine the value of this six that is located in the Town of St. Mary s. The subject property was originally acquired by Michael and Bonnie Etta Mattiussi in August
CHALLENGES IN MANAGING MULTIPLE USE LANDS & TOOLS TO ENABLE SUCCESS
 CHALLENGES IN MANAGING MULTIPLE USE LANDS & TOOLS TO ENABLE SUCCESS Rocky Mountain Land Use Institute Conference March 13, 2015 Susan Culp Principal, NextWest Consulting, LLC Challenges to Achieving Conservation
Geographic Variations in Resale Housing Values Within a Metropolitan Area: An Example from Suburban Phoenix, Arizona
 INTRODUCTION Geographic Variations in Resale Housing Values Within a Metropolitan Area: An Example from Suburban Phoenix, Arizona Diane Whalley and William J. Lowell-Britt The average cost of single family
Revenue recognition for real estate developers Indian GAAP vs ICDS
 Revenue recognition for real estate developers Indian GAAP vs ICDS - Published on August 2, 2016 Authors - CA Vivek Newatia - Email - vnewatia@sjaykishan.com - Ph. No. - +91 98310 88818 Revenue recognition