|
|
|
- Alan Bryan
- 5 years ago
- Views:
Transcription

1
2
3
4
5

6

7

8
9

10
11
12
13
14
15
16
17

18
19
20 TYLER OFFICE MARKET SURVEY September, 2016 Burns Commercial Properties has completed its annual survey of the Tyler office market and the results indicate that no dramatic changes have taken place in this segment of the commercial real estate sector. The survey consists of data compiled from fifty seven buildings which contain a total of 2,244,123 square feet. The overall occupancy rate for the properties surveyed came in at 85.4%, one half of one percent better than the 2015 numbers. Significantly, the average quoted rates for the properties, decreased by $0.12 per square foot, showing an average rate of $ The rates are quoted on a gross rent basis, in which the Landlord pays for all utilities, janitorial service, maintenance, taxes, and insurance. There is a total of 327,288 square feet of space currently available in the market. The most pronounced change was found in the downtown office sector, which experienced a decline in occupancy from 80.7% to 78.3%. The average asking rate in this portion of the market is $13.05 per square foot. In the South Tyler market, the occupancy rate is 89.1%, a two percent improvement over last year. Rates were down slightly in this area, with an average of $15.85 per square foot. Class A buildings improved their occupancy levels slightly, ending at 87.1%. Rates were virtually unchanged, down to $19.98 per square foot from $20.04 last year. Class B buildings are 84.3% occupied, up from 83.1% last year. Rates dropped from $14.25 to $13.93 per square foot. Class C buildings fared worse, dropping by 4.8% to an occupancy level of 84.0% overall. Rates were virtually unchanged at $12.50 per square foot. The office market has been negatively affected by the slowdown in the energy sector plus the increased use of technology, which makes it possible to achieve the same output level with fewer employees, while allowing companies to place more workers per square foot. Additionally, more people are working from home which is also a result of technological changes. Thanks to the building owners, managers, and leasing agents who supplied the information used to complete this report, and to Peggie Jenkins for compiling it. Taylor Burns
21 Table 1 TYLER OFFICE MARKET SURVEY SEPTEMBER 2016 Total Office Market Statistics Number of Buildings: 57 Total Square Feet: 2,244,123 Total Vacant Square Feet: 327,288 Overall Occupancy Rate: 85.4% Average Annual Rental Rate Per SF: $15.12 Tyler CBD (Downtown) Office Market Statistics Number of Buildings: 14 Total Square Feet: 760,945 Total Vacant Square Feet: 165,376 Occupancy Rate: 78.3% Average Annual Rental Rate Per SF: $13.05 Tyler Suburban (South Tyler) Office Market Statistics Number of Buildings: 43 Total Square Feet: 1,483,178 Total Vacant Square Feet: 161,912 Occupancy Rate: 89.1% Average Annual Rental Rate Per SF: $15.85
22 Table 2 TYLER OFFICE MARKET SURVEY SEPTEMBER 2016 Class A Number of Buildings: 14 Total Square Feet: 885,837 Total Vacant Square Feet: 113,732 Occupancy Rate: 87.1% Average Annual Rental Rate Per SF: $19.98 Class B Number of Buildings: 33 Total Square Feet: 1,179,732 Total Vacant Square Feet: 185,100 Occupancy Rate: 84.3% Average Annual Rental Rate Per SF: $13.93 Class C Number of Buildings: 10 Total Square Feet: 178,554 Total Vacant Square Feet: 28,456 Occupancy Rate: 84.0% Average Annual Rental Rate Per SF: $12.50
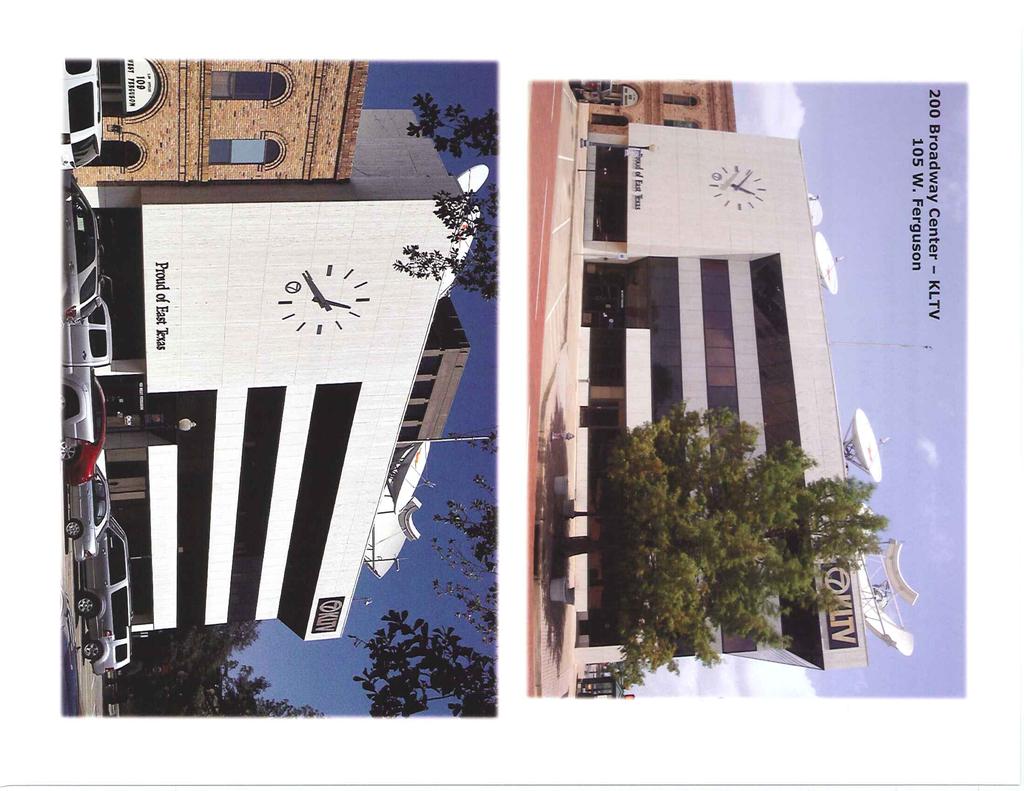
23 BURNS COMMERCIAL PROPERTIES 2016 OFFICE MARKET SURVEY, TYLER, TEXAS CITY: Tyler MARKET: Central Business District (Downtown) DATE: September, 2016 COMMON LARGEST ANNUAL AREA BUILDING/ADDRESS TOTAL SIZE NUMBER OF PERCENT TOTAL SPACE CONTIGUOUS BASE ADD-ON EXPENSE BLDG OWNER IN SF FLOORS OCCUPIED AVAILABLE AVAILABLE RENT FACTOR STOP CLASS CONTACT Tyler CBD Office Market First Place 187, % 16,057 6,548 $ % $9.48 A Allen Bell 100 E. Ferguson Street $18.00 Allen Bell Property Svcs. Crest Properties, Ltd. 903/ Plaza Tower 209, % 60,597 11,086 $ % Base Yr. A Taylor Burns 110 N. College Avenue (incl 8,904 sf in basement) $17.00 Burns Commercial Properties Genecov Group 903/ Broadway Center (KLTV BLDG) 54, % 20,592 10,296 $13.00 N/A Base Yr. B Taylor Burns 105 W. Ferguson Street Burns Commercial Properties TV-3, Inc. 903/ Tyler Office Center 17, % 4,900 3,000 $10.50 N/A None B Art Mullan 120 S. Broadway Avenue Signature Management, Inc. Individual 903/ United Heritage Bldg. 13, % 3,900 1,492 $ % Base Yr. B Robert Means 522 S. Broadway Avenue Investment Real Estate Svcs. Woldert Rentals, LLC 903/ People's Petroleum Building 76, % 20,004 11,476 $ % Base Yr. B Andy Bergfeld 102 N. College Avenue Bergfeld Realty People's Petroleum Bldg., LLC 903/ The Energy Center 41, % 8,310 1,000 $12.00 N/A None C Martin Heines 719 W. Front Street Martin Heines Real Estate Briarwood Group, Ltd. 903/ Fountain Square 29, % 3,500 1,200 $11.00 N/A None C Martin Heines 401 E. Front Street Martin Heines Real Estate Briarwood Group, Ltd. 903/ Blackstone Building 26, % 0 0 $ % $6.76 B Allen Bell 315 N. Broadway Avenue Allen Bell Property Svcs. Tyler Chamber of Commerce 903/
24 COMMON LARGEST ANNUAL AREA BUILDING/ADDRESS TOTAL SIZE NUMBER OF PERCENT TOTAL SPACE CONTIGUOUS BASE ADD-ON EXPENSE BLDG OWNER IN SF FLOORS OCCUPIED AVAILABLE AVAILABLE RENT FACTOR STOP CLASS CONTACT Tyler CBD Office Market 122 South College Building 6, % 6,028 6,028 $10.00 N/A None C Bill Whitehurst 122 S. College Avenue 903/ Whitehurst & Smith Wadel-Connally 30, % 3,328 3,740 $ % $5.26 B Allen Bell 112 E. Line Street $16.00 Allen Bell Property Svcs. BSGJ1, LLC 903/ Austin Bank Building 35, % 5,018 1,500 $12.00 N/A None C Martin Heines 305 S. Broadway Avenue Martin Heines Real Estate Briarwood Group, Ltd 903/ South Broadway Building 13, % 6,733 1,205 $ % Base Yr. B Andy Bergfeld 210 S. Broadway Avenue Bergfeld Realty Broadway Rusty Nail, Ltd. 903/ South Broadway Avenue 19, % 6,409 1,315 $ % Base Yr. B Andy Bergfeld 320 S. Broadway Avenue Bergfeld Realty Metro Asset Management, LLC 903/ Totals For CBD: 760, % 165,376 $13.05 (avg)
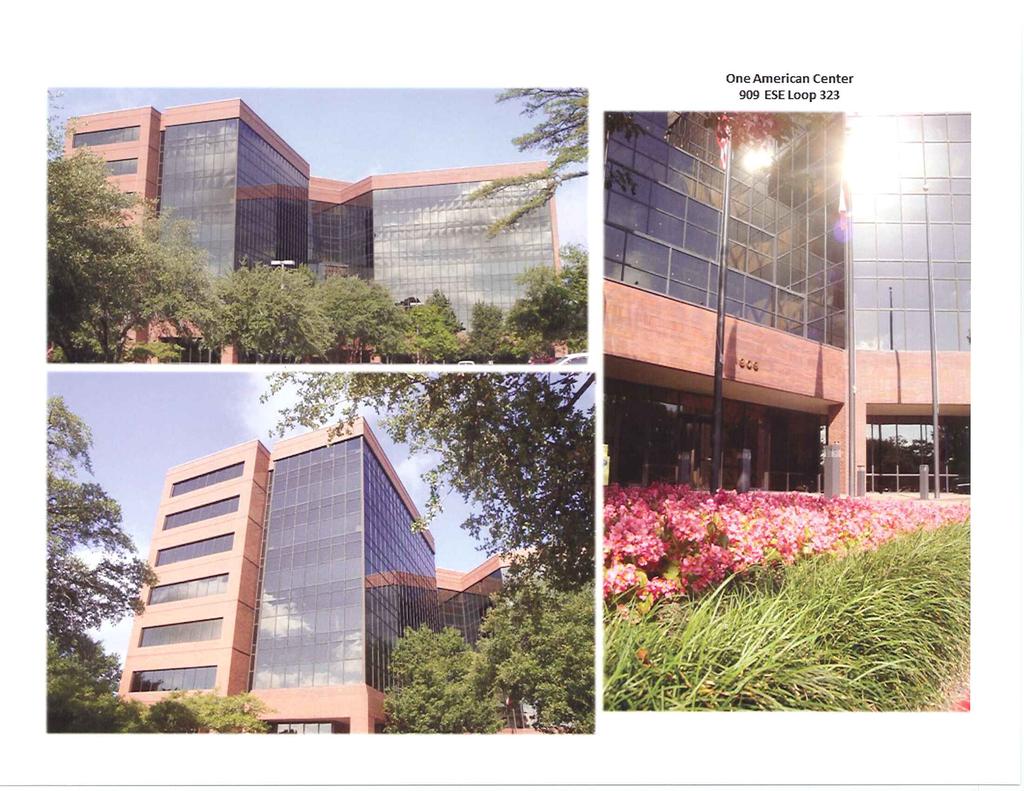
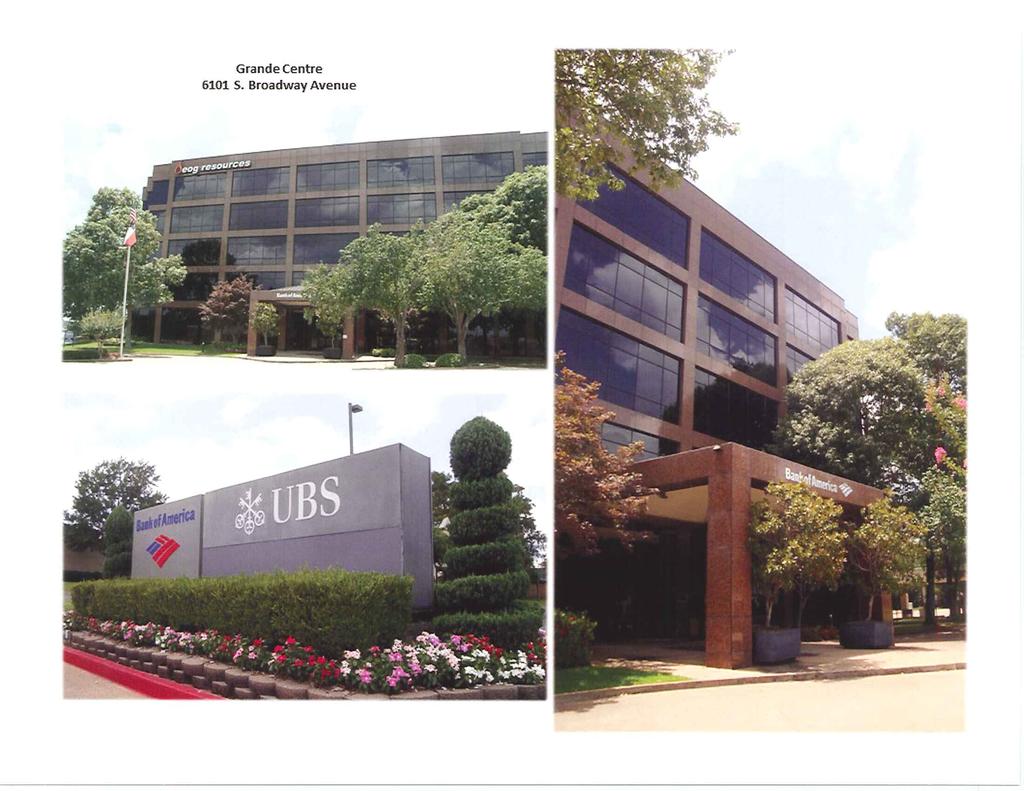
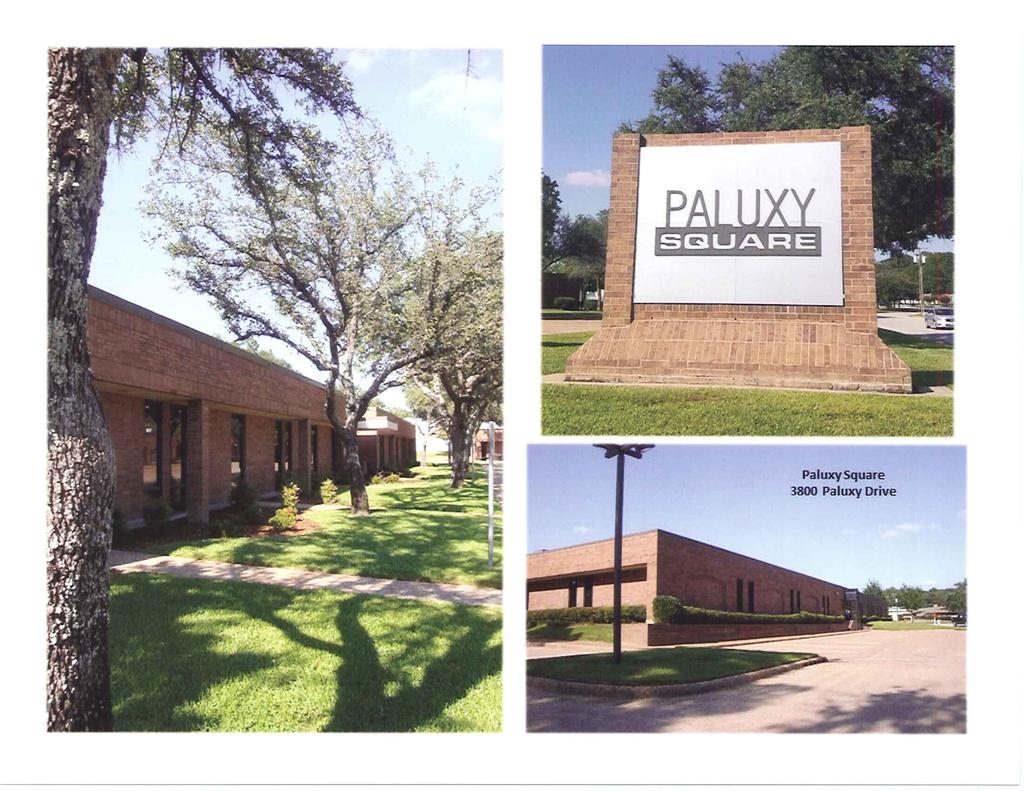
25 CITY: Tyler MARKET: Suburban DATE: September, 2016 COMMON LARGEST ANNUAL AREA BUILDING/ADDRESS TOTAL SIZE NUMBER OF PERCENT TOTAL SPACE CONTIGUOUS BASE ADD-ON EXPENSE BLDG OWNER IN SF FLOORS OCCUPIED AVAILABLE AVAILABLE RENT FACTOR STOP CLASS CONTACT Tyler Suburban Office Market One American Center 113, % 13,971 6,023 $ % Base Yr. A Taylor Burns 909 ESE Loop 323 Burns Commercial Properties Mesa Loans of Athens, L.P. 903/ Two American Center 94, % 0 0 $ % Base Yr. A Russell Patterson 821 ESE Loop 323 $19.00 Patterson Commercial Property Aberfeldy, Ltd. 903/ Grande Centre 90, % 0 0 $ % $7.35 A Taylor Burns 6101 S. Broadway Avenue $23.00 Burns Commercial Properties David Lake 903/ Grande Plaza 57, % 5,720 3,110 Negotiable N/A N/A B Brad Donley 212 Grande Blvd. Pyle Properties Pyle Properties 903/ Heartland Financial Center 58, % 0 0 Negotiable 15.0% Base Yr. A Brig North 501 Shelley Drive Heartland SIG Hibbs Financial 903/ Woodgate Centre 95, % 13,391 5,949 $ % Base Yr. B Glenn Eikner 1001 ESE Loop 323 Burns Commercial Properties Woodgate Centre, LLC 903/ Paluxy Square 79, % 24,578 5,091 $ N/A Base Yr. B Aaron Uncapher 3800 Paluxy Drive $14.50 Burns Commercial Properties Genecov Group 903/ Commerce Square 73, % 12,081 3,020 $11.10 N/A None B James Wynne, III 3334 SSW Loop 323 Commerce Square Corp. Wynne Interests 903/ Oak Plaza Building 59, % 11,795 5,157 $ % $6.04 B Dan Spivey 3300, 3304 & 3310 S. Broadway Roosth Properties Roosth Properties 903/ Shiloh Office Park 22, % 0 0 $13.50 N/A Base Yr. B Russell Patterson 921 Shiloh Road Net Elec/Janitorial Patterson Commercial Property Aberfeldy, Ltd. 903/
26 COMMON LARGEST ANNUAL AREA BUILDING/ADDRESS TOTAL SIZE NUMBER OF PERCENT TOTAL SPACE CONTIGUOUS BASE ADD-ON EXPENSE BLDG OWNER IN SF FLOORS OCCUPIED AVAILABLE AVAILABLE RENT FACTOR STOP CLASS CONTACT Tyler Suburban Office Market Independence Center 54, % 4,031 2,000 $ % Base Yr. B Don Simmons 100 Independence Place Simmons Real Estate Genecov Group 903/ Alpha Centre 45, % 8,005 2,880 $ % Base Yr. B Russell Patterson 3200 Troup Highway Patterson Commercial Property Aberfeldy, Ltd. 903/ Atriums 39, % 1,759 1,086 $ % Base Yr. B Russell Patterson 1820 Shiloh Road Patterson Commercial Property Aberfeldy, Ltd. 903/ Southeast Center 38, % 7,873 3,823 $ % $6.61 A Dan Spivey 3301 Troup Highway $18.00 Roosth Properties Roosth Properties 903/ Southpark Centre 48, % 1,325 1,325 $ % Base Yr. B Glenn Eikner 1828 ESE Loop 323 $17.00 Burns Commercial Properties Negem Investments, LLC 903/ Scottish Highlands Office 33, % 3,253 1,716 $14.00 N/A Base Yr. B Glenn Eikner Highway 110 S. at Kensington Net of Utilities Burns Commercial Properties Genecov Group 903/ Oakglen Office Building 14, % $ % Base Yr. B Carrie Johnson 5620 Old Bullard Road Harbor Properties Harbor Properties 888/ Threlkeld Building 15, % 0 0 $15.00 N/A None B Don Robert Johnson 515 WSW Loop 323 Trust Property Mgmt. 903/ Atelier Office Buildings 13, % 0 0 $13.72* N/A Base Yr. B Carrie Johnson 3800 Old Bullard Road Harbor Properties Harbor Properties 888/ * Tenant pays for certain charges such as utilities and/or janitorial. Rate shown includes an estimate for these sevices.
27 COMMON LARGEST ANNUAL AREA BUILDING/ADDRESS TOTAL SIZE NUMBER OF PERCENT TOTAL SPACE CONTIGUOUS BASE ADD-ON EXPENSE BLDG OWNER IN SF FLOORS OCCUPIED AVAILABLE AVAILABLE RENT FACTOR STOP CLASS CONTACT Tyler Suburban Office Market Bullard Road Square 14, % 0 0 $12.00* N/A Base Yr. C Carrie Johnson 5604 Old Bullard Road Harbor Properties Harbor Properties 888/ Woodgate I 32, % 0 0 $13.25 N/A N/A B Brian Burks 1121 ESE Loop 323 Landbridge Commercial CG Investments, LP 903/ Woodgate II 33, % 1,501 1,501 $ % Base Yr. B Russell Patterson 1021 ESE Loop 323 Patterson Commercial Property Flowers Davis PLLC 903/ Woodgate IV 50, % 4,700 2,700 $ % $6.00 B Don Robert Johnson 1101 ESE Loop 323 Trust Property Mgmt. Copeland Gate, LLC 903/ Southside Office Building 15, % 2, $12.00 N/A None C Martin Heines 1324 S. Beckham Martin Heines Real Estate Pollard-Heines Buildings, LLC 903/ Oak Leaf Building 12, % 0 0 $12.00* N/A $2.75 C Carrie Johnson 5528 Old Bullard Road Harbor Properties Harbor Properties 888/ Winchester Office Complex 12, % 0 0 $12.00 N/A None C Carrie Johnson Winchester Drive Harbor Properties Harbor Properties 888/ The Colonial 10, % 0 0 $13.00 N/A None B Carrie Johnson 5935 Old Bullard Road Harbor Properties Harbor Properties 888/ Highlands Office 7, % 0 0 $13.50 N/A None C Bob Matush 2624 Kensington 903/ Bob Matush * Tenant pays for certain charges such as utilities and/or janitorial. Rate shown includes an estimate for these sevices.
28 COMMON LARGEST ANNUAL AREA BUILDING/ADDRESS TOTAL SIZE NUMBER OF PERCENT TOTAL SPACE CONTIGUOUS BASE ADD-ON EXPENSE BLDG OWNER IN SF FLOORS OCCUPIED AVAILABLE AVAILABLE RENT FACTOR STOP CLASS CONTACT Tyler Suburban Office Market Southgate Office Park 11, % 0 0 $15.00 N/A Base Yr. B Mark Whatley 720 WSW Loop 323 Glenn Eikner Genecov Group Burns Commercial Properties 903/ Off Broadway II 22, % 22,990 22,990 Negotiable N/A N/A B Nolan Manziel 2301 S. Broadway Avenue 903/ Nolan Manziel Pruitt Place Building 10, % 4,500 4,500 $15.50 N/A N/A A Don Carroll 1015 Pruitt Place NNN Landbridge Commercial Abby Development 903/ Pruitt Place 8, % 0 0 $15.50 N/A N/A A Don Carroll Abby Development NNN Landbridge Commercial Building 1 903/ Pruitt Place 12, % 0 0 $15.50 N/A N/A A Don Carroll Abby Development NNN Landbridge Commercial Building 2 903/ Old Jacksonville Professional Park 20, % 0 0 $15.50 N/A N/A A Don Carroll 6760 & 6770 Old Jacksonville Road NNN Landbridge Commercial Abby Development 903/ Regions Bank Building 12, % 0 0 $15.50 N/A Base Yr. B Taylor Burns 1000 WSW Loop 323 Burns Commercial Properties WSW Loop Partners, LLC 903/ Jordan Plaza 40, % 2,400 2,400 $11.00 $3.60/SF N/A B Brian Burks Jordan Plaza Blvd. Landbridge Commercial Verian Investments, LP 903/ Kinsey Plaza 26, % 1,000 1,000 $12.00 N/A N/A B Marc Ivy 1420 WSW Loop 323 Bridgewater Realty ETX Tyler Properties 903/
29 COMMON LARGEST ANNUAL AREA BUILDING/ADDRESS TOTAL SIZE NUMBER OF PERCENT TOTAL SPACE CONTIGUOUS BASE ADD-ON EXPENSE BLDG OWNER IN SF FLOORS OCCUPIED AVAILABLE AVAILABLE RENT FACTOR STOP CLASS CONTACT Tyler Suburban Office Market Blue Mountain Office 7, % 2,500 2,000 $18.00 N/A N/A A Marc Ivy Blue Mountain Blvd. Bridgewater Realty Fleming Properties 903/ Broadway Commons 16, % 0 0 $16.00 N/A N/A B Robert Means 8288 S. Broadway Investment Real Estate Svcs. Andres Alarcon 903/ Plantation Center 20, % 0 0 $14.00 N/A N/A B Robert Means Rice Rd. NNN Investment Real Estate Svcs. 903/ ETS Building 3, % 3,600 3,600 $10.00 N/A N/A C Brian Burks 419 Rice Rd. NNN Landbridge Commercial 903/ Corporate Green Office Park 19, % 0 0 $16.00 N/A N/A A Matthew Marshall Eagles Nest Blvd. NNN Drake Real Estate Phil Burks 903/ Broadway Hills Plaza 16, % 8,234 7,720 $16.00 N/A N/A A Matthew Marshall 7925 S. Broadway, Bldg. 11 NNN Drake Real Estate CHB Interests, LLC 903/ Suburban Totals: 1,483, % 161,912 $15.85 (avg) Totals For All Properties: 2,244, % 327,288 $15.12 (avg)
TYLER OFFICE MARKET SURVEY September, 2015
 TYLER OFFICE MARKET SURVEY September, 2015 The annual Burns Commercial Properties Office Market survey was just completed and the results indicate that the gradual decrease in the office occupancy rate
INDUSTRIAL MARKET REPORT. San Antonio. 4th Quarter Q4 Market Trends 2017 by Xceligent, Inc. All Rights Reserved
 INDUSTRIAL MARKET REPORT San Antonio 4th Quarter 2016 Table of Contents/ Methodology of Tracked Set Xceligent is a leading provider of verified commercial real estate information which assists real estate
One American Center LEASING INFORMATION MATT COALE, CCIM (903) GLENN EIKNER (903)
 GLENN EIKNER (903)") CLICK HERE FOR VIDEO OF ONE AMERICAN CENTER GLENN EIKNER (903) 352-1724 LEASING INFORMATION 909 ESE Loop 323, Suite 650, Tyler, TX 75701 (903) 534-1200 www.burns-commercial.com MATT COALE, CCIM (903) 372-3622
CLICK HERE FOR VIDEO OF ONE AMERICAN CENTER GLENN EIKNER (903) 352-1724 LEASING INFORMATION 909 ESE Loop 323, Suite 650, Tyler, TX 75701 (903) 534-1200 www.burns-commercial.com MATT COALE, CCIM (903) 372-3622
OFFICE MARKET REPORT. Northwest Arkansas. 3rd Quarter Q3 Market Trends 2016 by Xceligent, Inc. All Rights Reserved
 OFFICE MARKET REPORT Northwest Arkansas 3rd Quarter 2016 Table of Contents/ Methodology of Tracked Set Xceligent is a leading provider of verified commercial real estate information which assists real
CoStar Office Statistics. Y e a r - E n d McAllen/Edinburg/Pharr Office Market
 CoStar Office Statistics Y e a r - E n d 2 0 1 7 McAllen/Edinburg/Pharr Office Market Year-End 2017 McAllen/Edinburg/Pharr Table of Contents Table of Contents.................................................................
1Q 17. Long Island Market Report
 1Q 17 Long Island Market Report Long Island Office 1Q 217 Long Island 1Q17 Office Office Report The Long Island Office market ended the first quarter 217 with a vacancy rate of 7.1%. The vacancy rate was
Callaghan Tower Vantage Dr, Suite 1200 San Antonio TX reocsanantonio.com R E O C
 Callaghan Tower 8023 Vantage, San Antonio, Texas 78230 Office for Lease Open Space Spec Suites Immediately Available R E O C 8023 Vantage Dr, Suite 1200 San Antonio TX 78230 reocsanantonio.com Table of
3 RD QUARTER 2015 RICHMOND RETAIL MARKET REPORT FORECAST 5.7% VACANCY 509,220 SF UNDER CONSTRUCTION 370,165 SF NET ABSORPTION
 3 RD QUARTER 2015 RICHMOND RETAIL MARKET REPORT FORECAST As 2015 winds down, the vacancy rates are approaching an all time low. Retail inventory is down causing an increase in construction with national
Houston s Strong Job Growth Boosts Office Leasing Activity
 ) Q2 2012 OFFICE MARKET HOUSTON OFFICE MARKET RESEARCH & FORECAST REPORT Houston s Strong Job Growth Boosts Office Leasing Activity MARKET INDICATORS Q2 2011 Q2 2012 CITYWIDE NET ABSORPTION (SF) 81k 1.4m
3 RD QUARTER 2016 RICHMOND RETAIL MARKET REPORT FORECAST 5.3% VACANCY 349,524 SF UNDER CONSTRUCTION (137,905) SF NET ABSORPTION
 SF NET ABSORPTION") 3 RD QUARTER 2016 RICHMOND RETAIL MARKET REPORT FORECAST All signs indicate a stabilized market that continues to support well-located new development. The majority of absorption in the 3rd quarter was
3 RD QUARTER 2016 RICHMOND RETAIL MARKET REPORT FORECAST All signs indicate a stabilized market that continues to support well-located new development. The majority of absorption in the 3rd quarter was
FOURTH QUARTER 2013 LEASING ACTIVITY CONTINUES TO BE BETTER THAN EXPECTED MARYLAND OFFICE MARKET REPORT MARKET SUMMARY ABSORPTION
 Q4 2013 MARYLAND OFFICE MARYLAND OFFICE MARKET REPORT FOURTH QUARTER 2013 LEASING ACTIVITY CONTINUES TO BE BETTER THAN EXPECTED MARKET SUMMARY Updated April 2013 MARKET INDICATORS Q4 2013 Q1 2014* VACANCY
2Q 17. Long Island Market Report
 2Q 17 Long Island Market Report Long Island Office 2Q 217 Long Island 2Q17 Office Office Report The Long Island Office market ended the second quarter 217 with a vacancy rate of 7.2%. The vacancy rate
Miami-Dade County Office Market Report 1Q Real Capital Partners Real Estate Services
 -Dade County Office Report 1Q 216 Real Capital Partners Real Estate Services 1Q 216 -Dade County Office Report Overview -Dade County s Vacancy Increases to 1.4% Net Negative (11,64) SF in the Quarter The
Direct Vacant (SF) Vacancy Rate (%) Grand Total ,816,898 4,632,760 4,123, % 245,399 66,997 66,997
 Vacancy Rate (%) Grand Total ,816,898 4,632,760 4,123, % 245,399 66,997 66,997") 1st Quarter 213 $25 Market Highlights With the impending move of Pinnacle leaving the market next quarter, the Memphis Office market was able to start the year on a positive note, posting nearly 67, SF
1st Quarter 213 $25 Market Highlights With the impending move of Pinnacle leaving the market next quarter, the Memphis Office market was able to start the year on a positive note, posting nearly 67, SF
Houston s industrial leasing activity decreases 42.7% over the quarter - vacancy rate remains under 5.0%
 Research & Forecast Report HOUSTON INDUSTRIAL Q3 2015 Houston s industrial leasing activity decreases 42.7% over the quarter - vacancy rate remains under 5.0% Lisa Bridges Director of Market Research Houston
RETAIL MARKET ANALYSIS
 RETAIL MARKET ANALYSIS Portland State University Despite the doom and gloom warnings of a retail apocalypse, the national story for retail is that things are stable. Nationwide vacancy is at 5.2 percent
DENVER. Office Research Report. First Quarter Partnership. Performance.
 DENVER Office Research Report First Quarter 2018 Denver Market Facts 61,614 Jobs added in the last 12 months ending in February, a 4.1% increase in employment. 3.1% Unemployment in Denver, lower than the
Orange County Office Market Continues to Tighten As Vacancy Decreases
 OFFICE ORANGE COUNTY MARKET REPORT Continues to Tighten As Decreases MARKET OVERVIEW MARKET INDICATORS - VACANCY 13.5% NET ABSORPTION 101,500 CONSTRUCTION 497,387 RENTAL RATE $2.21 P FSG UNEMPLOYMENT 4.2%
Market Research. OFFICE First Quarter 2010
 colliers international LAS VEGAS, NV Market Research OFFICE First Quarter 2010 Market Indicators Net Absorption Construction Rental Rate Q1-10 Q2-2010 Projected Clark County Economic Data Jan-10 Jan-09
CoStar Industrial Statistics. Y e a r - E n d McAllen/Edinburg/Pharr Industrial Market
 CoStar Industrial Statistics Y e a r - E n d 2 0 1 7 McAllen/Edinburg/Pharr Industrial Market Year-End 2017 McAllen/Edinburg/Pharr Table of Contents Table of Contents.................................................................
Washington DC Market Office Report
 Washington DC Market Office Report Market Overview The Office Market The Washington Office Market includes the District of Columbia and adjacent suburban submarkets in Maryland and Virginia. The Washington
Quarterly Market Report
 HOUSTON OFFICE JANUARY 2018 EXECUTIVE SUMMARY Office Market Shows Signs of Improvement Houston s overall vacancy rate remained relatively unchanged at 20.7% in, a decrease of 10 basis points quarter-over-quarter,
Houston Summer Retail. Office. July 2016 Commercial Markets. Independent Valuations for a Variable World Page 1. Summary Q1 Statistics
 July 2016 Commercial Markets In This Issue Commercial Markets Retail Office Industrial Multifamily Housing Trends Single Family Housing Lot Supply & New Home Data % 10% 8% 6% 4% 2% 0% Retail 2007 Q1 2008
CoStar Office Statistics. F i r s t Q u a r t e r Colorado Springs Office Market
 CoStar Office Statistics F i r s t Q u a r t e r 2 0 1 7 First Quarter 2017 Colorado Springs Table of Contents Table of Contents................................................................. A Methodology......................................................................
2.8% 2.0% $811M. 2017: A Solid Year for the Metro Denver Office Sector HIGHLIGHTED METRO DENVER OFFICE. Market Report Q ECONOMIC TRENDS
 Market Report METRO DENVER OFFICE Q4 2017 2017: A Solid Year for the Metro Denver Office Sector MARKET OVERVIEW Denver s office market finished 2017 with strong positive absorption during the fourth quarter
The CoStar Industrial Report. M i d - Y e a r Jacksonville Industrial Market
 The CoStar Industrial Report M i d - Y e a r 2 0 1 6 Mid-Year 2016 Jacksonville Table of Contents Table of Contents................................................................. A Methodology......................................................................
REVISED A G E N D A PLANNING AND ZONING COMMISSION REGULAR MEETING. City Hall, City Council Chambers 212 North Bonner Avenue Tyler, Texas
 REVISED A G E N D A PLANNING AND ZONING COMMISSION REGULAR MEETING City Hall, City Council Chambers 212 North Bonner Avenue Tyler, Texas Tuesday, April 5, 2016 1:30 p.m. AMERICANS WITH DISABILITIES ACT
OFFICE MARKET REPORT. Orlando. 1st Quarter Q1 Market Trends 2016 by Xceligent, Inc. All Rights Reserved
 OFFICE MARKET REPORT Orlando 1st Quarter 2016 Table of Contents/ Methodology of Tracked Set Xceligent is a leading provider of verified commercial real estate information which assists real estate professionals,
Houston s industrial market continues to expand
 Research & Forecast Report HOUSTON INDUSTRIAL Q1 2017 Houston s industrial market continues to expand Lisa Bridges Director of Market Research Houston During the first quarter of 2017, 1.7M SF of Houston
OAK PLAZA. 2,116 SF $15.00 psf NNN - Suite ,301 SF Call for Pricing Buildings 1 & 3 COMMERCIAL FOR LEASE
 COMMERCIAL FOR LEASE OAK PLAZA 3005-3029 S. 83rd Plaza & 8315 Tangier Way Omaha, Nebraska Building #1 2,116 SF $15.00 psf NNN - Suite 8315 650-5,301 SF Call for Pricing Buildings 1 & 3 Building #3 8315
Monthly Market Snapshot
 SEPTEMBER 2018 Vacancy continues to fall. Nearing the end of the third quarter, the vacancy rate dropped 10 basis points to 6.4%, compared to this time last month at 6.5%. Occupancy of the 1.1 million
CoStar Industrial Statistics. Y e a r - E n d Brownsville/Harlingen Industrial Market
 CoStar Industrial Statistics Y e a r - E n d 2 0 1 7 Brownsville/Harlingen Industrial Market Brownsville/Harlingen Industrial Market Year-End 2017 Brownsville/Harlingen Table of Contents Table of Contents.................................................................
MARKET REPORT. Manhattan Office Sector Continues Recovery as Downtown Breaks Record MANHATTAN SNAPSHOT 4.2% 0.8PP 1.98MM SF MANHATTAN OFFICE
 3Q 2014 OFFICE MANHATTAN OFFICE MARKET REPORT MANHATTAN Leasing ACTIVITY Availability RATE ABSORPTION 4.2% 0.8PP Asking RENTS 2.3% Note: Compared to 2Q 2014 Statistics 1.98MM SF Manhattan Office Sector
Orange County Office Market Continues to Tighten Causing Rental Rates to Increase
 OFFICE ORANGE COUNTY MARKET REPORT Continues to Tighten Causing Rental Rates to Increase MARKET OVERVIEW MARKET INDICATORS - VACANCY 12.6% NET ABSORPTION 688,800 CONSTRUCTION 497,387 RENTAL RATE $2.26
Austin s office rental rates continue to grow along with its population
 Research & Forecast Report AUSTIN OFFICE Q3 2016 Austin s office rental rates continue to grow along with its population Kaitlin Holm Research and Marketing Coordinator Austin Austin continues to grow
Second Quarter: Suburban Maryland s Uptick in Leasing has yet to be Realized in Absorption Numbers
 Q2 2013 OFFICE SUBURBAN MARYLAND SUBURBAN MARYLAND MARKET REPORT Second Quarter: Suburban Maryland s Uptick in has yet to be Realized in Numbers Updated May 2012 MARKET INDICATIONS Q2 2013 Q3 2013 (p)
NAI Charter Real Estate Mid-Year Report
 NAI Charter Real Estate Mid-Year Report - 2012 V2.1 414 Vine Street Chattanooga, TN 37403 (o) 423.267.6549 www.naicharter.com From the President Market Overview The Chattanooga office market has been the
Negative Absorption Recorded For The First Time In Past Nine Quarters
 OFFICE SAN FERNANDO & VENTURA MARKET REPORT Negative Absorption Recorded For The First Time In Past Nine Quarters MARKET OVERVIEW MARKET INDICATORS - VACANCY 15.6% NET ABSORPTION -124,000 CONSTRUCTION
Office Market Activity Report
 Q2 2010 Office Market Activity Report Salt Lake County Second Quarter 2010 Office Market Overview - Q2 2010 Change since: Current Q1 10 Q4 09 Direct Office Vacancy 15.97% Sublease Vacancy 1.49% Average
San Antonio 4th Quarter 2014 INDUSTRIAL. Market Trends COMMERCIAL REAL ESTATE INFORMATION
 San Antonio 4th Quarter 2014 INDUSTRIAL Market Trends COMMERCIAL REAL ESTATE INFORMATION Table of Contents/Methodology of Tracked Set Table of Contents/Methodology of Tracked Set 2 San Antonio Market Map
NORTH PARK CORPORATE CENTER
 PHASE II / SAN ANTONIO, TEXAS INVESTMENT SUMMARY THE OFFERING HFF is pleased to offer the opportunity to purchase North Park Corporate Center Phase II (the Property ), a high-quality project consisting
Market Overview TAMPA BAY OFFICE THIRD QUARTER
 Market Overview TAMPA BAY OFFICE THIRD QUARTER 29 COLLIERS ARNOLD TAMPA BAY Insights on the Market OFFICE THIRD QUARTER 29 MARKET INDICATORS TAMPA BAY INVENTORY 8,58,612 Sq. Ft. Q3 Q4* OVERALL VACANCY
3 RD QUARTER 2016 RICHMOND INDUSTRIAL MARKET REPORT
 3 RD QUARTER 2016 RICHMOND INDUSTRIAL MARKET REPORT FORECAST The Richmond Industrial market continued trending in the positive direction in the third quarter, with the absorption of over 320,000 square
DMW & Associates. HOUSTON, TEXAS Sugar Land/Missouri City Office Lease Options. Prepared for: Prepared by:
 HOUSTON, TEXAS Sugar Land/Missouri City Office Lease Options Prepared for: DMW & Associates Prepared by: MARGARET ANN COOK, Vice President 1900 West Loop South, Suite 1300 Houston, TX 77027 713.272.1223
Davenport Village 360 at Westlake Drive
 FOR LEASE > Highway visibility at signalized intersection > Incomes in excess of $120,000 within 5 miles > Over 50,000 VPD on 360 > Rare 2nd generation restaurant opportunity Space Available 985-8,082
SOUTH FLORIDA RESIDENTIAL MARK E T REPOR T SECOND QUAR TER
 2017 SOUTH FLORIDA RESIDENTIAL MARK E T REPOR T SECOND QUAR TER Coconut Grove Condos posted an increase of 6% in the number of overall closed sales, year over year. Additionally, the average sales price
A G E N D A PLANNING AND ZONING COMMISSION REGULAR MEETING. City Hall, City Council Chambers 212 North Bonner Avenue Tyler, Texas
 A G E N D A PLANNING AND ZONING COMMISSION REGULAR MEETING City Hall, City Council Chambers 212 North Bonner Avenue Tyler, Texas Tuesday, June 7, 2016 1:30 p.m. *********************************************************************************
HISTORICAL VACANCY VS RENTS. Downtown Los Angeles Office Market Q Q RENTS VACANCY $31 2Q10 2Q11 2Q12 2Q13 2Q14
 www.colliers.com/losangeles OFFICE LOS ANGELES MARKET REPORT Rate Decrease Below 20% As Market Activity Remains Flat MARKET OVERVIEW MARKET INDICATORS - VACANCY 19.5% The Downtown Los Angeles market in
MARKET SUMMARY MICHIGAN, METRO DETROIT AREA FOURTH QUARTER 2016 P LAN T E M OR AN CRES A. pmcresa.com
 FOURTH QUARTER 2016 MICHIGAN, METRO DETROIT AREA MARKET SUMMARY P LAN T E M OR AN CRES A 26300 NORTHWESTERN HIGHWAY SOUTHFIELD, MI 48076 248.223.3500 pmcresa.com Connect with us for more information: Subscribe
4Q 16. Columbus Market Report. 605 S Front St Suite 200 Columbus OH
 4Q 16 Columbus Market Report 605 S Front St Suite 200 Columbus OH 43215 www.ohioequities.com 614 224 2400 Columbus Table of Contents 01 Office Market Report 02 Retail Market Report 03 Industrial Market
Market Research. Market Indicators
 colliers international LAS VEGAS, NV Market Research OFFICE Third Quarter 2009 Market Indicators Net Absorption Construction Rental Rate Q3-09 Q4-2009 Projected Clark County Economic Data Jul-09 Jul-08
KNOWLEDGE REPORT 14.4% $ AT A GLANCE MARKET STATS. Market Activity Slows, But Outlook Remains Positive
 KNOWLEDGE REPORT Office Research & Forecast Report 2017 Colliers International Greater Cincinnati Market Activity Slows, But Outlook Remains Positive > ABSORPTION The Cincinnati office market posted positive
ACUTE CARE HOSPITAL 2626 FAIRFIELD AVENUE Fort Wayne, IN 46807
 FOR SALE OR SUBLEASE ACUTE CARE HOSPITAL 2626 FAIRFIELD AVENUE Fort Wayne, IN 46807 33,000 SF HOSPITAL This 48-bed hospital is situated on 0.65 acres and was custom built in 2007. The property has 44 private
First Quarter Industrial Market Report 2017
 First Quarter Industrial Market Report 2017 03 04 04 04 05 06 08 09 10 11 13 Executive Summary National Economy Local Economy Oklahoma City Industrial Market Leasing Net Absorption and Inventory Rental
Denver s Retail Sector Keeps Rolling 500, , , , , , , , ,000 50,000. Square Feet
 Research & Forecast Report METRO DENVER RETAIL Q4 2017 s Retail Sector Keeps Rolling Market Overview Net absorption finished the second half of 2017 with strong positive numbers from s Central and Northwest
ANDY'S FROZEN CUSTARD 20 YR. ABSOLUTE NET
 ANDY'S FROZEN CUSTARD 20 YR. ABSOLUTE NET 3541 PLANO PKWY THE COLONY, TX 75056 Lee McLean III, CCIM Senior Advisor 417.887.8826 lee.mclean@svn.com Peter Colvin Council Chair of Single Tenant Investments
YEAR-END CHICAGO SUBURBS Office Market Report. Big Moves Create Negative Absorption Driving Vacancy Rates Higher. YTD Net Absorption
 CHICAGO SUBURBS Office Market Report Net Absorption (1,919,191) Availability 24.1% Big Moves Create Negative Absorption Driving s Higher MARKET CONDITIONS: The suburbs had several major real estate occurrences
Major tenant contractions and impending corporate development set the stage for 2014 and beyond
 Q1 2014 OFFICE MINNEAPOLIS-ST. PAUL OFFICE MARKET REPORT Major tenant contractions and impending corporate development set the stage for 2014 and beyond SF Absorbed Percent Vacant MARKET INDICATORS Q1
Strong Marketwide Leasing Activity Points To A Strong Finish for Tri-Cities
 OFFICE TRI-CITIES MARKET REPORT Strong Marketwide Leasing Activity Points To A Strong Finish for Tri-Cities MARKET OVERVIEW MARKET INDICATORS - VACANCY 14.9% NET ABSORPTION 254,6 CONSTRUCTION 113,8 RENTAL
The CoStar Office Report
 The CoStar Office Report Y E A R - E N D 2 0 1 1 YEAR-END 2011 JACKSONVILLE Table of Contents Table of Contents.................................................................... A Methodology........................................................................
Vacancy Inches Higher, Despite Continued Absorption
 Research & Forecast Report GREATER PHOENIX OFFICE 1Q 2017 Vacancy Inches Higher, Despite Continued Absorption Key Takeaways > > Improving conditions in the Greater Phoenix office market took a pause in
Positive Net Absorption Recorded For The Ninth Consecutive Quarter
 OFFICE SAN FERNANDO & VENTURA MARKET REPORT Positive Net Absorption Recorded For The Ninth Consecutive Quarter MARKET OVERVIEW MARKET INDICATORS - VACANCY 15.2% NET ABSORPTION 116,700 CONSTRUCTION 120,933
The Market at Parmer 2501 W. Parmer Lane, Austin, TX 78727
 The Market at Parmer 2501 W. Parmer Lane, Austin, TX 78727 The Market at Parmer is a 122,349 SF neighborhood community retail center that was constructed in 1985. The property is located at the southeast
Office Stays Positive
 Q2 2014 OFFICE LAS VEGAS NEVADA RESEARCH & FORECAST REPORT Office Stays Positive While it may not always be pretty, Southern Nevada s office market continues to improve. Net absorption increased in the
Miami-Dade County Office Market Report 4Q Real Capital Partners Real Estate Services. *Data Source CoStar Miami-Dade County Office Market Report
 Miami-Dade County Office Market Report 4Q 216 Real Capital Partners Real Estate Services *Data Source CoStar Miami-Dade County Office Market Report 4Q 216 Miami-Dade County Office Market Report Overview
The CoStar Office Report. M i d - Y e a r San Antonio Office Market
 The CoStar Office Report M i d - Y e a r 2 0 1 5 Mid-Year 2015 San Antonio Table of Contents Table of Contents................................................................. A Methodology......................................................................
CoStar Industrial Statistics. T h i r d Q u a r t e r Long Island Industrial Market
 CoStar Industrial Statistics T h i r d Q u a r t e r 2 0 1 7 Third Quarter 2017 Long Island Table of Contents Table of Contents................................................................. A Methodology......................................................................
Oklahoma City. Year-End 2007 Office Market Summary
 Oklahoma City Year-End Office Market Summary TABLE OF CONTENTS Office Market Summary 1 Central Business District Submarket 2-3 Northwest Submarket 4-6 North Submarket 7-9 Midtown Submarket 10-11 West Submarket
A G E N D A PLANNING AND ZONING COMMISSION REGULAR MEETING. City Hall, City Council Chambers 212 North Bonner Avenue Tyler, Texas
 A G E N D A PLANNING AND ZONING COMMISSION REGULAR MEETING City Hall, City Council Chambers 212 North Bonner Avenue Tyler, Texas Tuesday, October 4, 2016 1:30 p.m. *********************************************************************************
OFFICE MARKET ANALYSIS
 OFFICE MARKET ANALYSIS KYLE BROWN RMLS Fellow, Master of Real Estate Development Candidate Amid some encouraging signs nationally, the Portland office market has maintained its stability, with the CBD
2Q 16. Long Island Market Report
 2Q 16 Long Island Market Report Long Island Office 2Q 216 Long Island 2Q16 Office Office Report The Long Island Office market ended the second quarter 216 with a vacancy rate of 7.5%. The vacancy rate
Market Research. Market Indicators
 colliers international LAS VEGAS, NV Market Research OFFICE Second Quarter 2009 Market Indicators Net Absorption Construction Rental Rate Q2-09 Q3-2009 Projected Clark County Economic Data UNEMPLOYMENT
RETAIL MARKET REPORT. Northwest Arkansas. 4th Quarter Q4 Market Trends 2017 by Xceligent, Inc. All Rights Reserved
 RETAIL MARKET REPORT Northwest Arkansas 4th Quarter 2016 Table of Contents/ Methodology of Tracked Set Xceligent is a leading provider of verified commercial real estate information which assists real
The CoStar Office Report
 The CoStar Office Report Y E A R - E N D 2 0 0 8 YEAR-END 2008 PHOENIX Table of Contents Table of Contents.................................................................... A Methodology........................................................................
The Crossings, Lethbridge
 The Crossings, Lethbridge Market Study Update October 2012 Prepared for: City of Lethbridge Prepared by: MXD Development Strategists Ltd. www.mxddevelopment.com 0 Retail Market Update According to a 2012
MARKET REPORT FIRST QUARTER Positive Absorption and Weak Leasing the Story of the First Quarter Q SUBURBAN MARYLAND OFFICE MARKET SUMMARY
 Q1 2015 SUBURBAN MARYLAND OFFICE SUBURBAN MARKET REPORT MARYLAND Q1 2015 OFFICE SUBURBAN MARYLAND OFFICE MARKET REPORT FIRST QUARTER 2015 Positive Absorption and Weak Leasing the Story of the First Quarter
Office Report. Sacramento Valley Second Quarter City, State Year.
 Office Report City, State Year Sacramento Valley Second Quarter 2014 Offices in Burlingame, Los Altos, Monterey, Oakland, Palo Alto, Pleasanton, Sacramento, Salinas, San Francisco, San Jose, San Rafael,
KEY TOWER SALE highlights start of 2017
 KEY TOWER SALE highlights start of 2017 Demand for office space in the Greater Cleveland office market remained strong as 2016 wound down and transitioned into the first quarter of 2017. After netting
Q OFFICE, INDUSTRIAL & FLEX MARKETS ISSUE # 003 LEHIGH VALLEY COMMERCIAL REAL ESTATE REPORT IN THIS ISSUE
 ISSUE # 003 LEHIGH VALLEY COMMERCIAL REAL ESTATE REPORT OFFICE, INDUSTRIAL & FLEX MARKETS One of the core principles of the Lehigh Valley Economic Development Corporation (LVEDC) is to serve as the leading
REAL ESTATE INFORMATION
 Minneapolis, MN 4th Quarter 2014 OFFICE Market Trends COMMERCIAL REAL ESTATE INFORMATION Table of Contents/Methodology of Tracked Set Table of Contents/Methodology of Tracked Set 2 Minneapolis Office Market
OFFICE MARKET ANALYSIS
 OFFICE MARKET ANALYSIS A. SYNKAI HARRISON Portland State University Nationally the office sector experienced its best performance in years according to the National Real Estate Investor as employment in
MUELLER MARKET DISTRICT
 Available Space Mueller Activity - Under Construction 1,000 SF - 5,830 SF Call for rates NNN - $6.06 PSF/YR (estimate) HEB is scheduled to open June 2013 Shell space will be delivered Q1 2013 Property
Orange County Office Market Continues A Positive Stride Into 2016
 OFFICE ORANGE COUNTY MARKET REPORT Continues A Positive Stride Into 2016 MARKET OVERVIEW MARKET INDICATORS - VACANCY 12.8% NET ABSORPTION 143,900 CONSTRUCTION 594,300 RENTAL RATE $2.31 P FSG UNEMPLOYMENT
Market Report. Manhattan Q Significant findings in Q3 2008
 Market Report StreetEasy is pleased to present our Quarterly Report on the residential market, starting with a special section called Market Snapshot. While the bulk of the report is based on over 4,500
National Presence. Local Focus
 Metropolitan DC Market Overview 4Q 214 Overall Market Summary The Washington, DC Metropolitan commercial real estate market is comprised of approximately 41.9 million square feet of rentable office space
The CoStar Office Report
 The CoStar Office Report T H I R D Q U A R T E R 2 0 1 2 THIRD QUARTER 2012 PHOENIX Table of Contents Table of Contents.................................................................... A Methodology........................................................................
NAI REOC San Antonio San Antonio Retail Market I Third Quarter 2011
 MEDIA RELEASE Contact: Kim Gatley Senior Vice President & Director of Research NAI REOC San Antonio P 210 524 4000 I F 210 524 4029 kgatley@naireocsanantonio.com www.naireocsanantonioblog.com SAN ANTONIO
>> Vacancy Stabilizes As Rents Rise To End 2016
 Research & Forecast Report DOWNTOWN L.A. OFFICE Q4 216 Accelerating success. >> Stabilizes As Rents Rise To End 216 Key Takeaways > After six consecutive quarters of declines, the overall vacancy rate
Office Report. Sacramento Valley First Quarter City, State Year.
 Office Report City, State Year Sacramento Valley First Quarter 2014 Offices in Burlingame, Los Altos, Monterey, Oakland, Palo Alto, Pleasanton, Sacramento, Salinas, San Francisco, San Jose, San Rafael,
Lakeline Market Southwest corner of US Hwy 183 & Lakeline Blvd, Austin, Texas 78717
 Lakeline Market Southwest corner of US Hwy 183 & Lakeline Blvd, Austin, Texas 78717 Lakeline Market is a 253,000 SF regional shopping center that was constructed in 2012 by a partnership of the HEB Grocery
The CoStar Industrial Report. T h i r d Q u a r t e r Asheville Industrial Market
 The CoStar Industrial Report T h i r d Q u a r t e r 2 0 1 4 Third Quarter 2014 Asheville Table of Contents Table of Contents................................................................. A Methodology......................................................................
Suburban Maryland. Quarterly Market Report. 3rd Quarter lpcwashingtondc.com
 Suburban Maryland Quarterly Market Report Table of Contents Metropolitan D.C. Market Overview...3 Suburban Maryland Quarterly Overview...5 Suburban Maryland Top Leases... 8 Suburban Maryland Top Sales...
CoStar Office Statistics. Y e a r - E n d Tucson Office Market
 CoStar Office Statistics Y e a r - E n d 2 0 1 6 Year-End 2016 Tucson Table of Contents Table of Contents................................................................. A Methodology......................................................................
2Q 17. Office Market Report
 2Q 17 Office Market Report Low vacancy rates and steady rental rates characterize the Portland office market Portland s office market has reached a level of strength not seen since the great recession.
Q New York City. Market Update. Web:
 Q3 2017 New York City Market Update Web: 00111270 All New York City Luxury Market 04 Market Overview 09 Luxury Market 05 Market Snapshot All Areas 06 Inventory Absorption Rate 07 Days on Market Listing
Second Quarter Industrial Market Report 2017
 Second Quarter Industrial Market Report 2017 03 04 04 04 05 06 08 09 10 11 13 Executive Summary National Economy Local Economy Oklahoma City Industrial Market Leasing Net Absorption and Inventory Rental
Year End 17. Office Market Report
 Year End 17 Office Market Report INDIANAPOLIS, INDIANA The Market Our Year End Market Report shows continued velocity in the office market. However, there has been a significant decline in net absorption
First Quarter Multi-Family Market Report 2018
 First Quarter Multi-Family Market Report 2018 03 04 04 05 05 06 07 07 08 10 Executive Summary National Economy Local Economy OKC Multi-Family Market Leasing by Class and Unit Mix OKC Multi-Family Market
Oklahoma City 2018 Mid-Year Office Market Summary
 Oklahoma City Mid-Year Office Market Summary TABLE OF CONTENTS Office Market Summary 1 Central Business District Submarket 2 3 Northwest Submarket 4-7 North Submarket 8-10 Medical Office Submarket 10 Midtown
Chicago CBD. 4.1% Chicago s unemployment rate continued to trend downward, standing at 4.1% as of May 2017.
 Second Quarter 2017 Office Market Report Chicago CBD Market Facts 4.1% Chicago s unemployment rate continued to trend downward, standing at 4.1% as of May 2017. 34,400 jobs The Chicago metro area added