Risk Component Based Infrastructure Debt Valuation Analysis and Long-Term Investment
|
|
|
- Arron Barton
- 6 years ago
- Views:
Transcription

1 Journal of Financial Risk Management, 2016, 5, ISSN Online: ISSN Print: Risk Component Based Infrastructure Debt Valuation Analysis and Long-Term Investment Chunlan Wang 1, Satheesh Kumar Sundararajan 2 1 Treasury, The World Bank, Washington DC, USA 2 Financial Solutions, The World Bank, Washington DC, USA How to cite this paper: Wang, C. L., & Sundararajan, S. K. (2016). Risk Component Based Infrastructure Debt Valuation Analysis and Long-Term Investment. Journal of Financial Risk Management, 5, Received: May 13, 2016 Accepted: September 6, 2016 Published: September 9, 2016 Copyright 2016 by authors and Scientific Research Publishing Inc. This work is licensed under the Creative Commons Attribution International License (CC BY 4.0). Open Access Abstract Long term financing to infrastructure and mobilization of private long term capital has been recognized as a key agenda in advancing the global economic development. There are several barriers in infrastructure financing and big gaps between expectation and reality. A highly pronounced barrier is the lacking of capacity of investors to price risks in a structured manner. This paper has discussed component-based infrastructure valuation analysis and modeling blocks. The component-based valuation mechanism is very useful for issuers and investors to categorize, analyze and price specific risks transparently and can provide a basis for structuring the risks on an ex-ante basis so as to make project investments suitable for investors of different risk preference. Keywords Infrastructure Debt Valuation, Credit Asset Pricing, Default Probability, Component Approach 1. Introduction Long term financing to infrastructure has been recognized as a key issue in various global forums including OECD-G20 work on Institutional Investors and Long Term Investment. Basel III regulation has constrained the availability of long term capital to less liquid and real asset class such as infrastructure. On the other hand, Holy Grail discussion on exploring capital from institutional investors to infrastructure is gaining traction across the industry in developed and developing nations. A recent report from DOI: /jfrm September 9, 2016
2 the World Bank 1 states that institutional investor capital with an AUM that is approximate USD 110 tn has current investment of only less than 2% of their portfolio in emerging market infrastructure. There are many barriers such as regulatory, risk profile of projects, benchmark curve, pricing framework, investment management capacity, etc. quoted for reasons why such gaps exist between expectation and reality. A highly pronounced barrier often noted is the lack of capacity of investors to price risks in a structured manner. In infrastructure financing and long term investment, one critical barrier among others is lacking of a transparent and robust pricing framework underpinned on credit asset pricing theory and aligned with industry pricing models. Infrastructure assets are real assets with combination of systemic and high idiosyncratic risks requiring different risk management approaches in comparison to a financial asset. Pricing infrastructure investments on a long-term basis post a significant challenge for institutional investors. While risk preference of investors can be assessed on a global basis, and the availability of range of risk mitigation instruments to manage many specific risks creates a trade-off between accepting some risks and mitigating some at a cost. But a precursor to that is the investor s ability to identify, analyze and price specific risks on a long term basis. Traditional loan pricing and single scenario approach cannot handle the infrastructure debt valuation since different types of risk components are embedded in underlying projects (cash flows). Some recent researches have proposed valuation method for infrastructure debt, like the valuation framework described in EDHEC 2014 paper and Moody s KMV (2010) modeling approach. This paper used the valuation framework designed in EDHEC s paper on infrastructure debt valuation by Blanc-Brude, Hasan, & Ismail (2014) as platform. On the top of it, we introduced and built component-based valuation mechanism and modeling blocks. The model is calibrated to external agency s empirical default probability rate data (please refer to paper Infrastructure Default and Recovery Rates, H1, Moody s, 2012) to value the infrastructure debt. The paper developed and implemented the model and component-based valuation analysis for a hypothetical infrastructure project case. In addition, DSCR simulation, default probabilities and credit spread are calculated based on EDHEC framework. In this implementation, the stress-testing and factor sensitivity analysis of the underlying assumptions regarding project sources components (here it is traffic forecasts in the case study) are constructed. The source risk component testing is very important for issuers and investors to categorize, analyze and price specific risks transparently. It may help investors to make informed decision on the choice of risks to retain, pass through or take mitigation actions based on their preference. Such ability is likely to enhance their appetite on considering infrastructure investments more closely and can also provide a basis for structuring the risks on an ex-ante basis to make project investments suitable for investors of different risk preference. On a broader scale, the application of the debt valuation model and transparent project structuring analysis may help assess and calibrate portfolios towards meeting prudential regulatory frameworks
3 and also facilitate secondary market transactions and promote disclosure of risks on an open basis. For this study, a hypothetical case is built and modeled. In this case, a toll road project is structured. The project is financed by bank loan for the construction period and then refinanced through infrastructure bonds or unlisted infrastructure debt by long term investor from capital markets when the construction is completed and moved into operation stage. The project period is expected to be 25 years, with a construction period of 5 years. During the period from year 6 to year 23 (totally 18 years), the debt will be repaid. There is a tail period of 2 years from the year 24 to the year 25 when the debt is supposed to have been fully repaid. The tail period is considered as a kind of collateral in the sense that the cash flows may be used for debt restructuring when credit event occurs so as to mitigate credit risk at some extent. The total capital investment is assumed to be $100 million, of which 70% of total amount is financed by debt and 30% by shareholder s equity from project sponsor. The paper starts with a base scenario and stochastic cash flows simulation, then move to a calibrated DSCR simulation defaulting model and risk neutral credit asset pricing valuation. The robust business case includes all the major risk factors, so all the main risks embedded in DSCR measures including business risk and financial capital structure risk can be broken down transparently through factor sensitivity analysis and stress testing. The main input includes base cash flow projection and initial assumption on major variables. The assumption parameters are calibrated to external empirical default curves based on a calibrating process. The main output of the model includes marginal default probability, cumulative probability and credit spread terms structure, which could be used for pricing purpose. 2. Model Literature Review The traditional loan pricing method based on single base scenario cannot meet the requirements of valuing infrastructure debt which has uncertainty and risk coming from the factors embedded in the underlying project cash flows. Some researchers and practitioners have proposed VaR based approach to look at the dynamic risk features and project location specific idiosyncratic characteristic (Mishra, Kahasnabis, & Dhongra (2013), Research in Transportation Economics; Nobuhide (2006), Business Valuation of Location-Specific Infrastructure Projects in Data-Poor Regions, MIT). However, the determination of discounting rate which can incorporate different types of risk premium components is challenging if there is no robust cash flow simulation mechanism which can handle the risk premiums. Risk neutral cash flow simulation could be one approach to handle the risk premium components through risk neutral adjusted cash flow simulation. On the other hand, the typical corporate bond credit model based on exogenous factors is not a sufficient approach for the infrastructure debt valuation which has an interplay of complicated endogenous and exogenous characteristic alongside a high liquidity premium. In modern financial theory, structural approach based credit model is another pillar 124
4 for credit asset pricing. The traditional Black & Schole (1973) and Merton (1974) contingent claims-based approach to valuing corporate debt has become an important part of the theory of corporate finance. In this approach, interest rates are assumed to be constant, and the default risk of a bond is modeled using option pricing theory. In project finance credit pricing modeling, EDHEC and Moody s has discussed and utilized an approach based on the Merton s structure model and its extension aimed to build up a practical and generalized framework for infrastructure debt evaluation ( Unlisted Infrastructure Debt Valuation & Performance Measurement, EDHEC-Risk & NATIXIX, July 2014 and Moody s KMV (2012) CDS-Implied EDF TM Credit Measures and Fair-Value Spreads, Modeling Methodologies Moody s Analytics). In EDHEC s framework, it identified DSCR as risk measure and derived the defaulting probability and credit spread through DSCR and cash flow simulation. Although, it is effective to use DSCR as risk measure for cash flow simulation and valuation, the modeling and assessment of source risk components which drive the DSCR is very useful. According to the Author s understanding and research of literatures, no explicit research has been found that captures component-based valuation approach and modeling, which is a core contribution of this paper. This paper used the valuation framework described in EDEHEC paper as platform and then developed and built component-based valuation building blocks on the top of it. The source risk component testing is very important for issuers and investors to categorize, analyze and price specific risks transparently. It may help investors to make informed decision on the choice of risks to retain, pass through or take mitigation actions based on their preference. Such ability is likely to enhance their appetite on considering infrastructure investments more closely and can also provide a basis for structuring the risks on an ex-ante basis to make project investments suitable for investors of different risk preference. The paper also introduced and added the calibrating process of assumption parameters based on empirical default probability published by external agency (Moody s paper 2013). In addition to DSCR simulation and credit spread calculation, as described in EDHEC framework, the paper further breaks down the analysis of the risk components underlying the DSCR simulation and performs the stress testing analysis and factor sensitivity analysis, so that the endogenous nature of project credit risk can be assessed and considered transparently. 3. Modeling Implementation Blocks The paper provides analysis on a selected infrastructure finance model from Bank loan to bonds where the project is financed by commercial bank in construction period and then the debt is refinanced by long term institutional investors. The application of the model may provide insightful analysis for assessing infrastructure debt/bonds innovation through transparent risk and return characteristics underlying the project financing assets cash flows. As stated by the framework in EDHEC paper, the DSCR simulation is first conducted in its framework. This study starts with a robust project case with base scenario and stochastic cash flows simulation. When conducting cash flows simulation, it further 125
5 breaks down into risk into different risk components and conduct simulation on movement of individual risk components. Then it moves to a calibrated DSCR simulation defaulting model and risk neutral credit asset pricing valuation. The robust business case includes all the major risk factors, so all the main risks embedded in DSCR measures including business risk and financial capital structure risk can be broken down transparently through factor sensitivity analysis and stress testing. By using the robust valuation model, risk factors can be transparently measured and priced; the ex-anti risk may be structured and allocated. This will facilitate the process of making infrastructure debt/bonds as a separate asset class and the risk of the assets can be budgeted within the compliance level according to risk-return trade off and regulatory capital requirement. The main input includes base cash flow projection and initial assumption on major variables. The assumption parameters will be calibrated to external empirical default curves based on a calibrating process. The main output of the model includes marginal default probability, cumulative probability and credit spread terms structure, which could be used for pricing purpose. This paper describes the approach and modeling implementation of the pricing and valuation of infrastructure private debt and infrastructure bonds using a hypostatical toll road project under bank loan to bonds financing approach. Under bank loan to bonds financial model, the project is financed using the commercial bank loan during the construction period and then capital market instrument and investment by institutional investors once the project is in operational period. Risk components need to be mitigated and shared by different parties according to the respective risk undertaking capacity. In some cases, market failure and the mechanism used to address the problem need to be transparently analyzed. There are mainly two main two main parts in the implementation of the model as proposed by EDHEC 2014 paper on infrastructure debt valuation model. First part: It includes cash flow simulation and credit defaulting model based on structural model approach and DSCR (debt service coverage ratio) risk measure. In addition, in this paper, the simulated intermediate output is calibrated to industry parameter, e.g., external rating agency s probability of default of investment grade rating of infrastructure project financing. DSCR is used as the technical default trigger in EDHEC s model considering the credit risk feature of project financing, which is fully based on the project underlying cash flows (please see EDHEC paper about the unlisted infrastructure debt evaluation 2014 and the paper by Moody s (2006, 2010) on credit loan pricing, etc.). Second part: It includes debt pay off function models for infrastructure debt cash flows simulation and the valuation model. The EDHEC model adopts a risk natural valuation approach, and discount the debt service cash flows at risk free rate. As stated in risk neutral pricing model theory, all the credit risk and risk premium are reflected and adjusted in the simulated cash flow through the risk natural default probability. Physical default probability is converted to risk natural default probability. Risk neutral approach also provides the flexibility to process the embedded options and other financial 126
6 components. In the modeling implementation, the paper uses the framework described in EDHEC paper as platform, and components-based structure is developed and built on the top of it. Main steps to the implementation in this paper include 1) Building a robust base case; 2) Building Monte Carlo simulation cash flow model which is calibrated to industry empirical level of underlying cash flow risk characteristics with similar credit rating; 3) Stress testing the driving factors of project default and the impact on the credit rating of infrastructure debt; 4) Building infrastructure risk measure Debt Service Coverage Ratio (DSCR) simulation model and defaulting model based on the calibrated cash flow model; 5) Building debt cash flow pay off simulation functions; 6) Building credit risk pricing model using risk neutral approach/calculating Expected Loss and Deriving credit spread term structure. The model is implemented and built with and risk simulator testing environment. Main output include marginal default probability, cumulative default probability, expected loss, and infrastructure project financing credit spread term structure pricing curve. The section below will describe the specific building blocks and the implementation in a hypothetical project case. The Diagram below shows the main approach of the component based model framework Main Implementation Steps First a robust case needs to be set up to reflect the project specific context. In this case, a hypothetical toll road project is structured. The project is to be financed through PPP (Public Private Partnership)/Project Financing approach. The project is financed by bank loan for the construction period and then refinanced through infrastructure bonds or unlisted infrastructure debt by long term investor from capital markets when Location specific risk Business risk Revenue risk Expected Loss Business risk Cost overrun risk Financial risk capital structure GDP growth Currency risk (risk not controlled in PPP contracts) i) Simulate DSCR ii) Debt payoff simulation and expected loss Slice the expected loss First default Senior debt Pricing Spread and term structure Default risk spread Currency premium spread Country premium spread Liquidity premium spread Political Country risk Diagram. The framework of component based model. 127
7 the construction is completed and moved into operation stage. Main project risk factors are included and reflected through business traffic revenue, operating cost and life cycle cost, financial capital structure, tax, and inflation etc., So all the risk factors can be accessed robustly through their impact on the project default, expected loss and credit risk pricing. In the case, the projected cash flow is considered as a base scenario. In a typical project financing structure, while some risks such as construction or regulatory risks may be clearly controlled by the project participants, the traffic revenue risk may not be fully hedged by the PPP participants. The traffic revenue risk has often been one of the greatest challenges in project financing. The transportation projects are particularly subject to a variety of financial risks due to the large initial costs, high irreversibility (sunk costs), extended contract duration, and high contract complexity due to the involvement of several parties with different objectives and constraints (Checherita & Gifford, 2007). For transportation projects, appropriate mitigation of the financial risks by the project participants is one of the most critical success factors (Chiara & Garvin, 2007). Many projects fail due to high levels of risks and the inefficient risk sharing mechanisms between the public and private sectors (Cuttaree, 2008). Then Monte Carlo simulation for cash flow CFADS is set up. In the implementation, industry parameter calibration is conducted for further DSCR simulation. The single base case scenario does not include the risk volatility of the underlying project cash flows and therefore cannot reflect the actual riskiness of the project and cash flow to debt. A stochastic Monte Carlo cash flow model is established to model the project cash flows and embedded risk characteristics. The cash flow available to debt service (CFADS) can be obtained for each year using the formula below: CFADS = Nominal Revenue Operation & Maintenance Costs Life Cycle Costs Approx. Taxes Debt service coverage ratio (DSCR) is defined as the ratio of CFADS to total debt service including principal repayment and interest rate payment in each period. Basic stochastic variables assumptions: Distributions for the main driving variables like annual traffic growth in each period, operating costs per annum and life cycle costs per annum etc. are made to illustrate the mechanisms of the stochastic cash flow model. The main risk factor volatility parameters and DSCR are calibrated to industry external agency risk implied through empirical marginal defaulting probability. The implementation of this hypothetical case is calibrated to the empirical default probability in Moody s project financing study December 2012 (please refer to Infrastructure Default and Recovery Rates, H1, Moody s, 2012). In the implementation, we include the stress testing of the driving factors of project default and their impact on the credit rating of infrastructure debt. As discussed in previous section, it may be very useful for project structuring and risk assessment. In many cases, to serve the purpose of enlarging the investor base through enhancing the project debt credit rating to a higher grade e.g., investment grade, project sponsors need to 128
8 identify the driving factors which have impact on the default probability and take steps to mitigate some risk using risk mitigation instrument. As described above, the DSCR is used as technical default trigger in EDHEC model and the distribution of the DSCR can be used to determine the default probability profile. By running the sensitivity analysis against DSCR distribution, we can identify the factors which may explain risk variance of the DSCR and at what magnitude. E.g., the cost component is identified as a factor which has an important impact on DSCR distribution through sensitivity analysis. We can also quantify the impact of the volatility of the cost component on the DSCR. This can be done by looking at its impact on DSCR distribution and furthermore on the probability of default when increasing one standard deviation of the cost volatility. Based on the change of the default probability caused by the volatility of the cost component, together with an assumption on the recovery rate, the expected loss caused by the additional volatility of the cost component can be quantified. Sponsors may compare the expected loss and risk issuance premium for buying an issuance to mitigate some portion of the cost component risk so as to enhance the project rating (e.g., investment grade) and make decisions on whether to sell the risk and share it with some third party or retain the risk by issuing a bond with lower rating and paying a higher bond yield spread premium. As specified in EDHEC framework, after cash flow Monte Carlo simulation, Risk measure-debt Service Coverage Ratio (DSCR) simulation and defaulting is implemented based on the calibrated cash flows (please see EDHEC s unlisted infrastructure debt valuation and performance measurement, 2014). Based on the calibrated asset volatility and financial structure volatility, DSCR calibration and simulation model may be implemented. According to the simulated DSCR distribution, the project defaulting events and other states under all the simulated paths can be obtained for each period. Based on the simulated defaulting event according to DSCR distribution in each period for all the paths, the debt cash flow payoff functions is built. An assumption of recovery rate should be made according to the industry empirical observation data for project finance discounted debt. Considering the situation that the purpose of this paper is mainly aimed to provide the valuation solution for institutional investors and that the restructuring option might not be the most efficient and cost effect option for institutional investors, the payment cash flows are assumed to be the discounted value of the recovered outstanding asset s clash flows when a default occurs. For the specialized asset restructuring and management company, they may model and incorporate the restructuring option and analyze the debt value by replacing the recovery component with restructuring option and other exit events. Finally, credit risk pricing model uses risk natural approach, calculates expected loss and derives credit spread term structure. In risk neutral asset pricing framework, the simulated cash flows are risk adjusted and the cash flows are discounted by risk free reference rate. In this study, swap LIBOR rate is used as a reference rate. By discounting all the outstanding debt payoff cash flows using risk free rate as of a specific period 129
9 along each simulated path, expected loss and credit spread can be computed as of each future time. Here, the cash flows are the risk neutral cash flows generated based on the risk neutral volatility simulation. The expected loss is calculated as the difference between the average of the present value of the simulated cash flows along all the paths as of a specific date for all the future periods and the present value of the scheduled debt service cash flows as of the specific date. As stated in financial theory literatures (please refers to Merton (1974) and Black & Cox (1976) for risk assets valuation), credit assets are treated as two parts, risk assets and risk free assets. The difference between the values of the two reflects the risk embedded in the credit risk spread Implementation in a Transportation Project Case For this study, a hypothetical case is built. In this case, a toll road is to be built. The project period is expected to be 25 years, with a construction period of 5 years. During the period from year 6 to year 23 (totally 18 years), the debt will be repaid. There is a tail period of 2 years from the year 24 to the year 25 when the debt is supposed to have been fully repaid. The tail period is considered as a kind of collateral in the sense that the cash flows may be used for debt restructuring when credit event occurs so as to mitigate credit risk at some extent. The total capital investment is $100 million, of which 70%, total amount of $70 million, is financed by debt and 30% by shareholder s equity from project sponsor. The following describes the implementation of the model building blocks in each step discussed in Section Base Scenario with Projected Cash Flows In this case, the project revenue is mainly driven by traffic volume and toll rate. Traffic volume is determined by base traffic plus an annual growth for each year. The base traffic without growth is projected around 3.2 million vehicles each year. The base annual traffic growth rate is projected to be around 2.6% to 2.8% for the first six year after the conduction is completed (year 6 to year 11) and declines to around 2% in the following 5 years (year 12 to year 16), thereafter it is reduced to around 1.7% to 1.2% during the last 9 years (year 17 to year 25). The toll rate includes real toll rate and inflation adjusted nominal toll rate. The real toll rate is derived from a traffic volume band matrix. Assume that there are three bands for the traffic volumes: 1 million to 1.5 million, 1.5 million to 1.75 million, and 1.75 million and above. Accordingly, the real toll rates are determined respectively at $2, $1.65 and $1.35. The nominal toll rate is obtained by adjusting the real rate with inflation. The year to year inflation growth is assumed to be 2.5%. Using the projected traffic volume and toll rate, we get the real revenue and inflation adjusted nominal revenue. The cost mainly includes the following variables: Operation & Maintenance Cost (O & MC) and Life Cycle Costs (LCC). Assume Operating Costs per annum is $165 M, Life Cycle Cost per annum is $180 M, by applying the nominal toll rate to the cost, O & M and LCC can be calculated. The approximate tax cost is calculated with a tax rate assumption of 30%. The tax base is using nominal revenue subtracting O & MC/LCC and annual debt service amortization. 130
 under base scenario is around $3.")
10 Finally, the debt service payments schedule is determined by amortizing the principle repayment during the period from year 6 to year 23 (18 years) and 6% of interest rate is assumed for the interest cost service payment occurred in each period. According to the projection, The cash flow available to debt service (CFADS) under base scenario is around $3.5 million to $7 million during the period from year 6 to year 23 and the total debt service amount is around $3.2 million. In a revenue availability based infrastructure project as this hypothetical project, the debt payment is mainly structured to have a slowly raising DSCR to meet the requirements from debtor for partially mitigation of the revenue risk. With the deleveraging of the project capital structure, the DSCR is around 1.2 and slowly grow to around 2.5 in the base case. The main cash flow variables and projected cash flows in base case for each 6 months period starting from period 1 (the first half of year 1) to period 50 (the second half of year 25) can be generated Monte Carlo Simulation: CFADS Cash Flow and Industry Parameter Calibration In this case, for scholastics cash flows modeling, initial assumptions are made for the main variables. Specifically, assumption about the traffic annual growth rate in each period is a normal distribution with a volatility of 20% and a mean of the projected base value as given above in the base case; the assumption for Operating Costs per annum and Life Cycle Costs per annum is a normal distribution with a volatility of 8% and a mean of the projected base value. Distribution of cash flows (CFADS): as shown in Figure 1, the simulated CFADS distribution in each period can be approximated as a normal distribution with an increasing mean and volatility. It can be mainly explained by the growing traffic and net Figure 1. Distribution of cash flow CFADS. 131
11 revenue, and bigger accumulated volatility along a longer horizon. The mean ranges roughly from $3 million to $7 million and volatility is around 20%. Distribution of Infrastructure Project Financing Risk Measure DSCR/Industry Parameter Calibration: As shown in Figures 2(a)-(c), under this hypothetical case and assumption with the main variables, the distribution of DSCR is approximately following a normal distribution in each period with a slowly growing mean and increased volatility. The mean of the approximated local normal distribution roughly ranges from 1.2 to 2.2 and volatility is about 10% to 20%. The first vertical line from left in Figure 2(c) represents the technical default trigger level and the area on the left represents the probability in the first period when DSCR is lower than the threshold (here assumed to be 1.1), that is, the project technically defaults. Other vertical lines in Figure 2(c) are made to illustrate the DSCR level where DSCR falls on the left to the trigger level with a certain probability (e.g., 5%) in very late periods. When sorting all the DSCR paths in Figure 2(c) for a specific period, the area which is on the left side to the DSCR technical default trigger vertical line (DSCR = 1.1) gives the probability of default in this period. Based on general industry practice, marginal probability of default can be calculated as the new default of the paths in each period conditional on that the same paths survived in the previous periods. Please see Moody s (2006) paper: Credit Risk and Loan Evaluation for the definition of marginal probability of default. The risk factor parameters can be calibrated to an industry empirical through mapping default probability based on DSCR distribution to external agency published empirical default probability Stress Testing of the Driving Factors of Project Default and the Impact on the Credit Rating of Infrastructure Debt We discuss and illustrate the process and usage of the stress testing of the driving factors of project default through the example below and the impact on risk mitigating and credit rating enhancement. Based on the DSCR distribution and the DSCR trigger threshold (assume 1.1) for technical default, we can calculate the default probability. In Figure 3(a), the derived default probability in this DSCR distribution is around 6% - 8% in the period after construction, which is higher than the external rating agency s empirical probability of default statistics for investment graded project financing. In Moody s (2010) industry study for project financing default and recovery, the default probability is around 2% - 3% in the first 5 year after the construction and then declines to a number which is very low, less than 1% (please refer to the paper: Moody s (2010), Default and Recovery Rates for Project Finance Bank Loans, ). While both revenue risk and cost overrun risk factors are identified as main driving factors of DSCR distribution and the project default, normally, in an availability based project, the revenue risk would be categorized as commercial risk and retained in the project. Investors need to price in this risk when valuing the credit spread of the infrastructure debt or bonds. In contrast, sponsors may need to take measures to mitigate some of the cost overrun using risk insurance instrument to upgrade the project rating 132
 DSCR")
 DSCR")
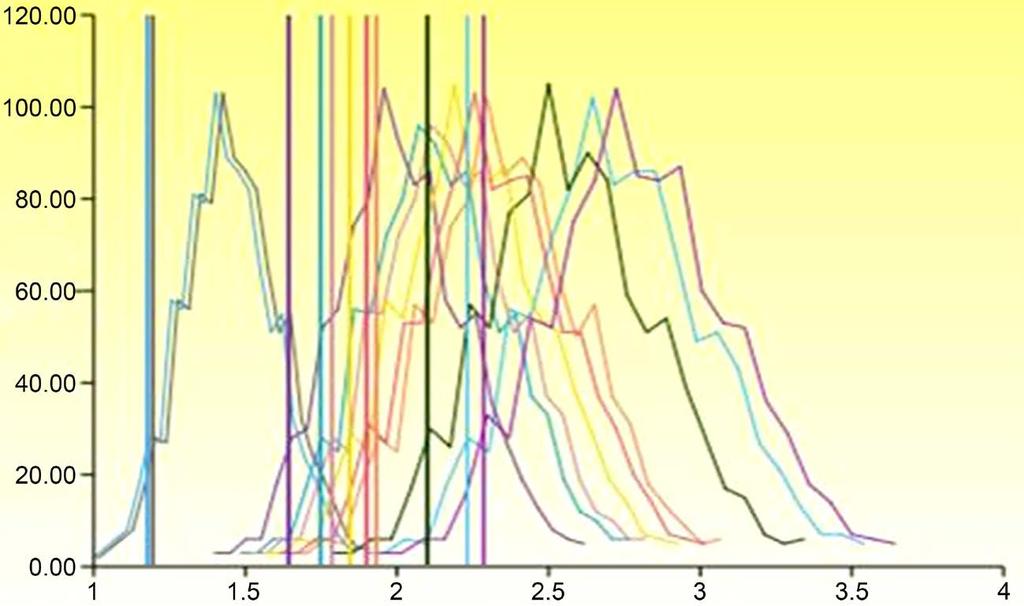
12 (a) (b) (c) Figure 2. (a) DSCR distribution-mean, (b) DSCR distribution-standard deviation, (c) DSCR distribution. 133
13 to an investment grade to enlarge the investor s base. This will have an impact on the distribution of DSCR and have the default probability reduced to be a level when mapping it to default probability empirical data. In Figure 3(b), the DCSR distribution is displayed for the project after some cost overrun risk volatility is reduced and mitigated using risk mitigating instrument or thirty party insurance. By uplifting and enhancing the credit rating of the project financing debt, the infrastructure debt or bonds may be financed through a larger investor base since the investment grade rating of the instrument may make the infrastructure debt to be included in legible asset classes for long term investors like Pension, Insurance and Sovereign Wealth Funds according to their investment guidelines. The lower volatility of cost component would cause a CFADS/free cash flow with narrower dispersion and this characteristic is passed to and reflected in the DSCR distribution. As shown in Figure 3(b), after the partial mitigation of cost overrun risk, the DSCR would be shifted to the right a bit and dispersion is narrowed. According to the new DSCR distribution, the probability of default is reduced to around 3% - 5% after hedging some of the cost overrun risk. This cost risk volatility reduction can be achieved by using commercial insurance etc. The value of the insurance should be reflecting the expected loss component reduced by the default probability reduction. A certain recovery assumption is made for the expected loss calculation illustrates this impact. Figures (Figures 3(a)-(d)) show the DSCR distribution before and after cost component risk mitigation. As an illustration, Figure 3(c) shows the DSCR distribution after the risk mitigation in one specific period. Figure 3(d) shows the distribution of free cash flows after risk mitigation, which has a narrower dispersion, and its mean is shitted to the right a bit. As shown in Figure 3(c), as an example, the DSCR has a lower probability of default reduced to around 5%. Through sensitivity analysis and testing, project sponsors may find an appropriate level and balance in terms of mitigating or retaining the risk through analyzing the relationship between the risk factor volatility and their impact on the infrastructure debt defaulting probability, and finally on the expected loss and credit rating Infrastructure Risk Measure Debt Service Coverage Ratio (DSCR) Simulation and Marginal Defaulting Probability Term Structure Based on the DSCR modeling and discussion in EDHEC paper 2014 and industry credit risk calibration with external rating agency s empirical default probability statistics for investment grade project financing, assumptions are made for some major variables for DSCR simulation and project finance default model implementation. In this hypothetical case for a toll road, the DSCR is calibrated to a lognormal distribution, with a mean reverting growth rate to 1.5% in the total project life cycle and 15% volatility of the growth. The starting value for DSCR is 1.3 and the volatility of the local normal distribution is 15% in the period 11 which is the period immediately after the construction is completed. As assumed above, a lognormal growth distribution for period 12 and thereafter is assumed. 134
 135")

14 (a) (b) (c) 135
 Stress testing of driving factors (DSCR distribution before partial risk mitigation cost component); (b) Stress testing of driving factors (DSCR distribution after partial risk mitigation of cost")
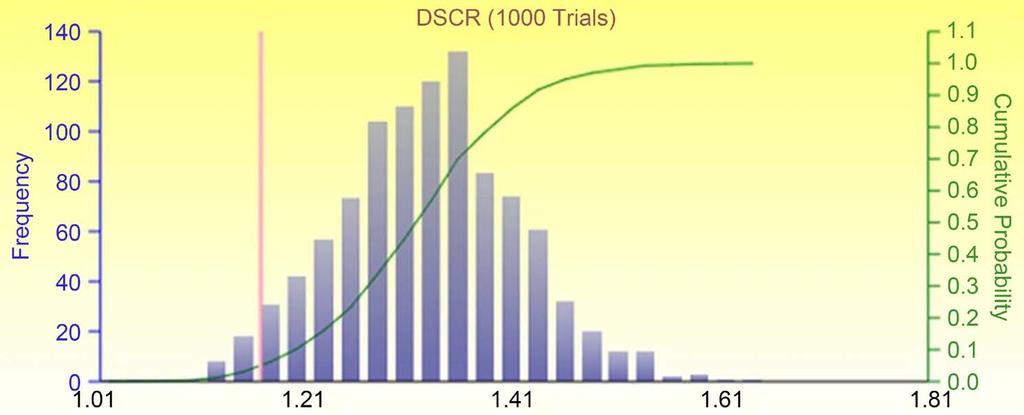
15 C. L. Wang, S. K. Sundararajan (d) Figure 3. (a) Stress testing of driving factors (DSCR distribution before partial risk mitigation cost component); (b) Stress testing of driving factors (DSCR distribution after partial risk mitigation of cost component); (c) DSCR distribution after risk mitigation; (d) Free cash flow after risk mitigation. Based on DSCR simulation, the marginal default probability which is conditional on the surviving of the previous period can be calculated for each period starting from year 6 to year 23 in this case. The details about the approximated local normal distribution of DSCR simulation are shown in Figure 4(a) and Figure 4(b). Figure 5 and Figure 6 show the DSCR simulation results for some specific periods. Figure 5(a) shows the distribution of DSCR in period 11 (the first half of the year 6). The DSCR starts with this period as a local normal distribution. Technical default trigger: DSCR = 1.1; mean = 1.3, vol = 15% (annual); Default probability: 2.3%. As indicated, a lognormal growth distribution for period 12 and thereafter is assumed. Figure 5(b) shows the distribution profile of DSCR for period 12 (the second half of the year 6). It is shown that the DSCR s distribution can be approximated as a local normal distribution. Technical default trigger: DSCR = 1.1; mean is 1.31, volatility is around 12%, Default probability: 1.4%. To look at another point of the marginal defaulting term structure, the figures below plot the DSCR distribution and also give the approximate local normal distribution statistics for a later period, the year 7 (the second year after the construction) to make the analysis easier and more transparent. Figure 6(a) shows the distribution of DSCR in period 13 (the first half of year 7). Local normal distribution (approximatively) mean = 1.326, volatility = 15%. Default probability: 0.9%. Figure 6(b) shows the distribution of DSCR in period 14 (the second half year 7). Local normal distribution: mean = 1.326, volatility = 15% (annual). Default probability: 0.7%. 136
 By calculating the marginal defaulting probability based on DSCR simulation for each period, we obtain the points for marginal defaulting term structure curve.")

16 (a) Figure 4. (a) DSCR distribution-mean; (b) DSCR distribution-vol. (b) By calculating the marginal defaulting probability based on DSCR simulation for each period, we obtain the points for marginal defaulting term structure curve. DSCR calibration parameter indicated above is used for DSCR simulation. The marginal default probability curve is consistent with the empirical default probability statistics given in Moody s documentation (please refer to the paper for more details, Default and Recovery Rates for Project Finance Bank Loans, , Moody s, 2012). Marginal Default Probability and Cumulative Default Probability. Specifically, marginal default probability is calculated as below: taking the DSCR distribution of each period, computing the percentage of the DSCR events which are lower than 1.1 (technical default trigger). The new default is based on all the paths which have survived from the previous periods. According to DSCR simulation, sort all the surviving DSCR and count the new default among these surviving paths based on the DSCR technical default trigger. For illustration, the calculated marginal default probability term structure and cumulative default probability are shown in Figure 7(a) and Figure 7(b). According to the calculated marginal default probability and cumulative default probability, three phases can be illustrated. Starting from the period just after the construction is completed, the year 6 and the default probability is more than 3% and 137
. Here, the default is triggered when the DSCR level is lower than the 1.")
; after that it is at a lower level and almost reaching zero, around 0.")

17 (a) (b) Figure 5. (a): DSCR distribution in the first half of year 6; (b): DSCR distribution in second half of year 6. slowly decline to around 1.5% until the year 10 within five years (five years after the construction is completed). Here, the default is triggered when the DSCR level is lower than the 1.1 technical default threshold. Then the new default probability (marginal default probability) further declines from 1.5% and reaches a lower level around 1% in the year 15 (10 years after the construction period); after that it is at a lower level and almost reaching zero, around 0.6% until 20 years and 0.2% after 20 years. The results are consistent with the external rating agency s empirical default study data. In Moody s industry study, for project financing default and recovery, the default probability is around 2% - 3% in the first 5-year after the construction and then decline to a number which is very low, less than 1%. The pattern displayed is also consistent with theoretical study and industry empirical observations. When horizon is extending, the asset volatility is larger since the analysis 138
 is assumed for asset factors.")
18 C. L. Wang, S. K. Sundararajan (a) (b) Figure 6. (a) DSCR distribution in the first half of year 7; (b) DSCR distribution in the second half of year 7. is projected to a longer horizon and the time scaling effect causes a bigger risk, when independent identity distribution (IID) is assumed for asset factors. The growing volatility of the asset are offset with an increasing speed by the deleverage of the capital structure. Marginal Default Probability (this is the chart title) Especially, in project financing, where the starting leverage is normally at a higher level, the impact of the deleveraging process would be high and more obviously observed compared with the 139
19 (a) Figure 7. (a) Marginal default probability; (b) Cumulative probability of default. (b) deleverage effect of typical corporate financing process whose starting leverage is normally moderate and not high. Please refer to the paper Structural Credit Risk Modeling: Merton and Beyond, Yu Wang, risk management, 2009 and the paper by Marco & Blaise (2004/2012). From another aspect, the mean and standard deviation profile of DSCR lognormal growth distribution and local distribution statistics may also help explain this trend of declining marginal default. Let us look at the approximated local distribution. The mean of DSCR starts from 1.3 and grows to about 1.6 in year 23 (within 18 years after the construction), with an average growth rate of 0.6% (staring from 0.2% to 1.5%). The volatility of estimated local normal distribution is growing from 12% in year 6 (the first year after construction) to 40% in year 23 (the 18th year after the construction). The skewness is also shown in Figure 5 and Figure 6. E.g., it is for DSCR in period 12 (the second half of the year 6). It is then increased from 0.3 in year 6 to around 1 in year 140
20 20. The general declining of DSCR is reflecting the effect of the deleverage and the deleveraging may offset more the impact from higher volatility in longer horizon Debt Cash Flow Pay-Off Function and Cash Flow Simulation Based on the simulated DSCR and CFADS along different path, the cash flow available to debt can be determined. As an illustration, for example, as Figure 8(a) shows, in the first half of year 8 (period 15), under 5.3% of the paths, which is the area on the left side, the simulated debt service (cash flow payment) is 0. These paths reflect the defaults in the previous periods. In one period, if the project defaults under a path, the (a) (b) Figure 8. (a) Debt payoff distribution in the first half of year 8; (b) Debt payoff distribution in the second half of year
21 debt payoff function gets an amount which is the recovered rate multiplied by the total outstanding cash flows in that period. E.g., in the period of 15, the total amount of the outstanding cash flows as of the first half of the year 8 is $97,638,222, 355 and no cash flows occur in the following periods (the period 16 and all the later periods in the project cycle) along these paths which default. In Figure 8(a), the 0.8% of path which is the area on the right reflects the new default in the current period, the period 15 (the first half of year 8). Under these new default paths, the debt flows as of the first half of the year 8 is $97,638,333. Under the rest of the paths (around 96%, the middle part in the figure), the debt service cash flows are the regular scheduled principal and interest payment for the current period, the period 15, which is $3,126,667. For a later period, the accumulative effect of the defaults which occurred in the previous periods can be observed more obviously. Figure 8(b) shows the debt payoff cash flows distribution for period 42 (the second half of the year 21). In this period, the scheduled debt payment is $3,153,888, the total amount of the outstanding cash flows of the futures period as of the date in period 42 is $12,518,333. In this figure, 15.9% of the paths represent the accumulative defaults which occurred immediately after the construction until the period 42. Under these 15.9% of the default paths the cash flows for debt service are zero as of period 42 (year 21). As stated before, in each period, if there is a default, the cash flows for the future periods under these paths are stopped and set to zero, the recovered cash flows (assumed to be 40% of the total outstand cash flows) are put in the current period when the new default occurs in the current period Credit Risk Pricing Using Risk Neutral Approach/Calculating Expected Loss and Deriving Credit Spread Term Structure Credit risk asset valuation and hump-shaped credit spread term structure for project financing bonds/debts. As described in EDHEC framework, after we have DSCR simulation and simulated default events, we can simulate debt service cash flows for all the paths. If there is a default, generate the cash flow as the recovered rate multiplied by the outstanding cash flows; then discount the cash flows in each period for each path using the simulated interest rate model rate for a risk free reference proxy (LIBOR swap rate is used for this study to illustrate the mechanism) and get the present value of the simulated debt service cash flows. In this asset pricing model implementation, Hull-White modeling is used for interest rate simulation. The expected loss is calculated as the difference between the average present value of the total present value of the simulated debt pay off cash flows with the total present value of the debt service cash flows. Based on the simulated debt cash flows as described in above, we can evaluate debt, calculate the expected loss and credit spread. E.g., for the spread as of year 10, the discounted PV as of the year 10 of the recovered cash flows for the default paths and the discounted value of the cash flows for the live paths will be summed up. The expected loss as of year 10 can be calculated as the difference between the PV of the simulated cash flows and the PV of the debt scheduled service. The other points on the credit spread term structure curve are estimated using the similar way. The hump-shaped 142

22 credit term structured curve generated is displayed in Figure 9 for illustration purpose. According to the paper by Ehler from BIS, the empirical credit spread is about 200 bps during the 5 year and the expected loss derived spread from the model is around bps around year 5 when the construction is done. Credit term structure curve results will be further discussed in section IV. Figure 10 shows the empirical credit spread of project financing debt in the study conducted by research paper from BIS. Please see more details from the paper by Marco & Blaise (2004/2012), The term structure of credit spreads in project finance, and Understanding the challenging of infrastructure financing (BIS, 2014). Figure 11 gives some analysis conducted by Figure 9. Modeled credit spread term structure evolution. Source: own model. Figure 10. Empirical project financing credit curve. Source: research paper (Marco & Blaise, 2004/2012, The term structure of credit spreads in project finance ; BIS, 2014). 143

23 Figure 11. Project financing bonds information (Barlcays Capital Summary). Source: Barclays/European securitization mid-year outlook, 17 June , PROJECT FINANCE. Barclay s capital about the market credit spread for project financing based debt for information purpose. These projects have a spread between 130 bps to 250 bps depending on the different rating and project structures. We use an example to further illustrate the deriving of a credit spread point. On the credit term structure curve, the forward credit spread is calculated by discounting the simulated debt cash flows using the simulated interest rate as of future date using Hull White interest rate model. E.g., for the credit spread on year 6 (the first year after the construction), the risk neutral cash flow has about 6% of 1000 paths under which the project default (risk neutral default probability), the expected loss is about 200 bps as a percentage of the scheduled debt service value as of year 6 give some analysis on the analysis conducted by Barclay s capital about the market credit spread for project financing based debt for information purpose. 4. Modeling Result Discussion DSCR simulation: As discussed before, to establish a robust industry asset and defaulting model for project finance debt, the asset volatility and financial structure volatility should be calibrated taking the industry empirical data level into consideration so that the marginal defaulting probability can be mapped with the external agency s empirical default probability for a specific industry sector and credit rating. In this hypothetical case for a toll road, the project marginal default probability of project is calibrated to Moody s empirical default probability for a universe of project financing loans. Here, the DSCR is assumed to follow the similar distribution with the project financing underlying assets. In Merton s model, lognormal assumption is assumed for company asset with a constant volatility of growth. Under some recent modeling approach, time varying volatility for the asset life cycle or stochastic volatility model have been analyzed (e.g., please refer to Heston Model for stochastic equity modeling). In our calibration model, the project financing asset is modeled through a lognormal dis- 144
METROPOLITAN COUNCIL S FORECASTS METHODOLOGY
 METROPOLITAN COUNCIL S FORECASTS METHODOLOGY FEBRUARY 28, 2014 Metropolitan Council s Forecasts Methodology Long-range forecasts at Metropolitan Council are updated at least once per decade. Population,
[03.01] User Cost Method. International Comparison Program. Global Office. 2 nd Regional Coordinators Meeting. April 14-16, 2010.
![[03.01] User Cost Method. International Comparison Program. Global Office. 2 nd Regional Coordinators Meeting. April 14-16, 2010.](/thumbs/89/100772946.jpg "[03.01] User Cost Method. International Comparison Program. Global Office. 2 nd Regional Coordinators Meeting. April 14-16, 2010.") Public Disclosure Authorized Public Disclosure Authorized Public Disclosure Authorized Public Disclosure Authorized International Comparison Program [03.01] User Cost Method Global Office 2 nd Regional
Public Disclosure Authorized Public Disclosure Authorized Public Disclosure Authorized Public Disclosure Authorized International Comparison Program [03.01] User Cost Method Global Office 2 nd Regional
COMPARISON OF THE LONG-TERM COST OF SHELTER ALLOWANCES AND NON-PROFIT HOUSING
 COMPARISON OF THE LONG-TERM COST OF SHELTER ALLOWANCES AND NON-PROFIT HOUSING Prepared for The Fair Rental Policy Organization of Ontario By Clayton Research Associates Limited October, 1993 EXECUTIVE
BUSI 331: Real Estate Investment Analysis and Advanced Income Appraisal
 BUSI 331: Real Estate Investment Analysis and Advanced Income Appraisal PURPOSE AND SCOPE The Real Estate Investment Analysis and Advanced Income Appraisal course BUSI 331 is intended to build upon the
Course Number Course Title Course Description
 Johns Hopkins Carey Business School Edward St. John Real Estate Program Master of Science in Real Estate and Course Descriptions AY 2015-2016 Course Number Course Title Course Description BU.120.601 (Carey
Housing Costs and Policies
 Housing Costs and Policies Presentation to Economic Society of Australia NSW Branch 19 May 2016 Peter Abelson Applied Economics Context and Acknowledgements Applied Economics P/L was commissioned by NSW
Sharia Compliant Treasury
 IIFM Industry Seminar on Islamic Capital & Money Market th May 2014, Tower Level,Bank Indonesia, Indonesia Ismail E Dadabhoy Advisor IIFM Sharia Compliant Treasury Liquidity Management Tools Murabaha Wakala
The Impact of the New Revenue Standard on Real Estate Sales
 The Impact of the New Revenue Standard on Real Estate Sales Wing W. Poon Montclair State University In May 2014, the FASB and the IASB jointly issued significantly revised standard on revenue recognition.
Value Fluctuations in a Real Estate Investment Financed with Debt
 Working Draft of New Case Study 4A Value Fluctuations in a Real Estate Investment Financed with Debt (which will be added to AICPA Accounting and Valuation Guide Valuation of Portfolio Company Investments
Definitions. CPI is a lease in which base rent is adjusted based on changes in a consumer price index.
 Annualized Rental Income is rental revenue under our leases on Operating Properties on a straight-line basis, which includes the effect of rent escalations and any tenant concessions, such as free rent,
Project Economics: The Value of Leasing. Russell Banham, Savills
 ICSC European Retail Property School Project Economics: The Value of Leasing Russell Banham, Savills (Investment, Development & Asset Management) Introduction Who I am Russell Banham Over 30 years of experience
UNITED STATES SECURITIES AND EXCHANGE COMMISSION Washington, D.C FORM 10-Q
 UNITED STATES SECURITIES AND EXCHANGE COMMISSION Washington, D.C. 20549 FORM 10-Q ý QUARTERLY REPORT PURSUANT TO SECTION 13 OR 15(d) OF THE SECURITIES EXCHANGE ACT OF 1934 For the Quarterly Period Ended
METHODOLOGY GUIDE VALUING CASINOS IN ONTARIO. Valuation Date: January 1, 2016
 METHODOLOGY GUIDE VALUING CASINOS IN ONTARIO Valuation Date: January 1, 2016 AUGUST 2016 August 22, 2016 The Municipal Property Assessment Corporation (MPAC) is responsible for accurately assessing and
Ground rents: an opportunity for institutional investors to diversify exposure
 Ground rents: an opportunity for institutional investors to diversify exposure Market, investment and regulatory considerations for this illiquid asset class Introduction In the current low-yield environment,
City Futures Research Centre
 Built Environment City Futures Research Centre Estimating need and costs of social and affordable housing delivery Dr Laurence Troy, Dr Ryan van den Nouwelant & Prof Bill Randolph March 2019 Estimating
Exposure Draft 64 January 2018 Comments due: June 30, Proposed International Public Sector Accounting Standard. Leases
 Exposure Draft 64 January 2018 Comments due: June 30, 2018 Proposed International Public Sector Accounting Standard Leases This document was developed and approved by the International Public Sector Accounting
Cap Rate Trends, Methodology and Analysis. Dane R. Anderson MAI, CCIM Appraisal & Litigation Services Director
 Cap Rate Trends, Methodology and Analysis Dane R. Anderson MAI, CCIM Appraisal & Litigation Services Director 1 Quickly The Income Approach Basis of the Approach Present worth of future benefits Two Methods:
METROPOLITAN COUNCIL S FORECASTS METHODOLOGY JUNE 14, 2017
 METROPOLITAN COUNCIL S FORECASTS METHODOLOGY JUNE 14, 2017 Metropolitan Council s Forecasts Methodology Long-range forecasts at Metropolitan Council are updated at least once per decade. Population, households
IAG Conference Accounting Update Emerging issues in the public sector 20 November 2014 Michael Crowe Yannick Maurice
 www.pwc.com.au IAG Conference Accounting Update Emerging issues in the public sector 20 November 2014 Michael Crowe Yannick Maurice Agenda Introduction Key topics o Fair value o PPP Projects Refinancing
Broker. Investment Real Estate. Chapter 15. Copyright Gold Coast Schools 1
 Broker Chapter 15 Investment Real Estate Copyright Gold Coast Schools 1 Learning Objectives Matching an investor with the right property Evaluating the sites and improvements of income properties Determining
Macro-prudential Policy in an Agent-Based Model of the UK Housing Market
 Macro-prudential Policy in an Agent-Based Model of the UK Housing Market Rafa Baptista, J Doyne Farmer, Marc Hinterschweiger, Katie Low, Daniel Tang, Arzu Uluc Heterogeneous Agents and Agent-Based Modeling:
All Ratings Affirmed In U.K. RMBS Transaction First Flexible No. 6 Following Review
 All Ratings Affirmed In U.K. RMBS Transaction First Flexible No. 6 Following Review Surveillance Credit Analyst: Simonetta Colombara, Milan (39) 02-72111-264; simonetta.colombara@standardandpoors.com OVERVIEW
AVM Validation. Evaluating AVM performance
 AVM Validation Evaluating AVM performance The responsible use of Automated Valuation Models in any application begins with a thorough understanding of the models performance in absolute and relative terms.
$450,000 $63,425 $39, % PURCHASE PRICE NET OPERATING INCOME ANNUAL CASH FLOW CAP RATE
 Executive Summary Key Property Metrics $450,000 $63,425 $39,143 14.1% PURCHASE PRICE NET OPERATING INCOME ANNUAL CASH FLOW CAP RATE $70,000 $60,000 $50,000 $40,000 $30,000 Annual Cash Flow Repairs, 8%
Rental income, SEK million 1,071 1,014 4,122 4,109 Growth in rental income comparable properties, percent
 Akelius Residential Property AB (publ) year-end report January to December summary Oct Dec Oct Dec Jan Dec Jan Dec Rental income, SEK million 1,071 1,014 4,122 4,109 Growth in rental income comparable
ISSUES OF EFFICIENCY IN PUBLIC REAL ESTATE RESOURCES MANAGEMENT
 Alina Zrobek-Rozanska (MSC) Prof. Ryszard Zrobek University of Warmia and Mazury in Olsztyn, Poland rzrobek@uwm.edu.pl alina.zrobek@uwm.edu.pl ISSUES OF EFFICIENCY IN PUBLIC REAL ESTATE RESOURCES MANAGEMENT
Rental income, SEK million 1,016 1,040 3,051 3,095 4,109 Growth in rental income comparable properties, percent
 Akelius Residential Property AB (publ) interim report January to September summary Jul Sep Jul Sep Jan Sep Jan Sep Jan Dec Rental income, SEK million 1,016 1,040 3,051 3,095 4,109 Growth in rental income
Analysing lessee financial statements and Non-GAAP performance measures
 February 2019 IFRS Foundation The Essentials Issue No. 5 Analysing lessee financial statements and Non-GAAP performance measures Introduction Investors and company managers generally view free cash flow
How to Read a Real Estate Appraisal Report
 How to Read a Real Estate Appraisal Report Much of the private, corporate and public wealth of the world consists of real estate. The magnitude of this fundamental resource creates a need for informed
The cost of increasing social and affordable housing supply in New South Wales
 The cost of increasing social and affordable housing supply in New South Wales Prepared for Shelter NSW Date December 2014 Prepared by Emilio Ferrer 0412 2512 701 eferrer@sphere.com.au 1 Contents 1 Background
Goods and Services Tax and Mortgage Costs of Australian Credit Unions
 Goods and Services Tax and Mortgage Costs of Australian Credit Unions Author Liu, Benjamin, Huang, Allen Published 2012 Journal Title The Empirical Economics Letters Copyright Statement 2012 Rajshahi University.
An Assessment of Current House Price Developments in Germany 1
 An Assessment of Current House Price Developments in Germany 1 Florian Kajuth 2 Thomas A. Knetsch² Nicolas Pinkwart² Deutsche Bundesbank 1 Introduction House prices in Germany did not experience a noticeable
Memorandum. Chicago Infrastructure Trust. From: Phoenix Capital Partners, LLP. Date: December 26, Assessment of Proposed Transaction
 Memorandum To: Chicago Infrastructure Trust From: Phoenix Capital Partners, LLP Date: December 26, 2013 Re: Assessment of Proposed Transaction Summary of the Project The Chicago Infrastructure Trust (
Valbridge Valuation Advisory
 Valbridge Valuation Advisory Re: Attn: Multi-Family Property Taxes Lenders and Purchasers Cash is king, and property taxes can kill the cash flow of a multi-family property. What does that mean to you?
17 CFR Ch. II ( Edition)
") 229.1110 trustee s removal, replacement or resignation, as well as how the expenses associated with changing from one trustee to another trustee will be paid. Instruction to Item 1109. If multiple trustees
229.1110 trustee s removal, replacement or resignation, as well as how the expenses associated with changing from one trustee to another trustee will be paid. Instruction to Item 1109. If multiple trustees
FSA Faculty Consortium Technical Accounting Update. Bob Uhl, partner, Deloitte & Touche LLP
 FSA Faculty Consortium Technical Accounting Update Bob Uhl, partner, Deloitte & Touche LLP Deloitte University May 30, 2014 Acronyms Acronym ASC ASU ED FASB IASB IFRS U.S. GAAP Full Form Accounting Standards
Economic Impact of Commercial Multi-Unit Residential Property Transactions in Toronto, Calgary and Vancouver,
 Economic Impact of Commercial Multi-Unit Residential Property Transactions in Toronto, Calgary and Vancouver, 2006-2008 SEPTEMBER 2009 Economic Impact of Commercial Multi-Unit Residential Property Transactions
Volume 35, Issue 1. Hedonic prices, capitalization rate and real estate appraisal
 Volume 35, Issue 1 Hedonic prices, capitalization rate and real estate appraisal Gaetano Lisi epartment of Economics and Law, University of assino and Southern Lazio Abstract Studies on real estate economics
Corporate Presentation
 October 2018 Corporate Presentation (NYSE: SAFE) Forward-Looking Statements and Other Matters This release may contain forward-looking statements. All statements other than statements of historical fact
The Housing Price Bubble, Monetary Policy, and the Foreclosure Crisis in the U.S.
 The Housing Price Bubble, Monetary Policy, and the Foreclosure Crisis in the U.S. John F. McDonald a,* and Houston H. Stokes b a Heller College of Business, Roosevelt University, Chicago, Illinois, 60605,
Commercial Real Estate Debt Finance This course is presented in London on: 26 February 2018, 29 November 2018
 Commercial Real Estate Debt Finance This course is presented in London on: 26 February 2018, 29 November 2018 The Banking and Corporate Finance Training Specialist Course Objectives Participants will:
Cube Land integration between land use and transportation
 Cube Land integration between land use and transportation T. Vorraa Director of International Operations, Citilabs Ltd., London, United Kingdom Abstract Cube Land is a member of the Cube transportation
August 2012 Design by Anderson Norton Design
 August 2012 Design by Anderson Norton Design 020 7336 6992 Property Data Report 2012 Introduction 1 Commercial property by comparison UK commercial property s value in 2011 reached 717 billion, helped
FASB/IASB Update Part II
 American Accounting Association FASB/IASB Update Part II Tom Linsmeier FASB Member August 3, 2014 The views expressed in this presentation are those of the presenters. Official positions of the FASB/IASB
A Real-Option Based Dynamic Model to Simulate Real Estate Developer Behavior
 223-Paper A Real-Option Based Dynamic Model to Simulate Real Estate Developer Behavior Mi Diao, Xiaosu Ma and Joseph Ferreira, Jr. Abstract Real estate developers are facing a dynamic and volatile market
An Introduction to RPX INTRODUCTION
 An Introduction to RPX INTRODUCTION Radar Logic is a real estate information company based in New York. We convert public residential closing data into information about the state and prospects for the
Project Finance Ratios Tutorial February 2017
 Project Finance Ratios Tutorial February 2017 1.0 General Pease note the following guidance and instruction is to be used as an accompaniment to the Project Finance Ratios Excel file. Please feel free
acuitas, inc. s survey of fair value audit deficiencies August 31, 2014 pcaob inspections methodology description of a deficiency
 August 31, 2014 home executive summary audit deficiencies improve pcaob inspections methodology description of a deficiency audit deficiency trends fvm deficiencies description of fair value measurement
86 years in the making Caspar G Haas 1922 Sales Prices as a Basis for Estimating Farmland Value
 2 Our Journey Begins 86 years in the making Caspar G Haas 1922 Sales Prices as a Basis for Estimating Farmland Value Starting at the beginning. Mass Appraisal and Single Property Appraisal Appraisal
HowBad Is. Mark Zoellertakes a common, Commercial Real Estate
 Commercial Real Estate HowBad Is Mark Zoellertakes a common, often overlooked, problem and offers a path toward a workable solution. In this first of two articles, Zoeller feels that risk analysts are
7224 Nall Ave Prairie Village, KS 66208
 Real Results - Income Package 10/20/2014 TABLE OF CONTENTS SUMMARY RISK Summary 3 RISC Index 4 Location 4 Population and Density 5 RISC Influences 5 House Value 6 Housing Profile 7 Crime 8 Public Schools
The survey also examines the underlying causes of FVM and impairment audit
 Acuitas, Inc. s Survey of Fair Value Audit April 20122 Executive Summary Public Company Accounting Oversight Board (PCAOB) inspections have noted a dramatic increase in the number of fair value measurement
Housing as an Investment Greater Toronto Area
 Housing as an Investment Greater Toronto Area Completed by: Will Dunning Inc. For: Trinity Diversified North America Limited February 2009 Housing as an Investment Greater Toronto Area Overview We are
Retail Acquisition Example
 Property Information Retail Acquisition Example Project Assumptions Acquisition Assumptions Property Name Retail Acquisition Example Project Type Acquisition Location Austin, TX Acquisition Cost $1,800,000
IFRS 15. Revenue from Contracts with Customers. Presented by CPA Dr. Peter Njuguna
 IFRS 15 Revenue from Contracts with Customers Presented by CPA Dr. Peter Njuguna Introduction Revenue is income from ordinary activities. A contract has rights and obligations between two or more parties.
Risk Management Insights
 Risk Management Insights Appraisal Review Part II: Income Capitalization Approach George Mann, Managing Director and Chief Appraiser, Collateral Evaluation Services, Inc.and Nikki Griffith, MAI, CCIM,
Course Descriptions Real Estate and the Built Environment
 CMGT REAL XRCM Construction Management Courses Real Estate Courses Executive Master Online Courses CMGT 4110 PreConstruction Integration & Planning CMGT 4120 Construction Planning & Scheduling This course
Is Your Operating Lease An Asset or Liability? It s Now Both
 MFM Annual Conference Is Your Operating Lease An Asset or Liability? It s Now Both 23 May 2016-1:30 pm 2:20 pm Disclaimer These slides are for educational purposes only and are not intended, and should
Center for Plain English Accounting AICPA s National A&A Resource Center available exclusively to PCPS members
 REPORT February 22, 2017 Center for Plain English Accounting AICPA s National A&A Resource Center available exclusively to PCPS members ASU 2017-04: Goodwill Simplifications Implementation Considerations
Strategic Housing Market Assessment South Essex. Executive Summary. May 2016
 Strategic Housing Market Assessment South Essex Executive Summary May 2016 Executive Summary 1. Turley in partnership with specialist demographic consultancy Edge Analytics were commissioned by the Thames
IFRS Update for Financial Services
 IFRS Update for Financial Services KPMG AG, Zurich 19 April 2018 Agenda IFRS 16 Leases Challenges of the new standard IFRS 9 Financial instruments Pre-transition and interim disclosures News from the IASB
NA Calculations Manual
 NA Calculations Manual ARGUS Developer 8.0 November 2017 ARGUS Software An Altus Group Company 0 2017 ARGUS Software, Inc. NA Calculations Manual for ARGUS Developer 8.0 November 2017 Published by: ARGUS
CHAPTER 18 Lease Financing and Business Valuation
 Copyright 2008 by the Foundation of the American College of Healthcare Executives 6/13/07 Version 18-1 CHAPTER 18 Lease Financing and Business Valuation Lease financing Leasing basics Analysis by the lessee
Table of Contents PAGE MIADOCS
 Table of Contents PAGE CONSOLIDATED FINANCIAL STATEMENTS Independent Auditor's Report 2 Pro-Forma Consolidated Balance Sheets as of December 31, 2017 and 2016 3 Pro-Forma Consolidated Statements of Operations
Messung der Preise Schwerin, 16 June 2015 Page 1
 New weighting schemes in the house price indices of the Deutsche Bundesbank How should we measure residential property prices to inform policy makers? Elena Triebskorn*, Section Business Cycle, Price and
THE CASE FOR EUROPEAN LONG LEASE REAL ESTATE: CONTRIBUTING TO MORE CERTAIN INVESTMENT OUTCOMES
 This document is for professional/qualified investors only. It is not to be distributed to or relied on by retail clients. THE CASE FOR EUROPEAN LONG LEASE REAL ESTATE: CONTRIBUTING TO MORE CERTAIN INVESTMENT
LeaseCalcs: The Great Wall
 LeaseCalcs: The Great Wall Marc A. Maiona June 22, 2016 The Great Wall: Companies reporting under IFRS are about to hit the wall due to new lease accounting standards. Every company that reports under
Cost Segregation Instructor Teaching Schedule (3-Hour)
") Time Topic Pages Student Objectives 8:30-8:35 Course introduction Page 2 What is cost segregation? Objective of cost segregation: to increase cash flow Benefit of cost segregation Learning objectives Page
Time Topic Pages Student Objectives 8:30-8:35 Course introduction Page 2 What is cost segregation? Objective of cost segregation: to increase cash flow Benefit of cost segregation Learning objectives Page
Determinants of residential property valuation
 Determinants of residential property valuation Author: Ioana Cocos Coordinator: Prof. Univ. Dr. Ana-Maria Ciobanu Abstract: The aim of this thesis is to understand and know in depth the factors that cause
2018 Accounting & Auditing Update P R E S E N T E D B Y : D A N I E L L E Z I M M E R M A N & A N D R E A S A R T I N
 2018 Accounting & Auditing Update P R E S E N T E D B Y : D A N I E L L E Z I M M E R M A N & A N D R E A S A R T I N AGENDA Leases FASB & GASB Revenue Recognition FASB 2 FASB ASU 2016-02, Leases (Topic
Is there a conspicuous consumption effect in Bucharest housing market?
 Is there a conspicuous consumption effect in Bucharest housing market? Costin CIORA * Abstract: Real estate market could have significant difference between the behavior of buyers and sellers. The recent
Can the coinsurance effect explain the diversification discount?
 Can the coinsurance effect explain the diversification discount? ABSTRACT Rong Guo Columbus State University Mansi and Reeb (2002) document that the coinsurance effect can fully explain the diversification
Case Study 2: Risk Allocation and Mitigation in a Road Toll Project. Thursday, 10:45 to 12:00
 Case Study 2: Risk Allocation and Mitigation in a Road Toll Project Thursday, 10:45 to 12:00 Session agenda 1. Road concessions 2. The Tribasa Toll Road 3. Risks and mitigation 4. Performance and failure
Financial Modeling Workshop Using Excel
 Financial Modeling Workshop Using Excel Page 1 of 11 Why Attend Financial modeling is crucial for taking investment decisions that can have a huge financial impact on companies. By attending this course,
AMERICAN SOCIETY OF APPRAISERS. Procedural Guidelines. PG-2 Valuation of Partial Ownership Interests
 AMERICAN SOCIETY OF APPRAISERS Procedural Guidelines PG-2 Valuation of Partial Ownership Interests I. Preamble A. Business valuation professionals are frequently engaged as independent financial appraisers
Efficiency Analysis of Taking out Real Estate Loans for Profit-Making Organizations
 Efficiency Analysis of Taking out Real Estate Loans for Profit-Making Organizations Doi:10.5901/mjss.2014.v5n24p70 Abstract Kulikova L.I. Kazan Federal University, Institute of Management, Economics and
General Growth Properties, Inc.
 General Growth Properties, Inc. Supplemental Financial Information For the Three and Nine Months Ended September 30, 2009 This presentation contains forward-looking statements. Actual results may differ
Fiscal Cadastral Reform and the Implementation of CAMA in Cape Town: financing transformation
 Fiscal Cadastral Reform and the Implementation of CAMA in Cape Town: financing transformation Jennifer WHITTAL, South Africa Mike BARRY, Canada Policies and Innovations Expert Group Meeting on Secure Land
IFRS Update Guy Thomas, CPA, CA
 IFRS Update Guy Thomas, CPA, CA D&Co IFRS update Agenda 3 new standards under IFRS IFRS 9 Financial Instruments IFRS 15 Revenue from Contracts with Customers IFRS 16 Leases Agenda Some narrow scope amendments
National Rental Affordability Scheme. Economic and Taxation Impact Study
 National Rental Affordability Scheme Economic and Taxation Impact Study December 2013 This study was commissioned by NRAS Providers Ltd, a not-for-profit organisation representing NRAS Approved Participants
Proposed Accounting Standards Update (Revised), Topic 842: Leases; issued May 16, 2013.
, Topic 842: Leases; issued May 16, 2013.") Financial Accounting Standards Board Technical Director - File Reference No. 2013-270 Financial Accounting Standards Board 401 Merritt 7 - PO Box 5116 Norwalk, CT 06856-5116 August 23, 2013 Re: Proposed
Financial Accounting Standards Board Technical Director - File Reference No. 2013-270 Financial Accounting Standards Board 401 Merritt 7 - PO Box 5116 Norwalk, CT 06856-5116 August 23, 2013 Re: Proposed
Housing Need in South Worcestershire. Malvern Hills District Council, Wychavon District Council and Worcester City Council. Final Report.
 Housing Need in South Worcestershire Malvern Hills District Council, Wychavon District Council and Worcester City Council Final Report Main Contact: Michael Bullock Email: michael.bullock@arc4.co.uk Telephone:
Edison Electric Institute and American Gas Association New Lease Standard
 Edison Electric Institute and American Gas Association New Lease Standard May 16, 2016 Disclaimer The information contained herein is of a general nature and is not intended to address the circumstances
In December 2003 the Board issued a revised IAS 17 as part of its initial agenda of technical projects.
 IFRS 16 Leases In April 2001 the International Accounting Standards Board (the Board) adopted IAS 17 Leases, which had originally been issued by the International Accounting Standards Committee (IASC)
Lease-Versus-Buy. By Steven R. Price, CCIM
 Lease-Versus-Buy Cost Analysis By Steven R. Price, CCIM Steven R. Price, CCIM, Benson Price Commercial, Colorado Springs, Colorado, has a national tenant representation and consulting practice. He was
In December 2003 the IASB issued a revised IAS 17 as part of its initial agenda of technical projects.
 IFRS Standard 16 Leases In April 2001 the International Accounting Standards Board (IASB) adopted IAS 17 Leases, which had originally been issued by the International Accounting Standards Committee (IASC)
PS Business Parks, Inc. Reports Results for the Quarter Ended September 30, 2018
 News Release PS Business Parks, Inc. 701 Western Avenue Glendale, CA 91201-2349 psbusinessparks.com For Release: Immediately Date: October 23, 2018 Contact: Jeff Hedges (818) 244-8080, Ext. 1649 PS Business
LGFP CONFERENCE Appreciating Depreciation. QAO Perspective. Patrick Flemming Brendan Macrae. 25 November 2014
 LGFP CONFERENCE Appreciating Depreciation QAO Perspective Patrick Flemming Brendan Macrae 25 November 2014 Outline What are financial reporting risks impacting on assets? How do we audit: Ø financial sustainability
How should we measure residential property prices to inform policy makers?
 How should we measure residential property prices to inform policy makers? Dr Jens Mehrhoff*, Head of Section Business Cycle, Price and Property Market Statistics * Jens This Mehrhoff, presentation Deutsche
Chapter 1 Economics of Net Leases and Sale-Leasebacks
 Chapter 1 Economics of Net Leases and Sale-Leasebacks 1:1 What Is a Net Lease? 1:2 Types of Net Leases 1:2.1 Bond Lease 1:2.2 Absolute Net Lease 1:2.3 Triple Net Lease 1:2.4 Double Net Lease 1:2.5 The
Chapter 3 Business Valuation Report
 CHAPTER 3: BUSINESS VALUATION REPORT Chapter 3 Business Valuation Report A1. Pre-IPO Valuation Need Company Restructuring and Financing It is not unusual that companies undergo series of restructuring
«Identification of the Sustainable Building Performance Thresholds generating value»
 Value of a building : Information and life cycle «Identification of the Sustainable Building Performance Thresholds generating value» Frank Hovorka mrics UNEP-FI : investment comission co-chair SBA : chairman
THE ADVISORY. READY FOR CHANGING TIDES? How Real Estate Companies Can Prepare for a New Cap Rate Era. Eric Willett, Senior Associate
 READY FOR CHANGING TIDES? How Real Estate Companies Can Prepare for a New Cap Rate Era Eric Willett, Senior Associate 2 Ready for Changing Tides? How Real Estate Companies Can Prepare for a New Cap Rate
S O S SPEAKING OF SECURITIZATION. July 1, Vol. 7 Issue 3 INTERNATIONAL ACCOUNTING RULES PROPOSED FOR SECURITISATIONS.
 S O S SPEAKING OF SECURITIZATION Accounting, Tax, Regulatory and Other Developments Affecting Transfers and Servicing of Financial Assets July 1, 2002 - Vol. 7 Issue 3 INTERNATIONAL ACCOUNTING RULES PROPOSED
EITF ABSTRACTS. Title: Accounting for Changes That Result in a Transferor Regaining Control of Financial Assets Sold
 EITF ABSTRACTS Title: Accounting for Changes That Result in a Transferor Regaining Control of Financial Assets Sold Issue No. 02-9 Dates Discussed: September 11 12, 2002; November 21, 2002; January 23,
THE LEGAL AND FINANCIAL FRAMEWORK OF AN EFFICIENT PRIVATE RENTAL SECTOR: THE GERMAN EXPERIENCE
 THE LEGAL AND FINANCIAL FRAMEWORK OF AN EFFICIENT PRIVATE RENTAL SECTOR: THE GERMAN EXPERIENCE Presenter: Prof.Dr.rer.pol. Stefan Kofner, MCIH Budapest, MRI Silver Jubilee 3. November 2014 MRI Silver Jubilee
INVESTOR PRESENTATION MAY 2013
 INVESTOR PRESENTATION MAY 2013 Forward-Looking Statements This presentation includes forward-looking statements. These statements are subject to a number of risks, uncertainties and other factors that
Business Valuation More Art Than Science
 Business Valuation More Art Than Science One of the more difficult aspects of business planning is business valuation. It is also one of the more important aspects. While owners of closely held businesses
Subject. Date: 2016/10/25. Originator s file: CD.06.AFF. Chair and Members of Planning and Development Committee
 Date: 2016/10/25 Originator s file: To: Chair and Members of Planning and Development Committee CD.06.AFF From: Edward R. Sajecki, Commissioner of Planning and Building Meeting date: 2016/11/14 Subject
Fair value implications for the real estate sector and example disclosures for real estate entities. Applying IFRS in Real Estate
 Applying IFRS in Real Estate IFRS 13 Fair Value Measurement Fair value implications for the real estate sector and example disclosures for real estate entities January 2013 Contents Introduction... 2 Section