Portland Apartment Market. Sales History
|
|
|
- Osborne Flowers
- 6 years ago
- Views:
Transcription
 888-4010 Portland Apartment Market")

1 1234 SW 18 th Ave., Suite 102 Portland, OR (971) Portland Apartment Market Sales History Steve Morris Vice President Principal Broker OR Managing Broker WA www. OR License WA License SW 18th Ave. Suite 102, Portland OR 97205
2 P a g e Portland Apartment Sales Introduction Portland Apartment Market Comments Year by Year Comments / Forecast Portland Apartment Market Comments County Sales Metrics New Construction Overview New Construction Trends Sales by County Sales by Neighborhood Portland Central / West Portland SE/NE/North (West of 82nd Avenue) Beaverton/Hillsboro/Tigard South Portland Suburbs Vancouver Portland (East of 82 nd ) and Gresham Sales by Complex Size Complexes with 100+ Units Complexes with Less Than 100 Units Sales by Decade Built All Inventory by Decade Built Sales by Decade Built Detail Largest Sales by Gross $, $/Unit & $/SqFt Largest Sales by County Clackamas Top 10 Sales by Total $ Clark (WA) Top 10 Sales by Total $ Multnomah Top 10 Sales by Total $ Washington Top 10 Sales by Total $ Largest Sales by Gross $... 37

3 P a g e 3 Introduction We hope this report helps you understand the Portland rental market as of Spring 2018 and how you can make money. We are always happy to provide market evaluations of your properties value along with suggestions on how to increase NOI. Increasing NOI should be paramount whether you are holding or selling your units. It never hurts to know the value of what you own in the current market. As a buyer, this information should give guidelines on what to expect to pay, but every property is unique and you need to determine an accurate value using your own financial analysis. If you would like: - Further detail or breakdowns of this information or - A more readable copy of anything here or - Similar information tailored to your neighborhood or ZIP code(s) or - To be included on our monthly of individual apartment sales - FREE copy of our 80-page book Buying, Selling and Operating Apartments Using Financial Analysis Please contact me at: Steve Morris steve@imgnorthwest.com (503) IMG Northwest 1234 SW 18 th, Suite 102 Portland, OR Of course, any in depth analysis of the Portland market is available Let us know how you d like to slice the market. In addition, if you d like an objective analysis of your apartments without obligation, let us know.
4 P a g e Portland Apartment Market Comments

5 P a g e 5 The biggest variable driving operations has been income derived from apartments. It s ranged from low (2009 meant few buyers and few renters) to high (2016) demand saw a plateau in rent growth plus new regulations regarding rent control in Oregon may affect all properties as a limiter. Instead of increasing rents, look at bettering the quality of your tenant stock, remembering one bad tenant can cost one half years rent. The emerging focus for owners will be a stable tenant base. The past few years of 10%/year rent increases. To get good tenants so you may want to ask your property manager: 1) Is your advertising effective and are we stating all the positive things about our apartment compared to the competition? 2) Are your on-sites tracking applications and following up? 3) Is my asking rent in line with the competition or can I succinctly justify higher asking? 4) What s my online reputation? You need a plan to respond to any bad online comments immediately Managing expenses. Be strategic with repairs that may be cheaper now versus waiting. Issues like moisture invasion should be addressed as soon as possible. Ongoing utility usage, merit close examination whether curbing use (desired) or off-loading the cost onto tenants (bill-backs). You own a valuable income-generating asset. If inflation recurs, it should provide asset protection and income growth in worth at the rate of inflation. It is worth devoting some of your income to protecting and preserving that asset. Demand for larger complexes weakened. In 2017, the exodus of large buyers hit the total gross sales dollars which decreased by 50% from Buying quality properties in good locations still means you have to reach on pricing (see the neighborhood section). However, paying extra means your asset will hold its value better and grow at a higher rate (cf. neighborhood metrics section) than average. There are still good buying opportunities in lower-priced outlying areas. To paraphrase Warren Buffet - You make your gain when you buy. Demand for smaller complexes remains strong and the relative stability of investments in multi-unit housing.
 Impression that prices will keep increasing from brokers trying to buy listings. d) Still getting a good return especially if long-term owners.")
6 P a g e 6 Sellers not being persuaded- The factors encouraging inaction by owners: a) They are making good money after the tumult of b) Finding few replacement properties for a 1031 exchange. c) Impression that prices will keep increasing from brokers trying to buy listings. d) Still getting a good return especially if long-term owners leasing issues - Owners will need to compete for better-quality tenants Especially on high-end properties. The question is - How many tenants are there willing and able to pay $2500+/month for a 2-bed unit? Focus on what you can do to improve the attractiveness of your apartments to good tenants including energy efficiency, water-use management and strategic improvements. Make sure you know what your online reputation is and have a plan to counter any bad reviews that get posted. Topping out in the rental market. The damping factor are incomes (Portland isn t the strongest at creating well-paying jobs). Rents have gone up 50%+ since 2011, tenants may either go into roommate shares or maybe back to mom n dad or just leave town for the next coolest place. Available investment alternatives for sellers: 1) Retail properties are getting slammed, especially on higher rent. If you have the skills managing tenant base in strip malls, these can have good returns, especially if welllocated and a stable anchor tenant. 2) Office space Location is paramount when buying these. B/C properties also need amenities for tenants that entertain clients. 3) Industrial You need to analyze these by the tenant and lease and stability of the tenant s business. 4) Single-tenant net leases (STNL) You re buying the cash flow from a lease. Make sure you understand the cash-flow and the outs for a tenant in the lease you buy. Usually in custom built buildings (burger and drug stores), the tenant writes his own lease which works in their favor. Then you have the ongoing fight of being right-sized If a tenant loses business he may exit and if he grows wildly he may move to a bigger space. 5) DSTs / private REITs These qualify for a 1031, yet usually have fixed returns (like 5%), which implies you are giving the manager upside in rents. 6) Syndications / TICs Like IMG - We look for properties with value-add in growth markets. You share in the profits proportionally and potential losses.
7 P a g e Year by Year Comments / Forecast 5 yr Lending Rate Avg $/unit Avg $/SqFt Avg CapRate Deals Total Units Sold Avg Transaction Total Sales % $91,389 $ % $5,845,464 $1,017,110, % $91,274 $ % $5,613,445 $1,178,823, % $119,988 $ % $7,754,311 $1,558,616, % $126,451 $ % $8,163,488 $2,334,757, % $149,571 $ % $10,803,280 $2,970,902, % $177,816 $ % $7,883,877 $1,742,336,833 5 yr Avg 4.17% $133,020 $ % $8,043,680 $1,957,087,285 5 Yr Total $9,785,436,424 Note: Sample Interest Rates on 5 yr balloon term >$500K borrowed 2012 Smaller investors re-enter the market and the lure of low interest rates and rising rents proves irresistible. Landlords are starting to make good money and have a rent market in their favor. Finding reasonably priced replacement properties in good locations is an issue for potential 1031s. Now the battle is finding owners willing to sell at all after having some very good returns erase the abysmal years of 2009 and earlier Finding reasonably priced properties in good locations becomes an issue. The 2009 buyers sell and turn a very nice profit as available inventory dries up forcing prices up. The spread between average Cap Rates (6.59%) and average lending rates (4.25%) is > 12%. Last year before take-off in apartment pricing Huge jump in apartment pricing of 20%+. Total transaction $ surpass previous all-time high (2011). The market is heating up with institutional buyers leading the way with a 30% jump in average $/unit from 2013 for larger complexes Peak transactions (286). Total transaction $ surpass sets record easily. Buyer demand swamps inventory resulting in pricing being driven by buyers. Sellers still are seeing good income on properties, however, the threat of rent-control like rules in Portland is a threat. Meanwhile, new construction (see later) hits another high with money still cheap. Interest rates hit low of 3.95% on average An all-time high in gross sales dollars ($2.97B). A large amount of new construction inventory starting to be brought on-line. In Portland, the threat of government interference thru soft rent controls in Portland. On the horizon, permitting changes require part of new construction to be low-income units (Inclusionary Zoning).

8 P a g e Looks to be a watershed year. There was a 40% drop from 2016 in gross sales dollars. Even more new construction inventory being brought on-line. Rents are returning to their normal 3%-5% year-over-year increase with a vacancy uptick in the 2 nd half of The rental market for rent gains and price increases seems to be returning to a more normal level as opposed to the hot years of for sales price and rent growth Now what for 2018? Questions to be answered: 1) Are rents peaking? 2) Will income keep up with expenses and what can an owner do to control expenses? 3) With inflated sales prices are we hitting a buyer limit? Class A property gross $ sales have dropped 50% from 2016 to ) Will an interest rate increase reverse pricing trends? 5) It ll be more competitive for tenants which means more lead generation, advertising, watching your online reputation, monitoring your rent pricing and tenant retention. We stay current on the Portland rental market. We send out a monthly detailing individual apartment sales >$450K. If you d like to be included, let us know. Knowing your property and how it compares to neighboring properties helps make wellinformed decisions. With unsolicited offers increasing, you need to know where you stand and if an offer is worth considering. We ve helped owners with weatherization grants, finding new ways to do utility bill-backs that are not intrusive and provide financial analyses that set a value based on your rents and expenses compared to the neighborhood averages.

9 P a g e Portland Apartment Market Comments Whether you SELL or HOLD, job number one is to increase your Net Operating Income (NOI). If you can raise top-line income thru rents, fees or bill-backs - Great. However, you re always prey to the market for what income you can drive. What you have more control over are expenses. Whether this means reducing utility usage and getting/keeping better tenants you should make NOI growth an ongoing action item. Ultimately, attracting and keeping good tenants is the best investment of effort you can make. Keeping maintenance manageable is important. If you are making a maintenance decision, you should prioritize, in order: - Tenant safety issues Way too much liability and too many tenant lawyers. - Moisture invasion (the sooner you address, the cheaper it will be to fix) - Energy efficiency Helps your tenants and adds value to your property - Aesthetics - Your tenants look no better than your apartments. - Landscaping improvements Beyond tenant attraction, the payback is low - The more you spend on new landscape, the more it ll cost to maintain. IMG Northwest specializes in brokerage and TIC syndication. If you d like an assessment or opinion of value - Call now. You re under no obligation and you gain useful information. We have 30+ years of property management and brokerage experience that you can exploit. We can provide a very useful financial analysis including: - Opinion of current value and suggestions on how to increase it - Analysis of expenses compared to area averages - Sales comparables to justify pricing - Rent comparables to see if you re getting enough.

10 P a g e 10 4 County Sales Metrics


11 P a g e 11 4 County Sales Metrics


12 P a g e 12 4 County Sales Metrics


13 P a g e 13
14 P a g e 14 New Construction Overview
.")
15 P a g e 15 New Construction Trends New construction It s difficult to build a new apartment building today that can compete with existing construction. Most new construction is happening in higher rent parts of town (downtown, close-in and Beaverton-Hillsboro). With builders looking at SDCs (System Development Charges) and fees pushing $25K per UNIT, this comes out of anticipated return (at 5% debt that s almost $100/month to service soft costs). Add in Inclusionary Zoning (forcing builders to include income restricted units) and Portland is in a new construction lull. NEW CONSTRUCTION BY COUNTY Clack Clark Mult Wash 4 County Projects Units Projects Units Projects Units Projects Units Projects Units Total New Const All Const New/All Const 6.34% 14.13% 11.14% 26.12% 16.63% 35.33% 9.33% 20.29% 13.93% 27.96% The continuing attraction of Washington County (Beaverton and Hillsboro) as a rental market will be due to the availability of high-income jobs at places like Nike, Intel and their support businesses. Projections have Washington County exceeding Multnomah County in jobs and population by 2030 with development following suit. Portland Building Permits Have dropped considerably in Some of this is due to overbuilding and some is due to Inclusionary Zoning rules adopted by Portland Bureau of Development Services. Non-traditional housing New projects include micro-units, group housing like college quads, no allowance for cars and active green designs. It ll take time to see what sticks, but keeping current can give you ideas for upgrades on your apartments. However, sometimes markets can only support one outlier of a different rental arrangement.
16 P a g e Sales by County
 Multnomah Washington Average / Total Avg $/PerUnit $158,693 $176,075 $185,381 $162,902 $170,763 Relative to Average -7.1% 3.1% 8.6% -4.6% Avg $/SqFt $166.93 $164.96 $220.69 $179.")
17 P a g e Sales by County Here s a summary of all sales in the Portland METRO (Clark, Clackamas, Multnomah and Washington counties) markets for Clackamas Clark (WA) Multnomah Washington Average / Total Avg $/PerUnit $158,693 $176,075 $185,381 $162,902 $170,763 Relative to Average -7.1% 3.1% 8.6% -4.6% Avg $/SqFt $ $ $ $ $ Relative to Average -8.7% -9.8% 20.6% -2.1% Avg CapRate 6.04% 5.89% 5.12% 5.42% 5.62% Relative to Average 7.6% 4.8% -8.9% -3.6% Avg Transaction $8,335,172 $9,707,009 $5,669,991 $15,826,000 $9,884,543 Relative to Average -15.7% -1.8% -42.6% 60.1% Transactions % of Total 13.1% 6.3% 64.7% 15.8% Gross $ $241,720,000 $135,898,132 $810,808,709 $553,909,992 $1,742,336,833 % of Total 13.9% 7.8% 46.5% 31.8% Pop Growth B B B B Job Growth C+ C+ C+ B Following are comments on each county and comparison to averages from (% difference/total is relative to overall 4 county averages for 2017). Clackamas Most growth is in Tualatin and Clackamas (city) / Happy Valley. Clackamas county has some of the highest income towns (Lake Oswego, West Linn and Wilsonville) and highest asset values. Most job growth happens outside the county without too many major employers excepting retail outlets in Happy Valley (Clackamas Town Center) and Tualatin (Bridgeport). A big issue for tenant appeal is access to I-5/I-205 and/or MAX. Clark (WA) - Clark county operates without an urban boundary unlike the three Oregon counties, so there is plenty of area for development. However, there are few major employers outside of health care and retail. Washington does not have an income tax and Vancouver does have lower average utility prices. With the threat of rent control looming in Oregon, Vancouver (Clark and Cowlitz counties) is becoming more attractive to investors. We expect pricing to reflect this and will be the firmest demand.
18 P a g e 18 Multnomah Is the economic center of the area, however, the inability to attract large nongovernmental employers is beginning to show. Multnomah remains the most expensive part of the METRO area. Portland has one of the more activist govts for tenant rights and the highest soft costs in the area for builders. Portland has introduced soft rent caps and inclusionary zoning forcing builders into including LIH units Washington In 15 years it s population is projected to pass Multnomah county. A lot of fuel for growth is based on the high-tech business (Intel, Synopsys, Genentech and Salesforce.com) centered on Hillsboro and Nike in the Beaverton area. In addition, there is more land available for construction of residential and plant, so larger complexes exist as a focus for developers. Here s a VERY rough estimate of the total number of rentable units by county and complexes Clackamas Clark (WA) Multnomah Washington Total Complexes Indiviual Units % of Total Units 11.0% 13.7% 50.4% 24.9% 100%

19 P a g e Sales By County
20 P a g e Sales by Neighborhood
.")

21 P a g e Sales by Neighborhood Total Sales all 4 Portland Metro Counties (Neighborhoods are sorted by ascending 5 year average Cap Rates) Portland Central / West Central Portland and close-in West Prices are higher, but you get asset preservation since it s still a very in demand neighborhood. Most new construction is either income-qualified or high-end (>$3/sqft/month rent). Operating expenses (especially water/sewer) and property taxes (due to bonds) are among the highest in the metro area. Two other areas are siphoning off high rents Close-in East Portland and Hillsboro / Beaverton. The gross dollar sales lead is slipping to the Beaverton-Hillsboro and Washington county area due to job growth and availability of amenities. If you re thinking of buying an older building (pre- 1930), be aware of Portland s seismic retrofit plans I can send info. Portland SE/NE/North (West of 82nd Avenue) Close-in East Portland (West of 82 nd to the Willamette) - This is an in-demand neighborhood and continues to appreciate faster than average. Most new construction is infill (<30 units). Access to amenities is paramount and smaller units pre-dominate. Older construction means
 - (cont d) There are hot spots for new development along traffic corridors like SE Hawthorne, SE Division, NE Alberta, N Williams, Sellwood")
22 P a g e 22 smaller (20-unit range) complexes which reflects the relative age of the district and lack of land for newer and larger. Close-in East Portland (West of 82 nd to the Willamette) - (cont d) There are hot spots for new development along traffic corridors like SE Hawthorne, SE Division, NE Alberta, N Williams, Sellwood (SE Milwaukie) and N Mississippi are maturing into parts of town with high walk-scores. This is probably the center of creative job creation. Beaverton/Hillsboro/Tigard Beaverton/Hillsboro With a lot of rental inventory, most jobs and population growth is happening here. Job growth (especially in high-tech) should continue to push demand and new construction absorption up. A lot of growth will be dependent on Intel and Nike. Areas like Hillsboro along Cornell Road and Beaverton along SW Murray and SW Cedar Hills have amenities plus light-rail (MAX) service to downtown Portland thru the heart of both towns. There are a wide range of properties in vintage, size and grade. Most transactions have been larger (>100 units) complexes since smaller owners are holding. South Portland Suburbs Portland South Suburbs (Wilsonville / Lake Oswego / Happy Valley / Clackamas / Oregon City / Milwaukie / West Linn / Tualatin) The demographics span from the richest cities (Lake Oswego / West Linn) to the city with fastest growing percentage of LIH (Low-income housing) in Oregon - Tualatin. Retail developments in Clackamas Town Center and Bridgeport and amenities are the highest after downtown. Readily available land allows larger (100-unit average) complexes. Job growth and incomes are average for the Portland - Metro area. Property taxes and operating expenses are average.

23 P a g e 23 Vancouver Vancouver Benefits from lower operating costs (especially utilities) and less govt interference than Oregon. Rent demand seems to be steady. Most transactions are in the larger complexes. Vancouver is not limited by the Urban Growth Boundary set by METRO (Portland regional government) and there are a lot of large spaces available with good access to I-5 and I-205. New construction is not anticipated to have a large effect on existing stock. Portland (East of 82 nd ) and Gresham Portland East Suburbs (East of 82nd Avenue) These are the lowest rent rates in town along with Vancouver. Lower vacancies and higher prices close-in drive tenants out to these markets. There is ongoing demand since this neighborhood will usually have the low rent and higher inventory for tenants to choose from. There is not a lot of new construction planned in this neighborhood besides LIH projects and pricing for existing complexes is lowest in the area.
24 P a g e 24
25 P a g e Sales by Complex Size


26 P a g e Sales by Complex Size Larger complexes sell at lower Cap Rates. Yet large investors face expensive entry prices, questions about the continued growth of the Portland market and competition from new construction. For the very large investor, Portland is a small market with only about 20 existing and proposed complexes >500 units. In terms of gross sales dollars, complexes > 100 units make up almost 75% of all sales. What is interesting is that the ratio has held steady for the past five years until 2017 with a drop-off in large sales. Complexes with Greater Than or Equal (GTE) to 100 Units With larger complexes you ll pay a higher admission fee, but in return, you ll have the security of higher tenant incomes and asset preservation due to better locations. Compared to smaller complexes, you ll pay roughly a third more in $/unit and $/sqft. This is due to private REIT buyers anxious to place money that may move on if they can t find deals. Complexes with Less Than (LT) 100 Units In 2012, the smaller investor re-entered the market to 2014 saw a large bump in pricing. Smaller complexes average 0.5%-1% higher Cap Rates. The smaller investor realizes that of all commercial property, apartments consistently generate income. If you want to get top dollar out of your apartments Do your maintenance and keep good books to see where your cash is going.
27 P a g e 27
28 P a g e Sales by Decade Built
29 P a g e Sales by Decade Built Pre Avg $/PerUnit $156,909 $127,565 $101,370 $93,205 $117,591 $126,849 $157,759 $243,356 Avg $/SqFt $ $ $ $ $ $ $ $ Avg CapRate 5.52% 5.69% 6.19% 6.46% 5.75% 5.70% 5.74% 5.06% Transactions Units Gross Dollars $334,765,853 $351,421,013 $634,378,757 $878,631,337 $1,529,778,636 $3,365,833,773 $1,291,379,966 $2,334,299,332 % of Total 3.10% 3.25% 5.87% 8.13% 14.16% 31.16% 11.96% 21.61% Older apartments are in better locations. Most pre-1960 construction was close to downtown. However, construction was not on the scale of today s builders. 20-unit complexes were the norm and close-in units of almost any vintage will be in smaller complexes. These areas are favorites for young renters who value access to amenities while forsaking private cars to minimize the cost of transportation. The 2010 decade represents a big jump in inventory with about 30% of all inventory to be built in the 2010 s. However, most new construction is either in the core, close-in East side or Beaverton to Hillsboro. 90 s construction has 20% of all inventory in the 4 county area. Most 90 s construction happened in outlying suburbs like Gresham, Happy Valley / Clackamas, Tualatin and Vancouver. This spate in new construction means the market will take time to absorb inventory Today, owners offering concessions during lease-up on new properties. All Inventory by Decade Built Pre All Clackamas County Complexes Units Clark County (WA) Complexes Units Multnomah County Complexes Units Washington County Complexes Units County Total Complexes % of Total Complexes 5.8% 3.3% 8.2% 12.7% 9.3% 18.3% 10.1% 28.6% 100.0% Units % of Total Units 14.4% 7.4% 14.3% 18.7% 5.4% 9.4% 6.3% 14.4% 100.0%
. City of Portland has new rules for retrofits on URM (unreinforced masonry) buildings.")


30 P a g e Sales by Decade Built Detail Pre Almost all construction close-in (downtown) to the Willamette river. Before mid-1920 s construction was mostly unreinforced masonry (check with your insurance agent on coverage). City of Portland has new rules for retrofits on URM (unreinforced masonry) buildings. Most units in a studio configuration or SROs. 194x-195x - After World War II Portland witnessed a burst of population and income growth. In addition, housing for all these new residents included single-family residences. Location was a little farther out (West Hills to 39th avenue and North Portland.) Most construction was wood frame and siding, however units became larger including 1- and 2- bedroom complexes. Again, most of these complexes have great locations since Portland didn t go much beyond 39 th /Cesar Chavez to the east. 196x and 197x - Construction trends continued, however the growth of suburbs like Beaverton and Gresham and Vancouver captured a lot of new construction with the availability and low cost of land along with lower soft costs than Portland proper. Also contributing were services and amenities became more common in the suburbs and outer edges of town. Complex sizes began to inch up into the 100+ unit range, but this was just the start. 70s vintage units see to offer the most bang for the buck with lowest $/unit but seem to suffer the ravages of owner neglect and poorer locations.

.")
31 P a g e x and 199x - The biggest change was the rapid growth of a go large or go home mentality with 100+ unit complexes proliferating in the suburbs with Beaverton-Hillsboro showing a lot of growth thanks to pioneering employers like Intel and Nike. The early 1990s had a large burst of construction in the Gresham area that it is still recovering from. For the first time, the Urban Growth Boundary began to hamper developers of apartments. The 1990s were responsible for construction of almost 33% of all available units in the 4-county area up thru By far the largest decade of growth (barring 201x futures). 200x and 201x - Trends continued with the exception of renewed urban development, especially in areas like the Pearl district. Another trend was the rapid development and collapse of the condo market with conversion siphoning off some rental stock thru Neighborhoods with high walk-scores along with the desire for workers to have a short commute to jobs like close-in East Portland (Alberta, Division and Hawthorne avenues) and North Portland (Mississippi and Williams) showing a lot of demand by tenants, albeit in smaller complex sizes. However, new construction is overlooking lower rent neighborhoods like East Multnomah county and Clark county.
32 P a g e 32 Units Built by Decade Pre
33 P a g e Largest Sales by Gross $, $/Unit & $/SqFt
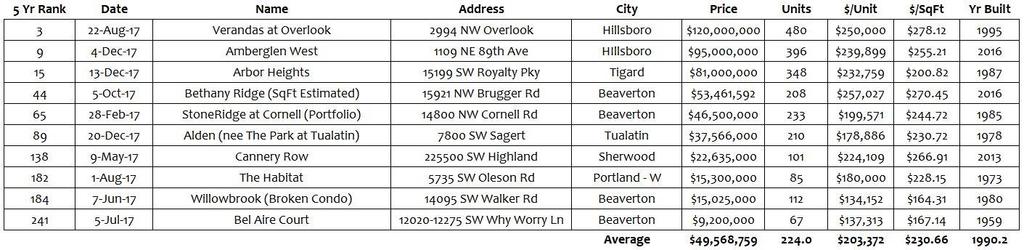
34 P a g e Largest Sales by Gross $, $/unit & $/SqFt 2017 Top 15 Sales by Total $ 5 Yr Rank Sold Name Address City Price Units $/PerUnit $/SqFt Yr Built 3 22-Aug-17 Verandas at Overlook 2994 NW Overlook Hillsboro $120,000, $250,000 $ Dec-17 Amberglen West 1109 NE 89th Ave HIllsboro $95,000, $239,899 $ Dec-17 Arbor Heights SW Royalty Pky Tigard $81,000, $232,759 $ Jul-17 Jory Trail SW Ash Meadows Blvd Wilsonville $75,000, $231,481 $ Dec-17 Yacht Harbor Club NE Yacht Harbor Portland - NE $68,000, $390,805 $ Dec-17 Savier Flats 2244 NW Savier St Portland - Central $60,000, $335,196 $ Sep-17 Latitude (nee Sequoia Village) 8411 SE Causey Cir Happy Valley $58,000, $276,190 $ Oct-17 Bethany Ridge (SqFt Estimated) NW Brugger Rd Beaverton $53,461, $257,027 $ Oct-17 Heatherwood 765 SW Mt Hood Gresham $51,000, $193,182 $ Mar-17 Modera Goose Hollow 2004 SW Jefferson St Portland - Central $47,500, $354,478 $ Feb-17 LIH - The Ellington 1610 NE 66th Ave Portland - NE $47,000, $178,707 $ Feb-17 StoneRidge at Cornell (Portfolio) NW Cornell Rd Beaverton $46,500, $199,571 $ Dec-17 Alden (nee The Park at Tualatin) 7800 SW Sagert Tualatin $37,566, $178,886 $ Feb-17 Silver Oak (Portfolio) 8701 NE 54th St Vancouver $35,150, $172,307 $ Feb-17 Sedona At Bridgecreek (Portfolio) 2220 NE Bridgecreek Vancouver $31,046, $155,231 $ Top 15 Sales by $/unit (>100 units) 5 Yr Rank Sold Name Address City Price Units $/PerUnit $/SqFt Yr Built Dec-17 Yacht Harbor Club NE Yacht Harbor Portland - NE $68,000, $390,805 $ Mar-17 Modera Goose Hollow 2004 SW Jefferson St Portland - Central $47,500, $354,478 $ Dec-17 Savier Flats 2244 NW Savier St Portland - Central $60,000, $335,196 $ Sep-17 Latitude (nee Sequoia Village) 8411 SE Causey Cir Happy Valley $58,000, $276,190 $ Dec-17 Century at North Cook 3270 N Vancouver Portland - N $28,528, $274,308 $ Oct-17 Bethany Ridge (SqFt Estimated) NW Brugger Rd Beaverton $53,461, $257,027 $ Aug-17 Verandas at Overlook 2994 NW Overlook Hillsboro $120,000, $250,000 $ Dec-17 Amberglen West 1109 NE 89th Ave HIllsboro $95,000, $239,899 $ Dec-17 Arbor Heights SW Royalty Pky Tigard $81,000, $232,759 $ Jul-17 Jory Trail SW Ash Meadows Wilsonville $75,000, $231,481 $ May-17 Cannery Row SW Highland Sherwood $22,635, $224,109 $ Mar-17 Pioneer Vista NE 15th Ave Ridgefield $22,000, $201,835 $ Feb-17 StoneRidge at Cornell (Portfolio) NW Cornell Rd Beaverton $46,500, $199,571 $ Oct-17 Heatherwood 765 SW Mt Hood Gresham $51,000, $193,182 $ Dec-17 Alden (nee The Park at Tualatin) 7800 SW Sagert Tualatin $37,566, $178,886 $ Top 15 Sales by $/SqFt (>100 units) 5 Yr Rank Sold Name Address City Price Units $/PerUnit $/SqFt Yr Built Dec-17 Savier Flats 2244 NW Savier St Portland - Central $60,000, $335,196 $ Dec-17 Century at North Cook 3270 N Vancouver Portland - N $28,528, $274,308 $ May-17 Fremont (nee Freedom Center) 1450 NW Pettygrove Portland - Central $22,750, $151,667 $ Dec-17 Yacht Harbor Club NE Yacht Harbor Portland - NE $68,000, $390,805 $ Mar-17 Modera Goose Hollow 2004 SW Jefferson St Portland - Central $47,500, $354,478 $ Aug-17 Verandas at Overlook 2994 NW Overlook Hillsboro $120,000, $250,000 $ Oct-17 Bethany Ridge (SqFt Estimated) NW Brugger Rd Beaverton $53,461, $257,027 $ May-17 Cannery Row SW Highland Sherwood $22,635, $224,109 $ Dec-17 Amberglen West 1109 NE 89th Ave HIllsboro $95,000, $239,899 $ Feb-17 StoneRidge at Cornell (Portfolio) NW Cornell Rd Beaverton $46,500, $199,571 $ Sep-17 Latitude (nee Sequoia Village) 8411 SE Causey Cir Happy Valley $58,000, $276,190 $ Dec-17 Alden (nee The Park at Tualatin) 7800 SW Sagert Tualatin $37,566, $178,886 $ Oct-17 Heatherwood 765 SW Mt Hood Gresham $51,000, $193,182 $ Dec-17 Arbor Heights SW Royalty Pky Tigard $81,000, $232,759 $ Jun-17 Stark Street Crossings (Portfolio) SE Stark Gresham $22,825, $175,577 $
35 P a g e Largest Sales by County


36 P a g e 36 Clackamas Top 10 Sales by Total $ Clark (WA) Top 10 Sales by Total $ Multnomah Top 10 Sales by Total $ Washington Top 10 Sales by Total $
37 P a g e Largest Sales by Gross $
38 P a g e Largest Sales by Gross $ Rank Date Name Address City Price Units $/Unit $/SqFt Built 1 11-Nov-16 LaSalle SW Millikan Way Beaverton $140,000, $247,350 $ Dec-16 The Yard 22 NE 2nd Portland - NE $126,680, $446,056 $ Aug-17 Verandas at Overlook 2994 NW Overlook Hillsboro $120,000, $250,000 $ Nov-16 Bridgeport SW Lower Boones Ferry Tualatin $118,100, $321,798 $ Jun-14 The Asa NW Marshall St Portland - Central $105,500, $456,710 $ Sep-15 Riverplace Square 1811 SW River Dr Portland - Central $97,200, $335,172 $ Nov-16 Seven West at the Trails SW Scholls Ferry Rd Beaverton $96,000, $226,950 $ May-13 Cyan PDX 1720 SW 4th Ave Portland - Central $95,750, $272,017 $ Dec-17 Amberglen West 1109 NE 89th Ave HIllsboro $95,000, $239,899 $ Dec-15 Village at Main Street SW Town Center Loop Wilsonville $95,000, $204,741 $ Mar-16 Waterline 2080 NW Front Ave Portland - Central $94,000, $386,831 $ Dec-16 Alara Hedges Creek SW Sweek Dr Tualatin $93,000, $227,941 $ Sep-15 Sterling Pointe SW Teal Blvd Beaverton $91,080, $144,571 $ May-16 Breckenridge (Brookdale Glen) 8150 SW Barnes Portland - W $81,500, $228,291 $ Dec-17 Arbor Heights SW Royalty Pky Tigard $81,000, $232,759 $ Aug-14 Rock Creek Landing 3009 NW Overlook Dr Hillsboro $80,000, $166,667 $ Dec-16 Tanasbourne Terrace NW Evergreen Pky Hillsboro $78,340, $210,027 $ Oct-16 One Jefferson 1 Jefferson Pky Lake Oswego $78,000, $224,138 $ Oct-12 RiverPlace Square SW River Dr Portland - Central $77,500, $267,241 $ Mar-12 LaSalle SW Millikan Way Beaverton $77,200, $136,396 $ Sep-16 Green Leaf Monterey 8640 SE Causey Ave Happy Valley $76,000, $194,872 $ Jul-17 Jory Trail SW Ash Meadows Wilsonville $75,000, $231,481 $ Dec-16 The Club at Tanasbourne 2323 NW 188th Hillsboro $72,980, $207,330 $ Oct-16 Rowlock (Portfolio) 6350 NE Cherry Dr Hillsboro $70,000, $274,510 $ May-16 Cook Street 107 N Cook Portland - N $69,000, $334,951 $ Dec-17 Yacht Harbor Club NE Yacht Harbor Portland - NE $68,000, $390,805 $ Jul-16 The Vue (nee Ione Plaza) 1717 SW Park Portland - Central $63,950, $207,630 $ Oct-16 Domaine at Villebois SW Villebois Dr Wilsonville $63,250, $230,839 $ Jun-14 One Jefferson 1 Jefferson Pky Lake Oswego $63,000, $181,034 $ Dec-13 Savier Flats 2244 NW Savier St Portland - Central $61,400, $343,017 $ Dec-17 Savier Flats 2244 NW Savier St Portland - Central $60,000, $335,196 $ Jun-15 Museum Place SW Jefferson St Portland - Central $59,500, $425,000 $ Aug-15 Terrene at the Grove 8890 SW Ash Meadows Cir Wilsonville $59,500, $206,597 $ Jan-15 Jory Trail SW Ash Meadows Wilsonville $59,000, $182,099 $ Jan-14 Thorncroft Farms 2120 NW Thorncroft Dr Hillsboro $58,000, $170,588 $ Sep-17 Latitude (nee Sequoia Village) 8411 SE Causey Cir Happy Valley $58,000, $276,190 $ Feb-16 Russellville Commons SE Pine St Portland - SubE $57,850, $204,417 $ Nov-12 Cortland Village 6910 NE Ronler Way Hillsboro $56,050, $155,694 $ Jan-16 Courtyard Fountains (SENIOR) SE 223rd Ave Gresham $55,500, $220,238 $ Oct-16 Sofi at Cedar Mill NW Timberview Ln Beaverton $55,000, $231,092 $ Average $79,545, $255,728 $
APARTMENT SALES SUMMARY
 PORTLAND, OREGON MSA MARCH 2017 APARTMENT SALES SUMMARY 2011-2016 Steve Morris Vice President Principal Broker OR Managing Broker WA steve@imgnorthwest.com 503.970.4593 www.imgnorthwest.com OR License
Average Change Sale Price 07 v. 08 Clackamas $375,800-6% Columbia $230,700-9% Multnomah $331,400-1% Washington $317,100-5% Yamhill $270,700-5%
 A Publication of RMLS, The Source for Real Estate Statistics in Your Community Residential Review: Metro, Oregon 29 Reporting Period Residential Highlights Although closed sales dragged to a new low in,
HOUSING MARKET ANALYSIS
 HOUSING MARKET ANALYSIS NGAN NGUYEN Oregon Association of Realtors Student Fellow & Certificate of Real Estate Development Graduate Student National housing market statistics reflect a decreasing prices
RESIDENTIAL MARKET ANALYSIS
 RESIDENTIAL MARKET ANALYSIS EVAN ABRAMOWITZ Joseph Bernard Investment Real Estate Oregon Association of Realtors Student Fellow Masters of Real Estate Development Graduate Student National housing market
MARKET AREA UPDATE Year: 2018 Report as of: 1Q 2Q 3Q 4Q
 Market Area (City, State): Portland Metropolitan Area MARKET AREA UPDATE Year: 2018 Report as of: 1Q 2Q 3Q 4Q Provided by (Company / Companies): BHHSNW Real Estate, Archibald Relocation, Coldwell Banker
Average Sale Price. Closed Sales
 A Publication of RMLS, The Source for Real Estate Statistics in Your Community Residential Review: Metro, Oregon 29 Reporting Period Residential Highlights metro area market activity continued to grow
Average and Median Sale Prices
 A Publication of RMLS, The Source for Real Estate Statistics in Your Community Residential Review: Metro Portland, Oregon September 2017 Reporting Period September Residential Highlights Year to Date Summary
Year to Date Summary. Average and Median Sale Prices
 A Publication of RMLS, The Source for Real Estate Statistics in Your Community Residential Review: Metro Portland, Oregon September 2018 Reporting Period September Residential Highlights Cooler numbers
MULTIFAMILY MARKET ANALYSIS
 MULTIFAMILY MARKET ANALYSIS CLANCY TERRY RMLS Student Fellow Master of Real Estate Development Candidate At the national level, annual effective rent growth in the multifamily sector has extended the strong
Closed Sales. Pending Sales
 A Publication of RMLS, The Source for Real Estate Statistics in Your Community Residential Review: Metro, Oregon January Residential Highlights While not quite as dramatic as last month, sales activity
OFFICE MARKET ANALYSIS
 OFFICE MARKET ANALYSIS ALEC LAWRENCE Portland State University The Portland Metro economy continues to perform strongly, with 3.2 percent job growth over the last 12 months spread over a diverse group
Brokers Forum Report
 Brokers Forum Report March 24, 2015 Forecast for April 2015 September 2015 The Center for Real Estate Theory and Practice 1 ASU Commercial Brokers Forum Survey Forecast for April 2015 September 2015 "Without
COMMONWEALTH TOWNHOMES SW Butner Road Beaverton, Oregon
 EXCLUSIVE LISTING COMMONWEALTH TOWNHOMES 12590-12600 SW Butner Road Beaverton, Oregon 8 Units $1,950,000 Beaverton, OR EXECUTIVE SUMMARY ASSET SUMMARY Property Address County Washington Total Units 8 Year
HOUSING MARKET ANALYSIS
 HOUSING MARKET ANALYSIS EVAN ABRAMOWITZ Joseph Bernard Investment Real Estate Oregon Association of Realtors Student Fellow & Masters of Real Estate Development Graduate Student National housing market
Monthly Market Watch for Maricopa County An overview of what is happening in the Maricopa County real estate market
 Monthly Market Watch for Maricopa County An overview of what is happening in the Maricopa County real estate market Provided by Susan Kraemer of Prudential Arizona Properties Report overview: This report
Section 179 and Bonus Depreciation New Savings for Purchases in 2013
 COMMERCIAL REAL ESTATE SERVICES MARKET NEWS In This Issue Section 179 and Bonus Depreciation 1 Industrial Market 4th Quarter Overview 2 Retail Market 4th Quarter Overview 3 Broker Focus 4 Office Market
MULTIFAMILY MARKET ANALYSIS
 MULTIFAMILY MARKET ANALYSIS CLANCY TERRY RMLS Student Fellow Master of Real Estate Development Candidate At the national level, annual effective rent growth has once again strengthened. The national rate
CENTRE 205 FOR SALE - $6,136, SE 98TH AVE. PORTLAND, OR THOMAS MCDOWELL
 CENTRE 205 2600 SE 98TH AVE. PORTLAND, OR 97266 INVESTMENT REAL ESTATE SERVICES RAYMOND DUCHEK 503.225.8492 RaymondD@norris-stevens.com THOMAS MCDOWELL 503.225.8473 TomM@norris-stevens.com Information
2017 RESIDENTIAL REAL ESTATE MARKET REPORT
 2017 RESIDENTIAL REAL ESTATE MARKET REPORT Published January 26, 2018 Our market reports have been focused on the effects of low inventory on our housing market and for good reason. December 2017 marked
OFFICE MARKET ANALYSIS
 OFFICE MARKET ANALYSIS ALEC LAWRENCE Portland State University The fourth quarter finds the Portland office market nearing a sweet spot for developers. Strong absorption, decreasing vacancy, and increasing
MARKET ACTION. Year-to-Date Trends
 KET ACTION A Publication of RMLS, The Source for Real Estate Statistics in Your Community MONTH IN REVIEW: Metro Portland, Oregon August Residential Highlights The real estate market in the Portland, Oregon
Provided by Keller Williams Realty Professional Partners Statistics from September 2010 MLS
 Monthly Market Watch for Maricopa County An overview of what is happening in the Maricopa County real estate market (using September 2010 statistics) Report overview: This report includes MLS data for
MULTIFAMILY MARKET ANALYSIS
 MULTIFAMILY MARKET ANALYSIS MARC STRABIC Portland State University So as we roll through the summer here in the Northwest, now is a good time to take stock of the multi-family market, the progress made
San Francisco Bay Area to Marin, San Francisco, and San Mateo Counties Housing and Economic Outlook
 San Francisco Bay Area to 019 Marin, San Francisco, and San Mateo Counties Housing and Economic Outlook Bay Area Economic Forecast Summary Presented by Pacific Union International, Inc. and John Burns
Closed Sales. Pending Sales
 A Publication of RMLS, The Source for Real Estate Statistics in Your Community Residential Review: Metro, Oregon December 29 Reporting Period December Residential Highlights Sales activity in the met ro
MULTIFAMILY MARKET ANALYSIS
 MULTIFAMILY MARKET ANALYSIS MARC STRABIC Portland State University At the national level, annual effective rent growth is beginning to moderate from the levels seen earlier this year. The national annual
INFORMATION ON LOW COST HOUSING IN CLACKAMAS COUNTY. May 2017
 Brenda Durbin, Director Social Services Division INFORMATION ON LOW COST HOUSING IN CLACKAMAS COUNTY May 2017 If you have a low income you may be eligible to receive help with your rent. This information
MULTIFAMILY MARKET ANALYSIS
 MULTIFAMILY MARKET ANALYSIS EVAN ABRAMOWITZ RMLS Student Fellow Master of Real Estate Development Graduate Student In late November, the National Association of Realtors indicated that Portland had the
Monthly Indicators + 7.3% + 6.6% + 8.3% Single-Family Market Overview Condo Market Overview New Listings Pending Sales.
 Monthly Indicators 2018 The three most prominent national market trends for residential real estate are the ongoing lack of abundant inventory, the steadily upward movement of home prices and year-over-year
Released: June Commentary 2. The Numbers That Drive Real Estate 3. Recent Government Action 9. Topics for Home Buyers, Sellers, and Owners 11
 Released: June 2011 Commentary 2 The Numbers That Drive Real Estate 3 Recent Government Action 9 Topics for Home Buyers, Sellers, and Owners 11 Brought to you by: KW Research Commentary The U.S. housing
RESIDENTIAL MARKET ANALYSIS
 RESIDENTIAL MARKET ANALYSIS EVAN ABRAMOWITZ RMLS Student Fellow Master of Real Estate Development Graduate Student September existing-home sales declined modestly, but inventory continued to tighten and
San Francisco Bay Area to Santa Clara & San Benito Counties Housing and Economic Outlook
 San Francisco Bay Area to 019 Santa Clara & San Benito Counties Housing and Economic Outlook Bay Area Economic Forecast Summary Presented by Pacific Union International, Inc. and John Burns Real Estate
Released: June 7, 2010
 Released: June 7, 2010 Commentary 2 The Numbers That Drive Real Estate 3 Recent Government Action 9 Topics for Home Buyers, Sellers, and Owners 11 Brought to you by: KW Research Commentary The housing
Santa Clara County Real Estate Market Overview Dynamics
 Santa Clara County Real Estate Market Overview Dynamics Data from sources deemed reliable, but may contain errors and subject to revision. All numbers should be considered approximate. Jan-90 Sep-90 May-91
Monthly Market Watch for the Prescott Quad City Area. Provided by Keller Williams Check Realty Statistics from August 2012 Prescott MLS
 August 2012 Monthly Market Watch for the Prescott Quad City Area Provided by Keller Williams Check Realty Statistics from August 2012 Prescott MLS Report Overview: This report includes MLS data for the
MULTIFAMILY MARKET ANALYSIS
 MULTIFAMILY MARKET ANALYSIS Portland State University Effective rent growth climbs in Q2 but continues downward annual trend. Occupancy remains relatively steady and slightly above long-term average. Rent
LUXURY MARKET REPORT. - January
 LUXURY MARKET REPORT - January 2018 - www.luxuryhomemarketing.com THIS IS YOUR LUXURY MARKET REPORT MAP OF LUXURY RESIDENTIAL MARKETS Welcome to the Luxury Market Report, your guide to luxury real estate
STARK STREET COURT 10 STUDIOS + SFR HOUSE PORTLAND, OR OFFERING MEMORANDUM. Investment Real Estate www. hfore.com (503)
") STARK STREET COURT 10 STUDIOS + SFR HOUSE PORTLAND, OR OFFERING MEMORANDUM Investment Real Estate www. hfore.com (503) 241.5541 INVESTMENT OVERVIEW Stark Street Court is an 11-unit garden-court apartment
STARK STREET COURT 10 STUDIOS + SFR HOUSE PORTLAND, OR OFFERING MEMORANDUM Investment Real Estate www. hfore.com (503) 241.5541 INVESTMENT OVERVIEW Stark Street Court is an 11-unit garden-court apartment
SMALL INVESTORS CAN NOW PROVIDE TURNKEY PROPERTIES NATIONWIDE
 SMALL INVESTORS CAN NOW PROVIDE TURNKEY PROPERTIES NATIONWIDE Large real estate investment firms have been riding a large wave of opportunity and profit margins by providing turnkey rental investment properties
Manhattan Residential Rental Market Report
 Manhattan Residential Rental Market Report Second Quarter 217 Second Quarter 217 This report follows overall conditions in the Manhattan rental market during June as well as throughout the second quarter
Portland Multifamily Market
 Portland Multifamily Market According to Norris, Beggs & Simpson s First Quarter 2009 Multifamily Report, the overall multifamily vacancy rate has increased in the first quarter to 4.96% compared to 3.80%
Released: June 7, 2010
 Released: June 7, 2010 Commentary 2 The Numbers That Drive Real Estate 3 Recent Key Events 9 Topics for Home Buyers, Sellers, and Owners 11 Brought to you by: KW Research Commentary Canada s economy continues
A New Bar Center An Information Sheet for Members of the Oregon State Bar December 1, 2005
 A New Bar Center An Information Sheet for Members of the Oregon State Bar December 1, 2005 Introduction At its November 19 meeting, the Board of Governors of the Oregon State Bar voted to enter into a
ECONOMIC CURRENTS. Vol. 4, Issue 3. THE Introduction SOUTH FLORIDA ECONOMIC QUARTERLY
 ECONOMIC CURRENTS THE Introduction SOUTH FLORIDA ECONOMIC QUARTERLY Vol. 4, Issue 3 Economic Currents provides an overview of the South Florida regional economy. The report presents current employment,
Summary. Houston. Dallas. The Take Away
 Page Summary The Take Away The first quarter of 2017 was marked by continued optimism through multiple Texas metros as job growth remained positive and any negatives associated with declining oil prices
Vancouver Real Estate Wave 2 July 26, 2016
 Vancouver Real Estate Wave 2 July 26, 2016 (T-DENOTES TRACKING, N-DENOTES NEW) T-1. First of all, please indicate the specific Metro Vancouver municipality in which you live: Burnaby Coquitlam Delta and
BONDREPORT QTR BONDNEWYORK.COM
 BONDREPORT QTR 4 2018 BONDREPORT QTR 4 2018 WELCOME TO THE 23RD EDITION OF THE BOND REPORT Looking back on 2018, the year can perhaps best be described as a consistent movement towards corrections. After
SELF-STORAGE REPORT VIEWPOINT 2017 / COMMERCIAL REAL ESTATE TRENDS. By: Steven J. Johnson, MAI, Senior Managing Director, IRR-Metro LA. irr.
 SELF-STORAGE REPORT VIEWPOINT 2017 / COMMERCIAL REAL ESTATE TRENDS By: Steven J. Johnson, MAI, Senior Managing Director, IRR-Metro LA The Self Storage Story The self-storage sector has been enjoying solid
The Ridge Apartments $2,950, Units in the Chattanooga TN Market Area. Great Property Great Location. Asking Price:
 Great Property Great Location The Ridge Apartments 40 Units in the Chattanooga TN Market Area Asking Price: $2,950,000 3400 Lisa Dr & 3400 Gail Dr East Ridge, TN 37412 Recently renovated property in the
Seattle Housing Market Overview January 2019
 Seattle Housing Market Overview January 2019 A review of recent trends and thoughts about the future of the Seattle housing market. Bill King President, Chief Valuation Officer Real Info, Inc. City of
FEBRUARY 2019 Harrisonburg & Rockingham County Real Estate Market Report
 FEBRUARY 219 Real Estate Market Report An analysis of real estate activity through January 31, 219 provided courtesy of Scott P. Rogers, Funkhouser Real Estate Group Immaculate Brick Highland Park Colonial
Sherwood Ice Arena. Offering Memorandum For Sale Investment Opportunity SW BORCHERS DRIVE SHERWOOD, OREGON PRESENTED BY:
 Offering Memorandum For Sale Investment Opportunity Sherwood Ice Arena 20407 SW BORCHERS DRIVE SHERWOOD, OREGON 97140 PRESENTED BY: Michael D. Holzgang Senior Vice President Corporate Services DIRECT +1
Has The Office Market Reached A Peak? Vacancy. Rental Rate. Net Absorption. Construction. *Projected $3.65 $3.50 $3.35 $3.20 $3.05 $2.90 $2.
 Research & Forecast Report OAKLAND METROPOLITAN AREA OFFICE Q1 Has The Office Market Reached A Peak? > > Vacancy remained low at 5. > > Net Absorption was positive 8,399 in the first quarter > > Gross
WEST MAIN AT THE PARK
 WEST MAIN AT THE PARK 40 Units - Hillsboro, Oregon OFFERING MEMORANDUM INVESTMENT SUMMARY ASSET SUMMARY Property West Main at the Park Location 1025 W Main Street Hillsboro, Oregon 97123 County Washington
16 UNIT PORTFOLIO - 3 CORNER PROPERTIES 16 Unit Multifamily Portfolio - 3 Properties, Salem, OR
 M U LT I F A M I LY P R O P E R T Y F O R S A L E 16 UNIT PORTFOLIO - 3 CORNER PROPERTIES 16 Unit Multifamily Portfolio - 3 Properties, Salem, OR PRESENTED BY: AJ NASH 503.390.1375 aj@legacyre.com Licensed
METROPOLITAN TRACT PERFORMANCE REPORT For the Quarter Ended June 30, 2006
 F-5 METROPOLITAN TRACT PERFORMANCE REPORT For the Quarter Ended June 30, 2006 Finance, Audit & Facilities Committee September 21, 2006 CONSOLIDATED METROPOLITAN TRACT PROPERTIES Quarterly Summary Quarterly
CoStar Office Statistics. Y e a r - E n d Portland Office Market
 CoStar Office Statistics Y e a r - E n d 2 0 1 7 Year-End 2017 Portland Table of Contents Table of Contents................................................................. A Methodology......................................................................
Chicago s industrial market thrives during the third quarter.
 CHICAGO INDUSTRIAL MARKET MONITOR THIRD QUARTER 2015 Chicago s industrial market thrives during the third quarter. Demand across the Chicago industrial market remains high sending absorption up and vacancy
BONDREPORT QTR BONDREPORT QTR BONDNEWYORK.COM
 BONDREPORT QTR 4 2017 WELCOME TO THE 19 TH EDITION OF THE BOND REPORT It has been quite the year on many fronts, and by all indications, 2017 has no intention of going quietly. The market has continued
Seattle Market Watch April 2018 Data from Northwest Multiple Listing Service April 9, 2018
 Seattle March numbers Change from Feb 427 for Sale + 47% Seattle Watch April 2018 Supply & Demand Trends For Sale Sold Pending Spring is bringing out the buyers (and the inventory) Monthly data for Seattle,
Portland, Oregon SUMMARY FLYER
 74-UNIT APARTMENT COMMUNITY Portland, Oregon SUMMARY FLYER KIDDER MATHEWS BEVERLY GROVE 2 EXECUTIVE SUMMARY Section 1 The Offering Investment Highlights Market Overview OFFERING MEMORANDUM KIDDER MATHEWS
2019 Housing Market Forecast. Palos Verdes Peninsula AOR January 8, 2019 Jordan G. Levine Senior Economist
 2019 Housing Market Forecast Palos Verdes Peninsula AOR January 8, 2019 Jordan G. Levine Senior Economist Overview Good News: Economic fundamentals solid Homeownership still the dream Rates might not go
Rents Up, Occupancy Steady
 Rents Up, Steady Kansas City s apartment market closed 2014 with a significant increase in rents compared to the prior year. The average per-square-foot rent was $0.88. At the end of 2013 it had been $0.85.
2004 Oklahoma City Mid-Year Apartment Report. July 2004
 Mid-Year Apartment Report July 2004 Providing professional apartment brokerage and marketing services in Oklahoma for over 19 years Aaron Hargrove 1831 East 71st Street Tulsa, Oklahoma 74136 Phone: 918.557.5966
Rightmove House Price Index
 Rightmove House Price Index The largest monthly sample of residential property prices January 2018 London edition Asking prices down 1.4% in London this month as sellers tempt New Year buyers New-to-market
TUCSON and SOUTHERN ARIZONA
 TUCSON and SOUTHERN ARIZONA End of Year Housing Report (52) 818-454 Stephen@TeamWoodall.com 217 End of Year Housing Report SALES & INVENTORY Housing market trends For the overall real estate market in
OFFICE MARKET ANALYSIS
 OFFICE MARKET ANALYSIS GEOFF FALKENBERG Oregon Association of Realtors Fellow The Urban Land Institute ranked Portland 11th in the nation among Markets to Watch for real estate investment in 2014. Jones
7 Tips to Increase Your Real Estate Profits in Today s Markets BY J SCOTT
 7 Tips to Increase Your Real Estate Profits in Today s Markets BY J SCOTT 10 E 23rd Street, 5th FL New York, NY 10010 646-895-6090 info@fundthatflip.com Higher-Level Details of the Real Estate Market Learn
Released: October 2011
 Released: October 2011 Commentary 2 The Numbers That Drive Real Estate 3 Special Report 9 Brought to you by: KW Research Commentary The national housing market remains firmly planted in balanced territory.
RESIDENTIAL MARKET ANALYSIS
 RESIDENTIAL MARKET ANALYSIS NGAN NGUYEN Oregon Association of Realtors Student Fellow & Certificate of Real Estate Development Graduate Student Oregon s Office of Economic Analysis warns that the housing
Time for Retail to Take Stock
 Q1 2013 RETAIL LAS VEGAS NEVADA RESEARCH & FORECAST REPORT Time for Retail to Take Stock It is heartening to say, after five years of a bad economy, that the first quarter of 2013 s 119,649 square feet
2Q 17. Office Market Report
 2Q 17 Office Market Report Low vacancy rates and steady rental rates characterize the Portland office market Portland s office market has reached a level of strength not seen since the great recession.
Coachella Valley Median Detached Home Price April April 2017
 The Desert Housing Report Median Price $450,000 $400,000 Coachella Valley Median Detached Home Price April 2002 - $349,000 $389,000 $350,000 $300,000 $250,000 $200,000 $150,000 CV Detached Median Price
Chicago s industrial market thrives during the second quarter.
 Economic Overview CHICAGO INDUSTRIAL MARKET MONITOR SECOND QUARTER 2015 Chicago s industrial market thrives during the second quarter. Demand across the Chicago industrial market remains high sending absorption
OFFICE MARKET ANALYSIS
 OFFICE MARKET ANALYSIS KYLE BROWN RMLS Fellow, Master of Real Estate Development Candidate Amid some encouraging signs nationally, the Portland office market has maintained its stability, with the CBD
NOVEMBER 2018 Harrisonburg & Rockingham County Real Estate Market Report
 NOVEMBER 218 Real Estate Market Report An analysis of real estate activity through October 31, 218 provided courtesy of Scott P. Rogers, Funkhouser Real Estate Group Custom-Built Highland Park Home with
RECENT SALES. CHATTANOOGA Q Multifamily. Research & Forecast Report. Accelerating success.
 Research & Forecast Report CHATTANOOGA Q3 2017 Multifamily Accelerating success. Source: AXIOMetrics. RCA, CoStar Market Survey Results and Forecasts Sequential Month Annual 4Q16 1Q17 2Q17 3Q17 Sep-17
7/14/2016. Needed Housing. Workforce Housing. Planning for Needed Housing June 30, 2016 GOAL 10: HOUSING OAR (10)
") Needed Housing Planning for Needed Housing June 30, 2016 Damon Runberg, Oregon Employment Dept. Jim Long, City of Bend Affordable Housing Mgr. Tom Kemper, Housing Works Executive Director GOAL 10: HOUSING
Needed Housing Planning for Needed Housing June 30, 2016 Damon Runberg, Oregon Employment Dept. Jim Long, City of Bend Affordable Housing Mgr. Tom Kemper, Housing Works Executive Director GOAL 10: HOUSING
The supply of single-family homes for sale remains
 Oh Give Me a (Single-Family Rental) Home Harold D. Hunt and Clare Losey December, 18 Publication 2218 The supply of single-family homes for sale remains tight in many markets across the United States.
Housing Bulletin Monthly Report
 August 21 Housing Bulletin Monthly Report 1 C a n a da s P r e li m i n a ry H o u s i n g S ta r t s s l i p i n J u ly Preliminary Housing St arts in Albert a* and Canada* July 28 to July 21 25, Canada
CoStar Office Statistics. M i d - Y e a r Portland Office Market
 CoStar Office Statistics M i d - Y e a r 2 0 1 7 Mid-Year 2017 Portland Table of Contents Table of Contents................................................................. A Methodology......................................................................
Real Estate Trends in Central Ohio
 Real Estate Trends in Central Ohio Presentation by Jung Kim December 3, 2015 The National Picture: Highlights from ULI s Emerging Trends in Real Estate Prospects by real estate industry Abysmal Fair Excellent
MARCH 2019 Harrisonburg & Rockingham County Real Estate Market Report
 MARCH 219 Real Estate Market Report An analysis of real estate activity through February 28, 219 provided courtesy of Scott P. Rogers, Funkhouser Real Estate Group Spacious Four Bedroom Brick Colonial
MarketREVIEW INSIGHT TRENDS PERSPECTIVE. Adams County, PA 2nd Quarter 2015
 MarketREVIEW INSIGHT TRENDS PERSPECTIVE Adams County, PA 2nd Quarter 2015 RESEARCH & MAPPING TABLE OF CONTENTS RETAIL MARKET REVIEW Adams County Retail Vacancy Remains Low 3 Dear Reader, This report provides
OCTOBER 2018 Harrisonburg & Rockingham County Real Estate Market Report
 OCTOBER 218 Real Estate Market Report An analysis of real estate activity through September 3, 218 provided courtesy of Scott P. Rogers, Funkhouser Real Estate Group Five Bedroom City Home with Finished
San Francisco Bay Area to Napa County Housing and Economic Outlook
 San Francisco Bay Area to 019 Napa County Housing and Economic Outlook Bay Area Economic Forecast Summary Presented by Pacific Union International, Inc. and John Burns Real Estate Consulting, LLC On Nov.
Second Quarter: Suburban Maryland s Uptick in Leasing has yet to be Realized in Absorption Numbers
 Q2 2013 OFFICE SUBURBAN MARYLAND SUBURBAN MARYLAND MARKET REPORT Second Quarter: Suburban Maryland s Uptick in has yet to be Realized in Numbers Updated May 2012 MARKET INDICATIONS Q2 2013 Q3 2013 (p)
Volume II Edition I Why This is a Once in a Lifetime Opportunity for Investors
 www.arizonaforcanadians.com Volume II Edition I Why This is a Once in a Lifetime Opportunity for Investors In This Edition How to make great investment returns in a soft market U.S. Financing for Canadians
Cycle Monitor Real Estate Market Cycles Third Quarter 2017 Analysis
 Cycle Monitor Real Estate Market Cycles Third Quarter 2017 Analysis Real Estate Physical Market Cycle Analysis of Five Property Types in 54 Metropolitan Statistical Areas (MSAs). Income-producing real
Volume III Edition I 2011 Year end Recap What will 2012 Bring? Financing for Canadians Where are Canadians Buying in the Greater Phoenix area?
 The Realtors Canadians Trust www.arizonaforcanadians.com Volume III Edition I 2011 Year end Recap What will 2012 Bring? Financing for Canadians Where are Canadians Buying in the Greater Phoenix area? As
PACIFIC NORTHWEST ANNUAL MARKET REPORT PORTLAND OREGON SOUTHWEST WASHINGTON PUGET SOUND
 2017 PACIFIC NORTHWEST ANNUAL MARKET REPORT PORTLAND OREGON SOUTHWEST WASHINGTON PUGET SOUND 2017 ANNUAL MARKET REPORT A WORD FROM THE PRESIDENT ABOUT PORTLAND OREGON REGION SOUTHWEST WASHINGTON EASTSIDE
OFFERING MEMORANDUM SW 74th Ave, Portland, OR GARDEN HOME CENTER. Fully Leased Retail Investment with Excess Residential Parcel
 OFFERING MEMORANDUM 7570 SW 74th Ave, Portland, OR GARDEN HOME CENTER GARDEN HOME CENTER Fully Leased Retail Investment with Excess Residential Parcel LOCATION HIGHLIGHTS Highly visible corner location
Exclusively Listed. Farmington Apartments Price: $6,500,000 Units: 166 GRM: 6.30 Price/Unit: $39,157. Location. Summary
 Exclusively Listed Location 13787 SW Farmington Rd., Beaverton, OR 97005 Summary Ideally located in Central Beaverton, just east of Murray Blvd and just south of T.V. Highway, 3 blocks from the Max Light
The Crossings, Lethbridge
 The Crossings, Lethbridge Market Study Update October 2012 Prepared for: City of Lethbridge Prepared by: MXD Development Strategists Ltd. www.mxddevelopment.com 0 Retail Market Update According to a 2012
RESIDENTIAL REVIEW. Better Technology Better Marketing BETTER RESEARCH Better Education Better Support
 RESIDENTIAL REVIEW Better Technology Better Marketing BETTER RESEARCH Better Education Better Support TABLE OF CONTENTS 3 Residential Resale Overview 4 Residential Investment Research 5 Better Technology
Rightmove House Price Index
 Rightmove House Price Index The largest monthly sample of residential property prices March 2018 National edition Prices hit record highs in first-time and second-stepper sectors Average asking price of
May 2013 April 2013 May 2012 Manhattan Condo Index 2,106 2, % 1, %
 Market Report NOTICE: StreetEasy is pleased to present our 2013 Q2 Quarterly Report on the residential market. This preview version of the report is based on over 1,000 broker sources and will provide
MULTIFAMILY 2012 MULTI-FAMILY HAMPTON ROADS MARKET REVIEW. Author. Data Analysis. Financial Support. Disclosure. Charles Dalton.
 HAMPTON ROADS MARKET REVIEW MULTIFAMILY Author Data Analysis Financial Support Disclosure Charles Dalton Real Data The E. V. Williams Center for Real Estate and Economic Development (CREED) functions and
Residential Market Update
 Residential Market Update 2016 Quarter 4 Information Proudly Provided by your Business Development Managers: Nancy Pierson Biltmore / nancyp@eta-az.com / 602-769-1438 Maggie Clark Scottsdale / maggiec@eta-az.com
MARKET OUTLOOK FOR SAN MATEO
 MARKET OUTLOOK FOR SAN MATEO Jonathan Smoke Chief Economist August 2, 2016 NATIONAL TRENDS 2 JOB CREATION REBOUNDED IN JUNE 229,000 jobs created by month in 2015; 172,000 average this year Employment and