ALEXANDER & BALDWIN. Premier Hawaii Real Estate Company ANALYST DAY PRESENTATION September 14, 2017
|
|
|
- Vanessa McGee
- 6 years ago
- Views:
Transcription


1 1 ALEXANDER & BALDWIN Premier Hawaii Real Estate Company ANALYST DAY PRESENTATION September 14, 2017

2 AGENDA 2 Welcome Opening Remarks Commercial Real Estate Materials & Construction Suzy Hollinger Chris Benjamin Lance Parker Jim Mead Break Land Operations Overview Active Development For Sale Landholdings Financial Review Closing Remarks Chris Benjamin Lance Parker Lance Parker Jim Mead Chris Benjamin Q&A
3 SAFE HARBOR STATEMENT 3 Statements in this call and presentation that are not historical facts are forward-looking statements within the meaning of the Private Securities Litigation Reform Act of Forward-looking statements can typically be identified by words such as believe, expect, estimate, predict, target, potential, likely, continue, ongoing, could, should, intend, may, will, might, plan, seek, anticipate, project and similar expressions, as well as variations or negatives of these words. These forwardlooking statements include, but are not limited to, statements regarding possible or assumed future results of operations, business strategies, growth opportunities and competitive positions. Such forward-looking statements speak only as of the date the statements were made and are not guarantees of future performance. Forward-looking statements are subject to a number of risks, uncertainties, assumptions and other factors that could cause actual results and the timing of certain events to differ materially from those expressed in or implied by the forward-looking statements. These factors include, but are not limited to, prevailing market conditions and other factors related to the Company s REIT status and the Company business generally discussed in the Company s most recent Form 10-K, Form 10-Q and other filings with the Securities and Exchange Commission. The information in this call and presentation should be evaluated in light of these important risk factors. We do not undertake any obligation to update the Company s forward-looking statements.


4 4 Opening Remarks Chris Benjamin President & CEO Alexander & Baldwin
5 A&B: PREMIER HAWAII REIT INVESTMENT OPPORTUNITY years in Hawaii Deep knowledge of Hawaii real estate and track record of execution Access to all Hawaii CRE opportunities Actively transitioning to greater focus on recurring cash generation from CRE portfolio Unique assets with embedded opportunity for growth Generation of internally-sourced capital

6 A&B is the BEST PUBLIC COMPANY vehicle to gain exposure to Hawaii real estate 6
7 HAWAII IS A HIGH-PERFORMING MARKET WITH SUBSTANTIAL BARRIERS TO ENTRY 7 Steady real GDP growth Strong tourism industry On track for 6th consecutive record year Arrivals up 4.8%* Visitor spending up 8.9%* Low unemployment of 2.7%** Positive personal income growth and retail spending * YTD July 2017 ** As of July 31, 2017 $75 $70 $65 $60 SOLID ECONOMIC FUNDAMENTALS Steady Hawaii Real GDP Growth ($ in billions) $73B Source: State of Hawaii Department of Business, Economic, Development & Tourism (DBEDT)
8 HIGH BARRIER TO ENTRY MARKET 8 Hawaii s geographic location helps insulate it from factors plaguing Mainland retail assets like internet sales penetration 2,400 MILES 1,973,946 (48%)

9 HIGH BARRIER TO ENTRY 9 Limited urban-zoned land and lengthy and complex entitlement and permitting process STATE ACREAGE BY USE 1,973,946 1,932, ,620 (48%) (47%) (5%) Conservation Agriculture Urban Result: Low amount of grocery/drug anchored square feet per capita Source: Lee Sichter LLC, 2014; State of Hawaii Office of Planning (planning.hawaii.gov/lud/);data provided for informational purposes only; no endorsement implied.


10 STRONG MARKET FUNDAMENTALS DRIVE PERFORMANCE 10 $27.50 A&B HAWAII RETAIL ABR PSF vs $19.90 PEER AVERAGE RETAIL ABR PSF $787 A&B AVERAGE GROCER SALES PSF vs $608 PEER AVERAGE GROCER SALES PSF A&B data as of 6/30/17; Peer data is as of 12/31/2016 $13.33 A&B HAWAII INDUSTRIAL ABR PSF vs $5.21 PEER AVERAGE RETAIL ABR PSF

11 CRE GROWTH OPPORTUNITIES 11 REDEVELOPMENT Lau Hala Shops REPOSITIONING Pearl Highlands Center DEVELOPMENT Ho okele Shopping Center
12 MANAGEMENT TEAM WITH DEEP LOCAL ROOTS, BROAD SKILL SET 12 Chris Benjamin President & CEO Lance Parker A&B Properties President Gordon Yee Grace Pacific President James Mead Chief Financial Officer Nelson Chun Senior Vice President and Chief Legal Officer Meredith Ching Senior Vice President, Government & Community Relations BROAD SKILL SET TO EXECUTE STRATEGY Leasing Asset and property management Development commercial and residential Entitlement and permitting Acquisitions Agriculture and farming Materials and specialty construction management Government and community relations Real estate and corporate law Finance, accounting and taxation
13 180% FOCUSED ON CREATING SHAREHOLDER VALUE 13 ALEX +141% 160% 140% 120% 100% 80% Mainland CRE Migration to Hawaii $1.4B Hawaii CRE Investment Announced Sugar Cessation Announced REIT Evaluation REIT Conversion 60% Announce 40% separation of 20% Matson and 0% A&B 12/1/11-20% 6/29/12 1/1/13 1/1/14 1/1/15 1/1/16 1/1/17 RMZ +54% 8/31/17


14 STRATEGIC MISSION 14 Hawaii sharpshooter Strategic activities and capital allocation to be weighted toward commercial real estate Focused on using asset base and broad capabilities to drive value as a REIT


15 15 Commercial Real Estate Lance Parker President A&B Properties

16 CRE MANAGEMENT TEAM 16 Lance Parker President A&B Properties Leslie Brown Vice President Leasing Kit Millan Vice President Asset Management Jeff Pauker Vice President Investments Rick Stack Senior Vice President Development
17 HAWAII CRE PORTFOLIO LARGEST OWNER OF GROCERY/DRUG-ANCHORED SHOPPING CENTERS 17 $74.6M HAWAII ANNUALIZED CASH NOI* Retail 1.8M sf TOTAL GLA 1.5M sf OAHU $27.50 ABR PSF $4.3M Office 6% Industrial 1.0M sf TOTAL GLA 0.7M sf OAHU $13.33 ABR PSF Retail 63% $47.4M $11.7M $11.2M Ground Lease 16% Ground Lease 116 acres TOTAL 42 acres OAHU 74 acres NEIGHBOR ISLAND Industrial 15% * Annualized YTD June 2017 Note: See appendix for a statement on management s use of non-gaap financial measures and required reconciliations.
18 HAWAII RETAIL PORTFOLIO 18 KAUAI OAHU MAUI BIG ISLAND Hanalei Lihue Waimea Poipu Haleiwa Waianae Mililani Pearl City Kapolei Kaneohe Downtown Manoa Kailua Kaanapali Lahaina Kahului Wailea Waimea Hana Kukio Kailua-Kona Hilo Captain Cook 1.8M GLA $47.4M ANNUALIZED CASH NOI* 93.9% OCCUPANCY** $27.50 ABR PSF * Annualized YTD June 2017 ** At 6/30/17

19 STRIP CENTER RETAIL SF PER CAPITA Source: Green Street Advisors; comparative data set represents top 30 markets as determined by Green St. Advisors Data provided for informational purposes only; no endorsement implied.

20 LOW INTERNET SALES PENETRATION 20 Shipping costs are high or shipping is unavailable Longer wait times for order delivery than for continental U.S. locations Cost of returns and lag in receiving credits Source: Adobe Insights (May 2017)


 Data provided for")
21 21 3rd LOWEST UNEMPLOYMENT RATE IN THE NATION 6.0% 5.0% 4.0% 3.0% U.S. unemployment 2.7% 2.0% 1.0% 0.0% Source: July 2017, Bureau of Labor Statistics (bls.gov) Data provided for informational purposes only; no endorsement implied.
22 22 $83.3K HOUSEHOLD INCOME IN 3-MILE RADIUS OF CENTERS $120,000 $100,000 $80,000 Peer median $60,000 $40,000 $20,000 $0 FRT AAT AKR REG ALEX UE ROIC KIM RPAI DDR WRI BRX Source: Green Street Advisors, Company disclosures; comparative data set represents strip retail peers under Green St. coverage Data provided for informational purposes only; no endorsement implied.


23 23 $11.4K HIGH RETAIL SALES PER CAPITA 2015 Median Household Income $80 $60 $40 $20 $0 $73 $11.4 $65 $9.9 $61 $9.8 $56 $10.1 Hawaii California New York U.S. Avg Median HH Income (left axis) Retail Sales per Capita (right axis) $12.0 $11.0 $10.0 $9.0 $8.0 Source: Green Street Advisors Data provided for informational purposes only; no endorsement implied. Retail Sales per Capita

24 24 $27.50 HIGH ANNUALIZED BASE RENT PSF $30 $25 $20 Peer average $15 $10 $5 $0 ALEX AAT FRT AKR REG ROIC WRI UE RPAI DDR KIM BRX Grocer Power Hybrid Data as of 6/30/17 Source: Green Street Advisors, Company disclosures; comparative data set represents strip retail peers under Green St. coverage. Data provided for informational purposes only; no endorsement implied.

25 25 $ GROCER SALES PRODUCTIVITY $781 (SALES/SF) $800 $700 $600 Peer average $500 $400 $300 $200 $100 $0 ALEX UE ROIC FRT REG WRI BRX RPAI DDR Source: Green Street Advisors, Company disclosures. These numbers are imperfect since not all grocers report sales to the REITs. Data provided for informational purposes only; no endorsement implied
26 HIGH HAWAII RETAIL RELEASING SPREADS 26 QUARTER ENDED JUNE 30, 2017 TTM ENDED JUNE 30, % RENT SPREAD 21% RENT SPREAD 27 LEASES 106 LEASES 82K GLA 238K GLA $31.11 ABR PSF $36.83 ABR PSF
27 27 8.0% 7.0% 6.0% 7.0% STRONG 2016 RETAIL SAME-STORE CASH NOI GROWTH 5.0% 4.0% 3-4% 2017 RETAIL SAME-STORE CASH NOI GUIDANCE 5.0% 3.0% 4.0% 2.0% 3.0% 2.0% 1.0% 1.0% 0.0% ALEXROIC AAT UE REG RPAI AKR WRI FRT DDR KIM BRX 0.0% -1.0% ROIC REG ALEX FRT WRI KIM BRX RPAI AKR AAT UE DDR Source: Green Street Advisors, Company disclosures; comparative data set represents strip retail peers under Green St. coverage. Data provided for informational purposes only; no endorsement implied.
28 28 20% 2% LOW EXPOSURE TO AT RISK RETAILERS 15% 10% Peer average 5% 0% ALEX ROIC AAT REG BRX WRI AKR FRT KIM UE RPAI DDR At Risk retailers are those most likely to close stores or seek lower rents upon lease expirations. Source: Green Street Advisors, Company disclosures; comparative data set represents strip retail peers under Green St. coverage. Data provided for informational purposes only; no endorsement implied.
29 A&B S HAWAII RETAIL PORTFOLIO GARNERS A LOW CAP RATE U.S. NEIGHBORHOOD/COMMUNITY CENTER KEY RATES CBRE Cap Rate Survey 1H17 29 Tier 3 Tier I 7% 6.5% 6.5% 6% 5% 4% 4.3% 4.8% 5.5% 4.3% 5.0% 5.5% 5.0% 4.3% 3% 2% Low High 1% 0% Honolulu HI Oakland CA San Francisco CA Inland Empire CA Los Angeles CA


30 HAWAII INDUSTRIAL PORTFOLIO 30 KAUAI OAHU MAUI BIG ISLAND Hanalei Lihue Waimea Poipu Haleiwa Waianae Mililani Pearl City Kapolei Kaneohe Downtown Manoa Kailua Kaanapali Lahaina Kahului Wailea Waimea Hana Kukio Kailua-Kona Hilo Captain Cook 1.0M GLA $11.2M ANNUALIZED CASH NOI* 94.4% OCCUPANCY** $13.33 ABR PSF * Annualized YTD June 2017 ** At 6/30/17
31 OAHU INDUSTRIAL MARKET 31 34% <2% RENT GROWTH VACANCY SINCE 2011 $1.40 Avg. Asking NNN Rent $ % Vacancy Rate $ % $ % 1.75% $ Q % Q17 Source: Colliers International Data provided for informational purposes only; no endorsement implied.
32 LOW INDUSTRIAL SUPPLY GROWTH 32 Industrial Supply Growth Indexed to 1980 Industrial Supply Annual Growth Rate % % % '80 '85 '90 '95 '00 '05 '10 '15 U.S. West Coast High-Barrier Honolulu U.S. West Coast H-B Honolulu Source: CBRE Econometric Advisors

33 STRONG INDUSTRIAL PORTFOLIO Industrial Portfolio Annualized Rent and Average Age $ $6 $5 $5 $5 $5 $4 A&B HI Industrial DCT Industrial EastGroup Liberty Property Trust Annualized Base Rent Prologis Avg. Building Age First Industrial Duke Realty Source: Green Street Advisors, Company disclosures; comparative data set represents industrial peers under Green St. coverage. Data provided for informational purposes only; no endorsement implied.
34 INDUSTRIAL KEY RATES CBRE Cap Rate Survey 1H % 5% 4% Tier 3 5.5% 5.0% Tier I 4.5% 4.5% 4.5% 4.5% 4.0% 4.0% 4.0% 4.0% 3% 2% Low High 1% 0% Honolulu HI Oakland CA San Francisco CA Inland Empire CA Los Angeles CA


35 35 HONOKOHAU INDUSTRIAL 6/6/17 ACQUISITION DATE 73,200 SQUARE FEET $10.1M PRICE 94% GOING-IN OCCUPANCY 8.3% GOING-IN CAP RATE $14.67 ABR PSF AS OF 6/30/17
36 HAWAII GROUND LEASE PORTFOLIO 36 OAHU MAUI Haleiwa Waianae Mililani Kaneohe Kaanapali Lahaina Kahului Hana Pearl City Downtown Kapolei Manoa Kailua Wailea * Annualized YTD June ACRES $11.7M ANNUALIZED CASH NOI*


37 GROUND LEASE PORTFOLIO BENEFITS Costs of ownership is passed to tenant; minimal landlord ownership and operating expenses No capital expenditure or tenant improvement costs, or depreciation expense Minimal property management required Rent resets based on percentage of fair market value of land leased to tenant 2015 $1.6M buyout of Aikahi Park Shopping Center at 25% cap rate Kaiser Permanente Redevelopment of Macy s will FMV reset 17% cash NOI increase cash NOI to increase $2.1M-$2.6M (from $0.2M) with investment of $21M
38 GROUND LEASE PORTFOLIO WITH EMBEDDED OPPORTUNITY 38 TOP 10 GROUND LEASES GROUND LEASES LOCATION ACRES PROPERTY TYPE EXP. YEAR NEXT RENT STEP STEP TYPE ABR ($ in $000) 1 Oahu 15.4 Grocery-Anchored FMV Reset $2,100 SECURE INCOME STREAM WITH GROWTH 2 Oahu 2.8 Grocery-Anchored FMV Reset 1,344 3 Maui 5.3 Medical Office Kailua 3.4 Grocery-Anchored Fixed Step Maui 52.0 Heavy Industrial FMV Reset Kailua 3.7 Retail 2020 Option FMV Reset Kailua 1.6 Retail %+ GROUND LEASE ABR EXPIRING OR RESETTING BY Kailua 2.2 Retail Fixed Step Oahu 0.5 Parking Oahu 0.5 Retail

 FMV reset 3.")
 FMV reset Windward City (218,000 sf")
39 GROUND LEASE ESCALATIONS & REVERSIONS acre in urban Honolulu with gas & convenience store reversion Kaimuki Shopping Center (86,400 sf grocery-anchored center) FMV reset 3.7-acre auto dealership reversion Pali Palms (59,000 sf office complex) FMV reset Windward City (218,000 sf grocery-anchored center) FMV reset


40 40 INCREASE CASH NOI WITH ACTIVE DEVELOPMENT & REDEVELOPMENT OPPORTUNITIES As of June 30, 2017 PROJECT Pearl Highlands Center Food Court/ Regal renovation* Lau Hala Shops (Kailua Macy s) repositioning Ho`okele Shopping Center development PHASE IN- SERVICE CAPITAL INCREMENTAL STABILIZED CASH NOI STABILIZED YIELD ON COST Construction Late 2017 $6.0M $0.6M % 54,000 Construction 2018 $21.0M $1.9 - $2.4M % 48,400 Pre-leasing Late 2019 $41.9M** $3.1 - $3.6M % 94,000 Total $68.9M $5.6 - $6.6M % 196,400 Includes $3M of tenant improvement capital to Regal Entertainment for their renovations that provide a 10.3% stabilized yield on cost ** Includes land at book value; stabilized yield on cost would be about 100bps lower if included at market value Note: Complete table, including leasing activity, is included the second quarter 2017 Updated Supplemental Information report. SQ. FT.


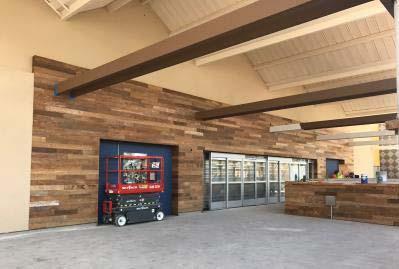
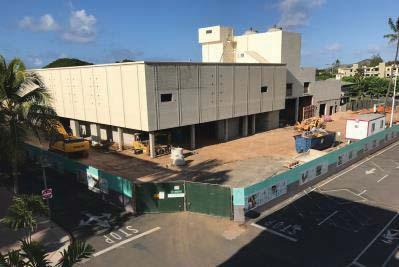
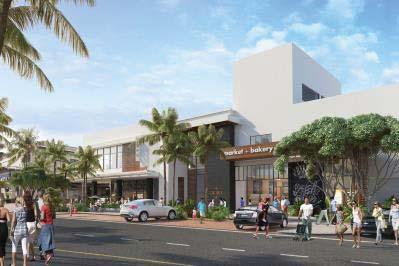
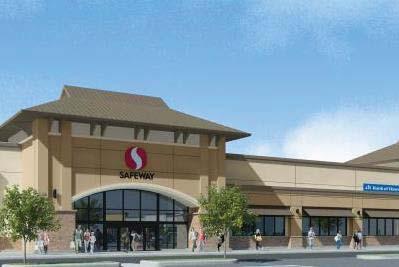
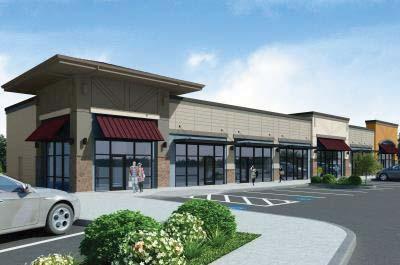
41 LAU HALA SHOPS New 48,400-sf shopping center with 10 leasable spaces ranging in size from 800 to 20,000 sf that will become a focal point for the vibrant Kailua community 41 PEARL HIGHLANDS CENTER 405,000-sf power retail center in Pearl City, Oahu. Renovation of the Regal Cinemas and redevelopment of the Center s food court. HO`OKELE SHOPPING CENTER New 94,000-sf shopping center, anchored by 57,400-sf Safeway store and gas station located at the gateway to Maui Business Park


42 42 ACQUISITIONS 93% Off-market, or first look, opportunities 50% Win rate for retail transactions in last 5 years $600M+ Active LOIs $50M Budgeted for new commercial property acquisitions in 2017 Preference for grocery/druganchored shopping center and industrial properties


43 OAHU RETAIL & INDUSTRIAL MARKET 43 Majority of retail and industrial CRE is not institutionally owned Ownership is fragmented A&B ownership of Oahu market Retail 20% Industrial <1% Source: Colliers, A&B Data provided for informational purposes only; no endorsement implied.


44 44 Materials & Construction Jim Mead Chief Financial Officer Alexander & Baldwin
45 MATERIALS & CONSTRUCTION VERTICALLY INTEGRATED BUSINESS 45 Quarries Asphalt MANUFACTURE Asphalt Hot Mix Asphalt Construction Aggregate Concrete Recycling Ready Mix Concrete PRODUCTS Paving Prestress Roadway Signs & Guardrails Traffic Controls & Rentals Liquid Asphalt Aggregate Sales
46 BUSINESS DRIVERS 46 $1.4 State Construction Spending ($ in billions) $200 Grace Paving Historical Contracts ($ in millions) 100% $1.2 $175 90% $1.0 $0.8 $0.6 $0.4 Grace Paving Revenue ($ in millions) $150 $125 $100 $75 $50 AVERAGE MARKET SHARE 80% 70% 60% 50% 40% Market Share $0.2 $25 30% $0.0 $0 20% Source: Hawaii Department of Business, Economic, Development & Tourism (DBEDT) Data provided for informational purposes only; no endorsement implied. Contracts Market Share
")

47 GRACE BACKLOG 47 $250 $200 $215M Backlog ($ in millions) $150 $100 $50 $0 12/31/13 12/31/14 12/31/15 12/31/16 6/30/17
 $0 2008 2009 2010 2011 2012 2013 2014 2015 2016 1H17 0% Note: See appendix for a statement on management s use of non-gaap")
48 OPERATING RESULTS 48 EBIDTA ($ in millions) $50 $40 $30 $20 $10 Pre- A&B Ownership A&B Ownership EBITDA Margin $35.0M $18.4M 30% 20% 10% EBITDA Margin (%) $ H17 0% Note: See appendix for a statement on management s use of non-gaap financial measures and required reconciliations.
49 PUBLIC COMPANY COMPARABLES 49 MATERIALS Composition of Adjusted EBITDA* 8 public peers 11.1x mean EBITDA multiple Takeover premiums typical SPECIALTY CONSTRUCTION 5 public peers 7.8x mean EBITDA multiple Takeover premiums typical Specialty Construction 36% Materials 64% * Represents composition percentage for the trailing twelve month period.


50 BREAK 50
51 51 Land Operations Chris Benjamin President & CEO Alexander & Baldwin, Inc.

52 LAND OPERATIONS OVERVIEW 52 87,000 acres of Hawaii landholdings Conversion into recurring income streams Sales and reinvestment Development, sale and reinvestment Development for hold Adapt uses to provide recurring income Breadth of experience in execution


53 TRACK RECORD OF EXECUTION 53 Developing in Hawaii since 1949 Since 1990: 3,400 residential units in 33 projects 681,000 sf of CRE developed for the portfolio 6,100 acres of bulk raw land sales Farming since 1870


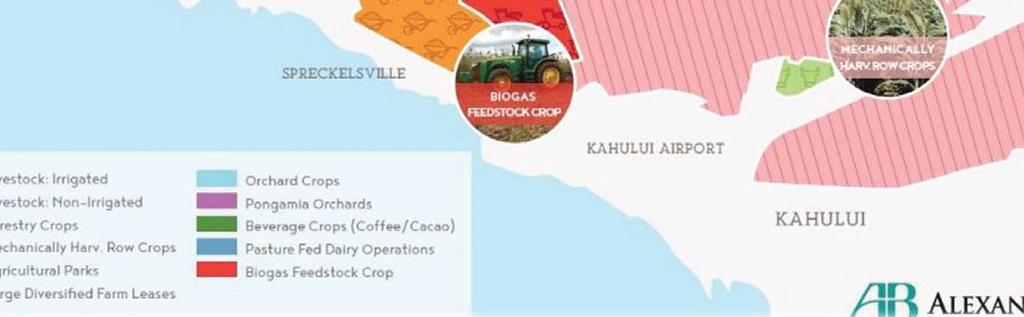

54 IMPLEMENTING DIVERSIFIED AG ON FORMER SUGARCANE LANDS 54


55 55 Development For Sale Lance Parker President A&B Properties
56 ACTIVE DEVELOPMENT FOR SALE PIPELINE Active pipeline of 1,500 for-sale residential and commercial units throughout Hawaii. 56 PROJECT LOCATION TYPE PLANNED UNITS/ ACRES STATUS CLOSING TIMING POSSIBLE VALUATION METHODS* K A H A L A A V E Honolulu, Oahu Residential 17 acres Sales BV+ CAP; DCF, DMA THE COLLECTION Honolulu, Oahu Primary residential 465 units Sales BV+ CAP; DCF, DMA KEALA O WAILEA Wailea, Maui Resort residential 70 units Development /Sales BV+ CAP; DCF, DMA KAMALANI Kihei, Maui Primary residential 170 units Development /Sales BV+ CAP; DCF, DMA K A M I L O THE RIDGE AT WAILEA MAUI BUSINESS PARK II KUKUI ULA Kona, Hawaii Wailea, Maui Kahului, Maui Poipu, Kauai Resort residential Resort residential Light industrial Resort residential 137 units 5 acres 125 acres 640 acres Development /Sales Development /Sales Development /Sales BV+ CAP; DCF, DMA Sales BV+ CAP; DCF, DMA BV+ CAP BV+ CAP * KEY: BV= Book value CAP= Remaining capital to be contributed DCF= Discounted cash flow analysis DMA= Discounted margin analysis


57 57 ARTIST RENDERING KEALA O WAILEA 70-unit low-rise, multi-family resort residential joint venture in Wailea, Maui
58 PROJECT FACTS (Updated 2Q17 Supplement Table 19 pg. 23) Location Project type Wailea, Maui Resort residential Estimated economic interest 65% +/- 5% Planned units 70 Average unit size (sf) 1,385 Units closed -- Units remaining 70 Targeted unit sales price psf $600-$1,000 Estimated total project cost $64M A&B projected capital commitment Total project costs incurred to date A&B gross investment (life to date) A&B net book value (current book value) at 6/30/17 $9M $40M $9M $9M Construction start/end Sales closing start/end ESTIMATE CASH FLOWS ($ in millions) TOTAL 2Q17 3Q17 4Q17 1Q18 2Q18 3Q18 4Q18 Revenue $ $12.9 $12.9 $12.9 $12.9 $12.9 $13.1 Selling expenses at 6% Remaining project costs Costs incurred to date Estimated cash flow VALUATION CASE STUDY: KEALA O WAILEA $4.7 - $(0.8) $(0.8) $(0.8) $(0.8) $(0.8) $(0.7) $ $(4.0) $(4.0) $(4.0) $(4.0) $(4.0) $(4.0) $40.0 $(40.0) $8.9 $(40.0) $8.1 $8.1 $8.1 $8.1 $8.1 $8.4 CASH FLOWS TO A&B ($ in millions) Return of A&B capital $9.0 NPV at 5%-10% $5.0 - $6.9 A&B s share at 65% $3.3 - $4.5 A&B s estimated value $ $


59 59 KUKUI ULA Luxury resort residential community joint venture project in Poipu, Kauai

60 60 Weiskopf-designed Championship Golf Course

61 61 World-Class Spa

62 62 Farm

63 63 Club Villa

64 64 Kainani Artist Rendering

65 65 Hale Nanea Artist Rendering
 $325M (main joint venture + residential development joint")
66 Kukui`ula Plantation House 66 DESCRIPTION LOCATION ACRES BOOK VALUE Luxury resort residential community joint venture project Poipu, Kauai 1,000 original (640 saleable) $325M (main joint venture + residential development joint ventures)


67 67 Landholdings Lance Parker President A&B Properties
 1,026 acres Kauai")

68 LANDHOLDINGS 68 Maui Total Acres 65,082 acres Conservation 15,848 acres Agriculture 48,208 acres Urban/Entitled (includes in process) 1,026 acres Kauai Total Acres* 21,198 acres Conservation 13,309 acres Agriculture 6,631 acres Urban/Entitled* 1,258 acres *Includes 917 acres contributed to the Kukui ula joint venture

69 HIGHER USE POTENTIAL LANDS 69

70 CORE AGRICULTURAL LANDS 70

71 SUPPORTING LANDS 71
72 AG-RELATED LAND CLASSIFICATIONS 72 FROM ORIGINAL 2Q17 SUPPLEMENT TABLE 17 PG. 24 MAUI KAUAI OAHU TOTAL CATEGORY ACRES Lands in the urban entitlement process Agricultural lands 48,208 6, ,914 Conservation & preservation 15,848 13, ,796 64,413 20, ,327 FROM UPDATED 2Q17 SUPPLEMENT TABLE 20 PGS MAUI KAUAI OAHU TOTAL CATEGORY ACRES Higher use potential 14,048 2, ,653 Core agricultural 31,589 4,145-35,734 Supporting and conservation 18,776 13, ,940 64,413 20, ,327
73 HIGHER USE POTENTIAL LAND SALES 73 A&B AG-ZONED LAND SALES DATA MAUI & KAUAI Q17 TOTAL ACRES SOLD WEIGHTED- AVG. PRICE PER ACRE HIGH LOW 0-5 acres 9 $114,750 $151,600 $84, acres 67 $75,900 $120,525 $35, acres 468 $28,650 $55,700 $13, acres 1,570 $25,800 $35,450 $14,600 Total/weighted-avg. 2,114 $28,400 $151,600 $13,750
74 UNDISCOUNTED RETAIL TAX ASSESSED VALUES 74 AGGREGATE 2017 TAX ASSESSORS VALUES ($ in millions) VALUE Higher use potential $325.4 Core agricultural Supporting and conservation 55.9 Total $768.0 PER ACRE AGGREGATE 2017 TAX ASSESSORS VALUES WEIGHTED-AVG. VALUE PER ACRE Higher use potential $19,540 Core agricultural 10,822 Supporting and conservation 1,697 Weighted-avg. tax assessors value per acre $9,001


75 URBAN-ZONED LAND 75 A&B URBAN-ZONED LAND (ACRES) NOT IN ACTIVE DEVELOPMENT/USE Developable, with full or partial infrastructure Developable, with limited or no infrastructure MAUI KAUAI TOTAL Other Total A&B URBAN-ZONED LAND SALES DATA MAUI & KAUAI Q17 TOTAL ACRES SOLD WEIGHTED- AVG. PRICE PER ACRE HIGH LOW 0-3 acres 10 $2,288,250 $4,346,200 $1,829, acres 57 $1,674,500 $2,288,250 $1,184,200 Total/weighted-avg. 67 $1,766,000 $4,346,200 $1,184,200
76 PV ASSOCIATED WITH LONG-TERM MONETIZATION STRATEGY 76 YEARS DISCOUNT RATE % 62% 51% 43% 10% 53% 41% 33% 12% 46% 34% 27% Table assumes an annual 3% escalation in values.


77 77 Financial Review Jim Mead Chief Financial Officer Alexander & Baldwin
78 FINANCIAL REVIEW 78 Supplement enhancements Deferred tax reversal Special Distribution Tax-advantaged pension contribution Components of value
79 CALCULATION OF CRE CASH NOI For the Quarter Ended June 30, TABLE 8 ($ in millions) Operating Profit 13.4 Plus: Depreciation and amortization 6.5 Less: Straight-line lease adjustments (0.5) Less: Lease incentive amortization - Less: Favorable/(unfavorable) lease amortization (0.8) Less: Termination income - Plus: Bad debt expense 0.3 Less: Other (income)/expense, net - Plus: Selling, general, administrative and other expenses 2.5 Cash NOI 21.4 Acquisitions / dispositions and other adjustments (1.6) Same-Store Cash NOI 19.8 Maintenance Capital Expenditures Building improvements 1.3 Tenant improvements 0.9 Leasing commissions 2.6 Total maintenance capital expenditures 4.8 Note: See appendix for a statement on management s use of non-gaap financial measures.
80 GROUND LEASES As of June 30, 2017, Except as Indicated ($ in millions) TABLE 12 GROUND LEASES LOCATION ACRES PROPERTY TYPE EXP. YEAR NEXT RENT STEP STEP TYPE ABR 80 2Q17 CASH NOI 1 Oahu 15.4 Grocery-Anchored Retail FMV Reset $2,100 $524 2 Oahu 2.8 Grocery-Anchored Retail FMV Reset 1, Maui 5.3 Medical Office Kailua 3.4 Grocery-Anchored Retail Fixed Step Maui 52 Heavy Industrial FMV Reset Kailua 3.7 Retail 2020 Option FMV Reset Kailua 1.6 Retail Kailua 2.2 Retail Fixed Step Oahu 0.5 Parking Oahu 0.5 Retail Oahu 1.2 Retail Maui 0.8 Retail Fixed Step Kailua 3.3 Office FMV Reset Maui 0.4 Office Maui 0.8 Industrial Fixed Step Kailua 0.9 Retail FMV Reset Maui 0.5 Retail Fixed Step Kailua 0.4 Retail Kailua 1.7 Retail - MTM Maui 0.4 Retail - MTM Remainder Various 18.3 Various Various Various Various 1,
81 DEFERRED TAX REVERSAL Liabilities as of June 30, ($ in millions) Current Liabilities: Notes payable and current portion of long-term debt $44.1 Accounts payable 32.2 Billings in excess of costs and estimated earnings on uncompleted contracts 3.1 Accrued interest 5.1 Deferred revenue 0.1 Indemnity holdback related to Grace acquisition 9.3 HC&S cessation-related liabilities 5.2 Accrued and other liabilities 29.1 Total current liabilities $128.2 Long-term Liabilities: Long-term debt $530.8 Deferred income taxes Accrued pension and post-retirement benefits 63.7 Other non-current liabilities 43.1 Total long-term liabilities $820.4 Total liabilities $948.6 Commitments and Contingencies Redeemable Noncontrolling Interest $10.8
82 DEFERRED TAX REVERSAL As of June 30, 2017 ($ in millions) 82 Components of deferred income tax liability, net REIT net deferred tax liability $232.2 TRS net deferred tax asset (49.4) Deferred income tax liability, net $182.8 Components of deferred income tax liability, net Basis difference for property and equipment $235.4 Deferred rent 6.0 Solar energy credit state (6.9) Other tax assets (2.3) REIT net deferred tax liability $232.2 Current estimate. Actual reversal not determined until results for 2017 are completed.


83 SPECIAL DISTRIBUTION 83 Purge pays out accumulated E&P Dividend of remaining 2017 and est REIT income $775M to $875M estimated range Declared in Q4 and paid in Q1 To be paid 80% stock and 20% cash NYSE to determine mechanics
84 TAX-ADVANTAGED PENSION CONTRIBUTION 84 ($ in millions) PRO FORMA IMPACT OF PENSION CONTRIBUTION AS OF JUNE 30, 2017 (AS REPORTED) PENSION CONTRIBUTION PRO FORMA Qualified defined benefit plans $52.9 $(48.0) $4.9 Non-qualified defined benefit plans Other post-retirement benefits Total accrued pension and post-retirement benefits $71.4 $(48.0) $23.4
85 COMPONENTS OF VALUE 85 Commercial Real Estate Materials & Construction Land Operations Active development Ag-related land Urban-zoned land


86 86 Closing Remarks Chris Benjamin President & CEO Alexander & Baldwin

 Added REIT director and")
87 ALIGNING CORPORATE GOVERNANCE 87 Shareholder meeting to approve entity merger and facilitate compliance with REIT requirements Amending articles and bylaws Unclassified board Majority voting provisions Incorporated in Hawaii (no MUTA-like ability to classify board via board action) Added REIT director and management


88 88 SUSTAINABILITY SOCIAL Committed to land stewardship and preservation of environment 147-year legacy of supporting and enhancing the communities where we live and work Invested in 3 of the state s largest energy facilities Decades of collaboration with non-profit organizations to preserve watersheds and manage conservation preserves Support organizations in five general categories: health and human services; education; community/civic, culture & arts; stewardship Nearly all contributions go to Hawaii-based organizations
89 STRATEGIC EVOLUTION 89 Long-term process to redefine A&B Started with Matson separation Continued with repatriation of capital to Hawaii Significant success to date in increasing focus on both Hawaii and commercial real estate Not yet a perfect REIT, but moving in the right direction Making necessary strategic, operational, financial and governance changes Valuable non-reit assets; will work to realize that value and evolve to a more traditional REIT at the appropriate pace Talent, experience, market knowledge and reputation in Hawaii are critical to strategic execution


90 90 ALEXANDER & BALDWIN Premier Hawaii Real Estate Company ANALYST DAY PRESENTATION QUESTIONS & ANSWERS
91 STATEMENT ON USE OF NON-GAAP FINANCIAL MEASURES 91 The Company presents the certain non-gaap financial measures in this presentation. The Company uses these non-gaap measures when evaluating operating performance because management believes that they provide additional insight into the Company s and segments' core operating results, and/or the underlying business trends affecting performance on a consistent and comparable basis from period to period. These measures generally are provided to investors as an additional means of evaluating the performance of ongoing core operations. The non-gaap financial information presented herein should be considered supplemental to, and not as a substitute for or superior to, financial measures calculated in accordance with GAAP. The Company s methods of calculating non-gaap measures may differ from methods employed by other companies and thus may not be comparable to such other companies. Required reconciliations of these non-gaap financial measures to the most directly comparable financial measure calculated and presented in accordance with GAAP are set forth in the following slides.
92 CRE CASH NET OPERATING INCOME 92 Cash Net Operating Income (Cash NOI) is a non-gaap measure used by the Company in evaluating the CRE segment s operating performance as it is an indicator of the return on property investment, and provides a method of comparing performance of operations, on an unlevered basis, over time. Cash NOI is calculated as total property revenues less direct property-related operating expenses. Cash NOI excludes straight-line rent adjustments, amortization of favorable/unfavorable leases, amortization of tenant incentives, general and administrative expenses, depreciation and amortization (including amortization of maintenance capital, tenant improvements and leasing commissions). In connection with the Company's decision to convert to a REIT in 2017, the Company has revised its definition of NOI to adjust Operating Profit for termination income, lease incentive amortization, and favorable/unfavorable lease amortization. We refer to amounts reported in this presentation under our new definition as "Cash NOI" to distinguish from the amounts previously reported under our prior definition. While there is no standard industry definition of NOI, the Company believes its revised definition is more closely aligned with current practices of other REITs. The Company s methods of calculating non-gaap measures may differ from methods employed by other companies and thus may not be comparable to such other companies.
93 CRE CASH NET OPERATING INCOME Reconciliation of GAAP to Non-GAAP Measures ($ in millions) 93 Six Months Ended June 30, 2017 CRE Operating Profit $27.7 Plus: Depreciation and amortization 13.1 Less: Straight-line lease adjustments (1.0) Less: Lease incentive amortization* - Less: Favorable/(unfavorable) lease amortization* (1.5) Less: Termination income* - Plus: Bad debt expense 0.3 Less: Other (income)/expense, net 0.1 Plus: Selling, general, administrative and other expenses 4.2 CRE Cash NOI $42.9 Acquisition/dispositions and other adjustments (3.3) CRE Same-Store Cash NOI $39.6 * Represent changes from prior definition of NOI Note: Additional information about NOI is included in the Company s quarterly Supplemental Information report, which is furnished to the SEC and available at
94 M&C EBITDA & ADJUSTED EBITDA 94 Earnings Before Interest, Taxes, Depreciation and Amortization (EBITDA) is a non-gaap measure used by the Company in evaluating the Materials & Construction segment's operating performance on a consistent and comparable basis from period to period. The Company provides this information to investors as an additional means of evaluating the performance of the Materials & Construction segment's ongoing operations. EBITDA is calculated for the Materials & Construction segment by adjusting segment operating profit (which excludes interest and tax expenses), by adding back depreciation and amortization. Adjusted EBITDA is calculated for the Materials & Construction segment by subtracting income attributable to noncontrolling interests from segment EBITDA. The Company s methods of calculating non-gaap measures may differ from methods employed by other companies and thus may not be comparable to such other companies.
95 M&C EBITDA & ADJUSTED EBITDA Reconciliation of GAAP to Non-GAAP Measures ($ in millions) 95 Six Months Ended June 30, TTM June 30, Year Ended December 31, Materials & Construction Operating Profit (excludes interest and taxes) $12.3 $22.7 $23.3 Depreciation and amortization Materials & Construction EBITDA $18.4 $34.6 $35.0 Income attributable to noncontrolling interest (1.3) (2.5) (1.8) Materials & Construction Adjusted EBITDA $17.1 $32.1 $33.2 Note: Additional information about Materials & Construction EBITDA is included in the Company s 2Q17 Updated Supplemental Information report, which is furnished to the SEC and available at
ALEXANDER & BALDWIN. May 8, 2018
 1 ALEXANDER & BALDWIN F I R S T Q U A R T E R 2 0 1 8 E A R N I N G S P R E S E N T A T I O N May 8, 2018 SAFE HARBOR STATEMENT 2 Statements in this call and presentation that are not historical facts
ALEXANDER & BALDWIN. Third Quarter 2017 Earnings Call. November 7, 2017
 1 ALEXANDER & BALDWIN Third Quarter 2017 Earnings Call November 7, 2017 SAFE HARBOR STATEMENT 2 Statements in this call and presentation that are not historical facts are forward-looking statements within
Alexander & Baldwin, Inc. PREMIER HAWAII REAL ESTATE COMPANY
 1 Alexander & Baldwin, Inc. PREMIER HAWAII REAL ESTATE COMPANY 1Q17 Earnings Call May 4, 2017 Disclosure 2 Statements in this call and presentation that are not historical facts, including potential benefits,
June 2018 VALUE PROPOSITION
 1 ALEXANDER & BALDWIN F i n a n c i a l C o m m u n i t y P r e s e n t a t i o n June 2018 VALUE PROPOSITION 2 High-quality CRE portfolio in robust market with embedded growth opportunities Underappreciated
ALEXANDER & BALDWIN, INC.
 Artist Rendering ALEXANDER & BALDWIN, INC. Third Quarter 2016 Operating & Financial Results October 27, 2016 DISCLOSURE Statements in this call and presentation that are not historical facts, including
Fourth Quarter & Full Year 2013 Operating & Financial Results February 20, 2014
 Fourth Quarter & Full Year 2013 Operating & Financial Results February 20, 2014 DISCLOSURE Statements in this presentation that are not historical facts are forward-looking statements, within the meaning
JMP Securities Financial Services and Real Estate Conference. Christopher J. Benjamin, President & Chief Operating Officer Alexander & Baldwin, Inc.
 JMP Securities Financial Services and Real Estate Conference October 1, 2013 Christopher J. Benjamin, President & Chief Operating Officer Alexander & Baldwin, Inc. DISCLOSURE Statements in this presentation
A Premier Hawaii Real Estate and Land Company
 A Premier Hawaii Real Estate and Land Company Third Quarter 2012 Q Operating and Financial Results November 8, 2012 DISCLOSURE Kai Malu Maui Mall 36,000-acre sugar plantation on Maui Statements in this
The Plantation House at Kukui ula. Financial Community Meetings May 13-17, 2013
 The Plantation House at Kukui ula Financial Community Meetings May 13-17, 2013 DISCLOSURE Waihonua Sales Office 36,000-acre Sugar Plantation Kai Malu Statements in this presentation that are not historical
A L E X A N D E R & B A L D W I N, I NC. S R E A L E S T A T E S U P P L E M E N T U P D A T E SECOND QUARTER (Unaudited)
") A L E X A N D E R & B A L D W I N, I NC. S R E A L E S T A T E S U P P L E M E N T U P D A T E SECOND QUARTER 2016 (Unaudited) About This Supplement Update This periodic Supplement Update is designed to
A L E X A N D E R & B A L D W I N, I NC. S R E A L E S T A T E S U P P L E M E N T U P D A T E SECOND QUARTER 2016 (Unaudited) About This Supplement Update This periodic Supplement Update is designed to
Carter Validus Mission Critical REIT, Inc. Reports Second Quarter 2016 Results
 Carter Validus Mission Critical REIT, Inc. Reports Second Quarter 2016 Results TAMPA, FL (September 1, 2016) - Carter Validus Mission Critical REIT, Inc. (the Company ) announced today its operating results
Retail Opportunity Investments Corp. Reports Strong First Quarter Results & Raises FFO Guidance
 April 27, 2016 Retail Opportunity Investments Corp. Reports Strong First Quarter Results & Raises FFO Guidance $17.4% increase in FFO Per Diluted Share 7.6% Increase in Same-Center Cash Net Operating Income
NEWS RELEASE For immediate release
 NEWS RELEASE For immediate release Laura Clark 904 598 7831 LauraClark@RegencyCenters.com Regency Centers Reports Second Quarter 2018 Results JACKSONVILLE, FL. (August 2, 2018) Regency Centers Corporation
Alexander & Baldwin, Inc. Real Estate Supplement As of and for the Years Ended December 31, 2015 and 2014 (unaudited)
") Alexander & Baldwin, Inc. Real Estate Supplement As of and for the Years Ended December 31, 2015 and 2014 (unaudited) ABOUT THIS SUPPLEMENT This periodic Supplement is designed to provide current and potential
Alexander & Baldwin, Inc. Real Estate Supplement As of and for the Years Ended December 31, 2015 and 2014 (unaudited) ABOUT THIS SUPPLEMENT This periodic Supplement is designed to provide current and potential
FOR IMMEDIATE RELEASE
 FOR IMMEDIATE RELEASE American Finance Trust Announces Second Quarter Operating Results New York, August 9, - American Finance Trust, Inc. (Nasdaq: AFIN) ( AFIN or the Company ), a real estate investment
FIRST INDUSTRIAL REALTY TRUST REPORTS FIRST QUARTER 2018 RESULTS
 First Industrial Realty Trust, Inc. 311 South Wacker Drive Suite 3900 Chicago, IL 60606 312/344-4300 FAX: 312/922-9851 MEDIA RELEASE FIRST INDUSTRIAL REALTY TRUST REPORTS FIRST QUARTER 2018 RESULTS Occupancy
Senior Housing Properties Trust Announces Fourth Quarter and Year End 2017 Results
 Senior Housing Properties Trust NEWS RELEASE Senior Housing Properties Trust Announces Fourth Quarter and Year End 2017 Results 2/27/2018 NEWTON, Mass.--(BUSINESS WIRE)-- Senior Housing Properties Trust
Clipper Realty Inc. Announces Third Quarter 2018 Results Reports Record Revenues, Income From Operations and Adjusted Funds From Operations
 Clipper Realty Inc. Announces Third Quarter 2018 Results Reports Record Revenues, Income From Operations and Adjusted Funds From Operations NEW YORK, November 1, 2018 /Business Wire/ -- Clipper Realty
Achieved record annual revenues of $110.0 million for 2018, representing an increase of 5.8%
 Clipper Realty Inc. Announces Fourth Quarter and Full-Year 2018 Results Reports Record Annual Revenues, Record Annual Income from Operations and Record Quarterly and Annual Adjusted Funds from Operations
Front Yard Residential Corporation Announces Transformative Acquisition and Reports Second Quarter 2018 Results
 Front Yard Residential Corporation Announces Transformative Acquisition and Reports Second Quarter 2018 Results August 9, 2018 CHRISTIANSTED, U.S. Virgin Islands, Aug. 09, 2018 (GLOBE NEWSWIRE) -- Front
Definitions. CPI is a lease in which base rent is adjusted based on changes in a consumer price index.
 Annualized Rental Income is rental revenue under our leases on Operating Properties on a straight-line basis, which includes the effect of rent escalations and any tenant concessions, such as free rent,
NEWS RELEASE For immediate release
 NEWS RELEASE For immediate release Laura Clark 904 598 7831 LauraClark@RegencyCenters.com Regency Centers Reports Third Quarter 2018 Results Company Increases 2018 Guidance JACKSONVILLE, FL. (October 25,
FIRST INDUSTRIAL REALTY TRUST REPORTS FIRST QUARTER 2019 RESULTS
 First Industrial Realty Trust, Inc. 1 North Wacker Drive Suite 4200 Chicago, IL 60606 312/344-4300 MEDIA RELEASE FIRST INDUSTRIAL REALTY TRUST REPORTS FIRST QUARTER 2019 RESULTS Signed 1.8 Million Square
2014 Operating and Financial Highlights
 FINANCIAL HIGHLIGHTS > 2014 Operating and Financial Highlights Operating Results Executed 203 leasing transactions representing approximately 2.8 million square feet, the highest gross leasing volume in
FOR IMMEDIATE RELEASE
 FOR IMMEDIATE RELEASE GLOBAL NET LEASE ANNOUNCES OPERATING RESULTS FOR SECOND QUARTER 2018 New York, August 8, 2018 Global Net Lease, Inc. (NYSE: GNL) ( GNL or the Company ), a real estate investment trust
Front Yard Residential Corporation Reports Third Quarter 2018 Results
 Front Yard Residential Corporation Reports Third Quarter 2018 Results November 7, 2018 CHRISTIANSTED, U.S. Virgin Islands, Nov. 07, 2018 (GLOBE NEWSWIRE) -- Front Yard Residential Corporation ( Front Yard
FOR IMMEDIATE RELEASE CONTACT: John Bucksbaum 312/ General Growth Properties, Inc. Reports Operating Results for the Third Quarter 2005
 News Release General Growth Properties, Inc. 110 North Wacker Drive Chicago, IL 60606 (312) 960-5000 FAX (312) 960-5475 FOR IMMEDIATE RELEASE CONTACT: John Bucksbaum 312/960-5005 Bernie Freibaum 312/960-5252
PS Business Parks, Inc. Reports Results for the Quarter Ended September 30, 2018
 News Release PS Business Parks, Inc. 701 Western Avenue Glendale, CA 91201-2349 psbusinessparks.com For Release: Immediately Date: October 23, 2018 Contact: Jeff Hedges (818) 244-8080, Ext. 1649 PS Business
Table of Contents Page
 Table of Contents Page Page Company, Common Stock, and Earnings Call Information 1 Debt Information Definitions 2-3 Debt Maturities 20 Financial Information Unsecured Public Debt Covenants 21 Balance Sheets
SEC Reg. G Compliance - Non-GAAP Financial Measures
 SEC Reg. G Compliance - Non-GAAP Financial Measures Funds From Operations (FFO) Reconciliation, Including Non-Cash Items 1 ($ in 000s, except per share amounts) Tentative Estimates Preliminary and Midpoint
INVESTOR PRESENTATION MAY 2013
 INVESTOR PRESENTATION MAY 2013 Forward-Looking Statements This presentation includes forward-looking statements. These statements are subject to a number of risks, uncertainties and other factors that
MARCH 2019 CITI 2019 GLOBAL PROPERTY CEO CONFERENCE
 MARCH 2019 CITI 2019 GLOBAL PROPERTY CEO CONFERENCE SAFE HARBOR This presentation contains forward-looking statements within the meaning of Section 27A of the Securities Act of 1933, and Section 21E of
NEWS RELEASE For immediate release
 NEWS RELEASE For immediate release Laura Clark 904 598 7831 LauraClark@RegencyCenters.com Regency Centers Reports First Quarter 2018 Results JACKSONVILLE, FL. (April 30, 2018) Regency Centers Corporation
Supplemental Information Package for Alexander & Baldwin, Inc. - Real Estate Leasing Segment. June 30, 2007 (Unaudited)
") Supplemental Information Package for Alexander & Baldwin, Inc. - Real Estate Leasing Segment June 30, 2007 (Unaudited) Alexander & Baldwin, Inc. Real Estate Leasing Segment Index to Supplemental Information
Supplemental Information Package for Alexander & Baldwin, Inc. - Real Estate Leasing Segment June 30, 2007 (Unaudited) Alexander & Baldwin, Inc. Real Estate Leasing Segment Index to Supplemental Information
WP Glimcher Reports Second Quarter 2016 Results
 NEWS RELEASE WP Glimcher Reports Second Quarter 2016 Results COLUMBUS, OH August 3, 2016 WP Glimcher Inc. (NYSE: WPG) today reported financial and operating results for the second quarter ended June 30,
FOR IMMEDIATE RELEASE
 FOR IMMEDIATE RELEASE GLOBAL NET LEASE ANNOUNCES OPERATING RESULTS FOR THIRD QUARTER 2018 New York, November 7, 2018 Global Net Lease, Inc. (NYSE: GNL) ( GNL or the Company ), a real estate investment
RESI Update 4 th Quarter 2016
 RESI Update 4 th Quarter 2016 Supplemental Investor Information George Ellison, CEO Robin Lowe, CFO 2017 Altisource Residential Corporation. All rights reserved. Forward Looking Statements This presentation
Highwoods Reports Third Quarter 2017 Results
 FOR IMMEDIATE RELEASE Ref: 17-20 Contact: Brendan Maiorana Senior Vice President, Finance and Investor Relations 919-431-1529 Highwoods Reports Third Quarter 2017 Results $0.55 Net Income per Share $0.86
PS Business Parks, Inc. Reports Results for the Quarter and Year Ended December 31, 2018
 News Release PS Business Parks, Inc. 701 Western Avenue Glendale, CA 91201-2349 psbusinessparks.com For Release: Immediately Date: February 20, 2019 Contact: Jeff Hedges (818) 244-8080, Ext. 1649 PS Business
Select Income REIT Announces Second Quarter Results
 July 28, 2014 Announces Second Quarter Results Generates Normalized FFO of $0.72 Per Share Increases Rental Rates for New and Renewal Leases by 21% and Hawaii Rent Resets by 30.9% Increases Occupancy to
Public Storage Reports Results for the Quarter Ended March 31, 2017
 News Release Public Storage 701 Western Avenue Glendale, CA 91201-2349 www.publicstorage.com For Release Immediately Date April 26, 2017 Contact Clemente Teng (818) 244-8080, Ext. 1141 Public Storage Reports
Q Financial Supplement October 2018
 Safe Harbor Statement Forward-Looking Statements - Certain statements in this presentation regarding anticipated financial outcomes including Rayonier s earnings guidance, if any, business and market conditions,
Highwoods Reports Third Quarter 2018 Results
 FOR IMMEDIATE RELEASE Ref: 18-18 Contact: Brendan Maiorana Senior Vice President, Finance and Investor Relations 919-431-1529 Highwoods Reports Third Quarter 2018 Results $0.32 Net Income per Share $0.86
NON-GAAP FINANCIAL MEASURES
 NON-GAAP FINANCIAL MEASURES Welltower Inc. (HCN) believes that revenues, net operating income from continuing operations (NOICO), net income and net income attributable to common stockholders (NICS), as
Extra Space Storage Inc. Reports 2018 Fourth Quarter and Year-End Results
 Extra Space Storage Inc. Reports 2018 Fourth Quarter and Year-End Results February 20, 2019 SALT LAKE CITY, Feb. 20, 2019 /PRNewswire/ -- Extra Space Storage Inc. (NYSE: EXR) (the "Company"), a leading
Highwoods Reports Second Quarter 2018 Results
 FOR IMMEDIATE RELEASE Ref: 18-14 Contact: Brendan Maiorana Senior Vice President, Finance and Investor Relations 919-431-1529 Highwoods Reports Second Quarter 2018 Results $0.49 Net Income per Share $0.87
4th Quarter Quarterly Supplemental
 Quarterly Supplemental 4th Quarter 2017 The Hub Hillcrest Market San Diego, CA Aventura Shopping Center Aventura, FL 4S Commons Town San Diego, CA Investor Relations irinfo@regencycenters.com One Independent
PS Business Parks, Inc. Reports Results for the Quarter Ended March 31, 2017
 News Release PS Business Parks, Inc. 701 Western Avenue Glendale, CA 91201-2349 psbusinessparks.com For Release: Immediately Date: April 25, 2017 Contact: Edward A. Stokx (818) 244-8080, Ext. 1649 PS Business
Extra Space Storage Inc. Reports 2017 Fourth Quarter and Year-End Results
 Extra Space Storage Inc. Reports 2017 Fourth Quarter and Year-End Results February 20, 2018 SALT LAKE CITY, Feb. 20, 2018 /PRNewswire/ -- Extra Space Storage Inc. (NYSE: EXR) (the "Company"), a leading
STAG INDUSTRIAL ANNOUNCES SECOND QUARTER 2018 RESULTS
 STAG INDUSTRIAL ANNOUNCES SECOND QUARTER 2018 RESULTS Boston, MA July 31, 2018 - STAG Industrial, Inc. (the Company ) (NYSE:STAG), today announced its financial and operating results for the quarter ended
DREAM GLOBAL ANNOUNCES FOURTH QUARTER RESULTS, 24% ANNUAL NET ASSET VALUE GROWTH AND OVER 6% FOURTH QUARTER COMPARATIVE NOI GROWTH
 DREAM GLOBAL ANNOUNCES FOURTH QUARTER RESULTS, 24% ANNUAL NET ASSET VALUE GROWTH AND OVER 6% FOURTH QUARTER COMPARATIVE NOI GROWTH TORONTO, FEBRUARY 20, 2019 DREAM GLOBAL REIT (TSX:DRG.UN, FRA:DRG) (or
Select Income REIT Announces Third Quarter 2017 Results
 FOR IMMEDIATE RELEASE Contact: Christopher Ranjitkar, Director, Investor Relations (617) 796-8320 Select Income REIT Announces Third Quarter 2017 Results Third Quarter Net Income of $0.35 Per Share Third
Highwoods Reports Third Quarter 2015 Results
 FOR IMMEDIATE RELEASE Ref: 15-22 Contact: Mark Mulhern Senior Vice President and Chief Financial Officer 919-875-6682 Reports Third Quarter 2015 Results $0.77 FFO per Share (Including $0.01 per Share of
TAUBMAN CENTERS ISSUES STRONG FIRST QUARTER RESULTS
 Taubman Centers, Inc. 200 East Long Lake Road Suite 300 Bloomfield Hills, Michigan 48304-2324 T 248.258.6800 www.taubman.com TAUBMAN CENTERS ISSUES STRONG FIRST QUARTER RESULTS - Comparable Center Net
SECURITIES AND EXCHANGE COMMISSION. Washington, D.C FORM 8-K CURRENT REPORT
 SECURITIES AND EXCHANGE COMMISSION Washington, D.C. 20549 FORM 8-K CURRENT REPORT PURSUANT TO SECTION 13 OR 15(d) OF THE SECURITIES EXCHANGE ACT OF 1934 Date of Report (Date of earliest event reported):
DCT INDUSTRIAL TRUST REPORTS FOURTH QUARTER AND FULL-YEAR 2017 RESULTS. Net Earnings of $0.22 per Diluted Share in Q4; $1.11 per Diluted Share in 2017
 Press Release FOR IMMEDIATE RELEASE: DCT INDUSTRIAL TRUST REPORTS FOURTH QUARTER AND FULL-YEAR 2017 RESULTS Net Earnings of $0.22 per Diluted Share in Q4; $1.11 per Diluted Share in 2017 FFO, as adjusted,
Great Elm Capital Group, Inc. An Introduction to the Fort Myers Transaction & GEC s Real Estate Strategy
 Great Elm Capital Group, Inc. An Introduction to the Fort Myers Transaction & GEC s Real Estate Strategy March 6, 2018 2018 Great Elm Capital Group, Inc. Disclaimer Statements in this presentation that
Report on 2018 Second Quarter Operating and Financial Results
 Report on 2018 Second Quarter Operating and Financial Results Forward-Looking Statements This press release includes "forward-looking statements." These statements are subject to a number of risks, uncertainties
PS Business Parks, Inc. Reports Results for the Quarter Ended March 31, 2018
 News Release PS Business Parks, Inc. 701 Western Avenue Glendale, CA 91201-2349 psbusinessparks.com For Release: Immediately Date: April 24, 2018 Contact: Maria R. Hawthorne (818) 244-8080, Ext. 1370 PS
Taubman Centers, Inc. Taubman/Starwood Capital Group Transaction
 Taubman Centers, Inc. Taubman/Starwood Capital Group Transaction June 18, 2014 Forward Looking Language and Use of Non-GAAP Measures For ease of use, references in this presentation to Taubman Centers,
2nd Quarter Quarterly Supplemental
 Quarterly Supplemental 2nd Quarter 2018 Roosevelt Square Seattle, WA Cameron Village Raleigh, NC Grand Ridge Plaza Issaquah, WA Village at Tustin Legacy Tustin, CA Shops at Erwin Mill Durham, NC Investor
Highwoods Properties Reports Third Quarter Results. $0.58 FFO per Diluted Share (Excluding Debt Extinguishment Loss and Property Acquisition Costs)
") FOR IMMEDIATE RELEASE Ref: 10-28 Contact: Tabitha Zane Vice President, Investor Relations 919-431-1529 Highwoods Properties Reports Third Quarter Results $0.58 FFO per Diluted Share (Excluding Debt Extinguishment
FOR IMMEDIATE RELEASE Ref: 10-28 Contact: Tabitha Zane Vice President, Investor Relations 919-431-1529 Highwoods Properties Reports Third Quarter Results $0.58 FFO per Diluted Share (Excluding Debt Extinguishment
3rd Quarter Quarterly Supplemental
 Quarterly Supplemental 3rd Quarter 2018 Mkt at Springwoods Village Spring, TX Calhoun Commons Minneapolis, MN Mellody Farm Vernon Hills, IL El Camino Shopping Center Woodland Hills, CA Mellody Farm Vernon
Senior Housing Properties Trust Announces Fourth Quarter and Year End 2018 Results
 Senior Housing Properties Trust NEWS RELEASE Senior Housing Properties Trust Announces Fourth Quarter and Year End 2018 Results 3/1/2019 Fourth Quarter Net Loss Attributable to Common Shareholders of $0.50
General Growth Properties, Inc.
 General Growth Properties, Inc. Supplemental Financial Information For the Three and Nine Months Ended September 30, 2009 This presentation contains forward-looking statements. Actual results may differ
Glendale, California - PS Business Parks, Inc. (AMEX: PSB), reported operating results for the fourth quarter and the year ending December 31, 2001.
, reported operating results for the fourth quarter and the year ending December 31, 2001.") News Release PS Business Parks, Inc. 701 Western Avenue P.O. Box 25050 Glendale, CA 91221-5050 www.psbusinessparks.com For Release: Immediately Date: January 30, 2002 Contact: Mr. Jack Corrigan (818) 244-8080,
News Release PS Business Parks, Inc. 701 Western Avenue P.O. Box 25050 Glendale, CA 91221-5050 www.psbusinessparks.com For Release: Immediately Date: January 30, 2002 Contact: Mr. Jack Corrigan (818) 244-8080,
2016 Financial Supplement February 2017
 Safe Harbor Statement Forward-Looking Statements - Certain statements in this presentation regarding anticipated financial outcomes including Rayonier s earnings guidance, if any, business and market conditions,
NAREIT Presentation June George Ellison, CEO Robin Lowe, CFO. welcome. home Front Yard Residential. All rights reserved.
 NAREIT Presentation June 2018 George Ellison, CEO Robin Lowe, CFO welcome home. 2018 Front Yard Residential. All rights reserved. 1 Forward-looking Statements This presentation contains forward-looking
AGREE REALTY CORPORATION REPORTS OPERATING RESULTS FOR THE SECOND QUARTER 2015
 FOR IMMEDIATE RELEASE CONTACT: Joey Agree Chief Executive Officer (248) 737-4190 AGREE REALTY CORPORATION REPORTS OPERATING RESULTS FOR THE SECOND QUARTER 2015 BLOOMFIELD HILLS, MI (July 27, 2015) - Agree
MARGARITAVILLE RESORT CASINO TRANSACTION OVERVIEW JUNE 19, 2018
 MARGARITAVILLE RESORT CASINO TRANSACTION OVERVIEW JUNE 19, 2018 DISCLAIMERS Forward-Looking Statements This presentation contains forward-looking statements within the meaning of the federal securities
PRICE REDUCED Koaha Place INSTUTIONAL QUALITY WAREHOUSE FOR SALE - WAREHOUSE WITH OFFICE SPACE KOAHA PLACE AIEA HAWAII 96701
 PRICE REDUCED 99-1379 Koaha Place INSTUTIONAL QUALITY WAREHOUSE FOR SALE - WAREHOUSE WITH OFFICE SPACE 99-1379 KOAHA PLACE AIEA HAWAII 96701 99-1379 Koaha Place Instutitional Quality Industrial Building
Listed on the New York Stock Exchange (KIM)
") Kimco Realty Reports Third Quarter 2017 Results Solid Operating Performance Leads Board to Approve Increase in Common Stock Dividend; Company Adds a New Signature Series Asset with the Acquisition of Whittwood
Kimco Realty Reports Third Quarter 2017 Results Solid Operating Performance Leads Board to Approve Increase in Common Stock Dividend; Company Adds a New Signature Series Asset with the Acquisition of Whittwood
Investor Presentation September 2017
 Investor Presentation September 2017 1 Table of Contents Company Overview & 2017 Guidance 3 6 Multifamily Fundamentals 7 11 Camden s Portfolio 12 22 Real Estate Transactions 23 29 Capital Structure & Liquidity
Highwoods Properties Reports Fourth Quarter and Full Year 2011 Results
 FOR IMMEDIATE RELEASE Ref: 12-06 Contact: Tabitha Zane Vice President, Investor Relations 919-431-1529 Highwoods Properties Reports Fourth Quarter and Full Year 2011 Results $0.70 FFO per Share for Fourth
FOR IMMEDIATE RELEASE: Equity One Reports Fourth Quarter and Year End 2014 Operating Results
 Equity One, Inc. For additional information: 410 Park Avenue, Suite 1220 Mark Langer, EVP and New York, NY 10022 Chief Financial Officer 212-796-1760 FOR IMMEDIATE RELEASE: Equity One Reports Fourth Quarter
SMARTCENTRES REAL ESTATE INVESTMENT TRUST RELEASES SECOND QUARTER RESULTS FOR 2018 AND ANNOUNCES DISTRIBUTION INCREASE
 SMARTCENTRES REAL ESTATE INVESTMENT TRUST RELEASES SECOND QUARTER RESULTS FOR 2018 AND ANNOUNCES DISTRIBUTION INCREASE TORONTO, ONTARIO - (August 9, 2018) SmartCentres Real Estate Investment Trust ("SmartCentres"
Industrial Income Trust Inc.
 UNITED STATES SECURITIES AND EXCHANGE COMMISSION Washington, D.C. 20549 FORM 8-K CURRENT REPORT Pursuant to Section 13 or 15(d) of The Securities Exchange Act of 1934 Date of Report (Date of earliest event
A&B: A Premier Hawaii Real Estate & Land Company June , 2012
 A&B: A Premier Hawaii Real Estate & Land Company June 18-22 22, 2012 1 Forward-Looking Statements Statements in this presentation that set forth expectations or predictions are based on facts and situations
Supplemental Information December 31, 2017
 Conference Call 888-632-3384 ID - EastGroup February 1, 2018 11:00 a.m. Eastern Standard Time webcast available at www.eastgroup.net Supplemental Information December 31, 2017 Alamo Ridge Business Park
Supplemental Information September 30, 2017
 Conference Call 888-632-3384 ID - EastGroup October 20, 2017 11:00 a.m. Eastern Daylight Time webcast available at www.eastgroup.net Supplemental Information September 30, 2017 Steele Creek Commerce Park
Investor Presentation November 2017
 Investor Presentation November 2017 1 Table of Contents Company Overview & 2017 Highlights 3 6 Multifamily Fundamentals 7 11 Camden s Portfolio 12 22 Real Estate Transactions 23 29 Capital Structure &
Strategic Storage Growth Trust, Inc. Reports 2018 Third Quarter Results
 FOR IMMEDIATE RELEASE Contacts Julie Leber Damon Elder Spotlight Marketing Communications Spotlight Marketing Communications 949.427.1391 949.427.1377 julie@spotlightmarcom.com damon@spotlightmarcom.com
Conference Call ID EastGroup October 19, :00 a.m. Eastern Time webcast available at EastGroup.net
 Table of Contents 2018 THIRD QUARTER Conference Call 877-876-9176 ID EastGroup October 19, 2018 11:00 a.m. Eastern Time webcast available at EastGroup.net Supplemental Information 2018 400 W. Parkway Place,
EastGroup Properties Announces Second Quarter 2018 Results
 EastGroup Properties Announces Second Quarter 2018 Results Contact: Marshall Loeb, President and CEO Brent Wood, CFO (601) 354-3555 Net Income Attributable to Common Stockholders of $.52 Per Share Compared
4th Quarter Quarterly Supplemental
 Quarterly Supplemental 4th Quarter 2018 Ballard Blocks Seattle, WA 4S Commons Town Center San Diego, CA Nocatee Town Center Ponte Vedra, FL Investor Relations irinfo@regencycenters.com One Independent
SAUL CENTERS, INC Wisconsin Avenue, Suite 1500, Bethesda, Maryland (301)
") May 3, 2018, Bethesda, MD. SAUL CENTERS, INC. 7501 Wisconsin Avenue, Suite 1500, Bethesda, Maryland 20814-6522 (301) 986-6200 Saul Centers, Inc. Reports First Quarter 2018 Earnings Saul Centers, Inc. (NYSE:
May 3, 2018, Bethesda, MD. SAUL CENTERS, INC. 7501 Wisconsin Avenue, Suite 1500, Bethesda, Maryland 20814-6522 (301) 986-6200 Saul Centers, Inc. Reports First Quarter 2018 Earnings Saul Centers, Inc. (NYSE:
Q2 18 Earnings Results
 July 26, 2018 Q2 18 Earnings Results (NYSE: SAFE) Forward-Looking Statements and Other Matters This release may contain forward-looking statements. All statements other than statements of historical fact
Supplemental Financial Information. For the Three and Twelve months Ended December 31, 2011
 For the Three and Twelve months Ended 2011 2901 Butterfield Road Oak Brook, Illinois 60523 Telephone: (630) 218-8000 Facsimile: (630) 218-7357 www.inlandrealestate.com For the Three and Twelve months Ended
PRIMARIS RETAIL REIT Announces Third Quarter Results
 PRIMARIS RETAIL REIT Announces Third Quarter Results Toronto (Ontario) November 8, 2011 Primaris Retail REIT (TSX:PMZ.UN) is pleased to report positive operating results for the third quarter of 2011.
FOR SALE :: FEE SIMPLE
 OFFERING MEMORANDUM HAWAII INVESTMENT OPPORTUNITY FOR SALE :: FEE SIMPLE 11-3968 Hale Ohia Road Volcano Village, Hawaii Tim Lee RA (RS-69814) Managing Director Investment Sales 808 369 1139 (Direct) 808
Comstock Holding Companies, Inc. NASDAQ: CHCI. New Business Model Update June 12, 2018
 NASDAQ: CHCI New Business Model Update June 12, 2018 DISCLAIMER This release includes "forward looking" statements that are made pursuant to the safe harbor provisions of the Private Securities Litigation
SAUL CENTERS, INC Wisconsin Avenue, Suite 1500, Bethesda, Maryland (301)
") SAUL CENTERS, INC. 7501 Wisconsin Avenue, Suite 1500, Bethesda, Maryland 20814-6522 (301) 986-6200 Saul Centers, Inc. Reports Third Quarter 2016 Earnings November 1, 2016, Bethesda, MD. Saul Centers, Inc.
SAUL CENTERS, INC. 7501 Wisconsin Avenue, Suite 1500, Bethesda, Maryland 20814-6522 (301) 986-6200 Saul Centers, Inc. Reports Third Quarter 2016 Earnings November 1, 2016, Bethesda, MD. Saul Centers, Inc.
SITE CENTERS NOVEMBER 2018
 SITE CENTERS NOVEMBER 2018 JOINT VENTURE WITH CHINESE INSTITUTIONAL INVESTORS $607MM JOINT VENTURE ALLOWS SITE CENTERS TO ACCELERATE OPPORTUNISTIC INVESTING AND FURTHER IMPROVE THE BALANCE SHEET Dividend
-- Expanding relationship with Brookdale by creating a $1.2 billion CCRC joint venture and amending existing Emeritus leases
 Page 1 of 11 Print Page Close Window News Release HCP Announces Results for Quarter Ended March 31, 2014 HIGHLIGHTS -- FFO per share was $0.75; FAD per share was $0.63; and EPS was $0.56 -- Achieved year-over-year
January 23, NEW YORK--(BUSINESS WIRE)--Jan. 23, SL Green Realty Corp. (NYSE: SLG): Financial and Operating Highlights
--Jan. 23, SL Green Realty Corp. (NYSE: SLG): Financial and Operating Highlights") SL Green Realty Corp. Reports Fourth Quarter Loss Per Share of $0.73; Full Year 2018 Earnings Per Share of $2.67; Fourth Quarter and Full Year 2018 FFO of $1.61 and $6.62 Per Share January 23, 2019 NEW
SL Green Realty Corp. Reports Fourth Quarter Loss Per Share of $0.73; Full Year 2018 Earnings Per Share of $2.67; Fourth Quarter and Full Year 2018 FFO of $1.61 and $6.62 Per Share January 23, 2019 NEW
SAUL CENTERS, INC Wisconsin Avenue, Suite 1500, Bethesda, Maryland (301)
") SAUL CENTERS, INC. 7501 Wisconsin Avenue, Suite 1500, Bethesda, Maryland 20814-6522 (301) 986-6200 October 29, 2015, Bethesda, MD. Saul Centers, Inc. Reports Third Quarter 2015 Earnings Saul Centers, Inc.
SAUL CENTERS, INC. 7501 Wisconsin Avenue, Suite 1500, Bethesda, Maryland 20814-6522 (301) 986-6200 October 29, 2015, Bethesda, MD. Saul Centers, Inc. Reports Third Quarter 2015 Earnings Saul Centers, Inc.
NEWS RELEASE For immediate release
 NEWS RELEASE For immediate release Laura Clark 904 598 7831 LauraClark@RegencyCenters.com Regency Centers Updates 2017 and Introduces 2018 Earnings Guidance JACKSONVILLE, Fla. (January 11, 2018) Regency
FIRST QUARTER Supplemental Operating and Financial Data. Camden Sotelo - Tempe, AZ
 FIRST QUARTER 2014 Supplemental Operating and Financial Data Camden Sotelo - Tempe, AZ Camden Las Olas - Ft. Lauderdale, FL Year Built - 2004 420 Apartment Homes 97% Average 1st Quarter 2014 Occupancy
Our Objectives. Our Strategy
 2005 Third Quarter Report» Management s Discussion and Analysis Management s Discussion and Analysis This Management s Discussion and Analysis has been dated as at November 3, 2005. All dollar amounts
SAUL CENTERS, INC Wisconsin Avenue, Suite 1500, Bethesda, Maryland (301)
") SAUL CENTERS, INC. 7501 Wisconsin Avenue, Suite 1500, Bethesda, Maryland 20814-6522 (301) 986-6200 Saul Centers, Inc. Reports Third Quarter 2017 Earnings November 2, 2017, Bethesda, MD. Saul Centers, Inc.
SAUL CENTERS, INC. 7501 Wisconsin Avenue, Suite 1500, Bethesda, Maryland 20814-6522 (301) 986-6200 Saul Centers, Inc. Reports Third Quarter 2017 Earnings November 2, 2017, Bethesda, MD. Saul Centers, Inc.