2020 AFFORDABLE HOUSING PLAN
|
|
|
- Jessie Nash
- 6 years ago
- Views:
Transcription


1 THE TOWN OF CARY 2020 AFFORDABLE HOUSING PLAN R Y, N O R T H C A R O L I C A N A 1871 Prepared by the Town of Cary Planning Department Adopted by Town Council on October 28, 2010
2 ACKNOWLEDGEMENTS Town of Cary Council Harold Weinbrecht, Jr., Mayor Julie A. Robin, Mayor Pro-Tem Gale Adcock Don Frantz Ervin Portman Jennifer Robinson Jack Smith Planning and Zoning Board Kelly Commiskey, Chair Harry Baulch Brent Miller Michelle Muir Hari Nath Julia Rudy Carla Sadtler John Shaw Al Swanstrom Town of Cary Staff Benjamin T. Shivar, Town Manager Jeff Ulma, Planning Director Plan Development Philip Smith, Manager, Long-Range Planning Tracy Stone-Dino, Senior Planner, Housing & Community Development Team Input Juliet Andes, Principal Planner Amy Cole, Wake County Shawn McNamara, City of Raleigh Michael Lassiter, Stakeholder Committee Howard Manning, Stakeholder Committee Brenda Monroe, Stakeholder Committee Mark Newman, Stakeholder Committee Consultant: Dr. Ernest Swiger, Swiger Consulting, Inc.
3 TABLE OF CONTENTS I. Introduction A. Background B. Methodology C. Data Sources D. Determining a Community s Housing Needs E. Defining and Measuring Housing Affordability F. Affordability Indices II. Housing Demand Analysis A. Background B. The Local Economy C. Employment Base and Leading Occupations D. Calculating Housing Demand E. Key Housing Demand Findings III. Housing Supply Analysis A. Background B. Housing Inventory C. Housing Occupancy and Vacancies D. Key Housing Supply Findings IV. Housing Affordability Analysis A. Defining Affordability B. Housing Prices and Rents C. Other Housing Supply Issues D. Key Housing Affordability Findings V. Affordable Housing Strategies A. Background B. Recommendations Recommendation 1 Recommendation 2 Recommendation 3 Recommendation 4 C. Conclusion
4 Appendix A: Town of Cary ZIP Code Maps
5 I. Introduction A. Background The Cary Town Council adopted the existing Town of Cary Affordable Housing Plan on May 11, The Plan was the result of a community-wide effort to assess the potential adverse impacts of the high level of growth and development that occurred since the 1980s on the accessibility and affordability of housing in the community. In 1998, the Town commissioned a Growth Management Task Force to examine the impacts. Cary s Growth Management Task Force issued a report in May 1998 that recognized that the escalating price of housing was excluding many people from living within the city limits of Cary including Town staff, policemen, teachers, retail clerks, and service people. The following goal was included in the Affordable Housing Committee section of the report: The Town Council desires to balance the population of Cary via an Affordable Housing initiative and perceives the following benefits of increasing the inventory of affordable housing: Promote social-economic diversity within our citizens Provide a ready inventory of employees for local employers Promote racial and ethnic diversity within our citizens Provide different economic levels of housing within our community Increase longevity of employment by enabling employees to live closer to work Ensure there are viable housing alternatives for Town employees within the town limits. The Town Council recognized the added value and benefits of providing affordable housing options for many citizens living and working within the town limits of Cary. Based on a population and housing needs assessment the Task Force recommended the development of an Affordable Housing Plan to Town Council. The Plan included an analysis of the Town of Cary s housing market, goals, and strategies to preserve and create affordable housing. Since the adoption of the Plan in 2000, the Town of Cary has since made considerable strides towards preserving and creating affordable housing for low- and moderate-income individuals and families. However, further appreciation in housing values since 2000 have significantly limited housing opportunities for many of Cary s working residents. The 2020 Cary Affordable Housing Plan provides an update of the Town of Cary s housing market and affordable housing needs along with short- and long-term strategies to address the creation of additional, sustainable affordable housing opportunities for Town residents. The proposed affordable housing strategies of the 2020 Cary Affordable Housing Plan build on many of the goals and strategies initially proposed in the 2000 Plan. The aim of the 2020 Plan is to provide the Town of Cary with a package of workable strategies from a comprehensive policy, funding and programmatic standpoint. This document contains an updated Affordable Housing Plan, including a set of goals, appropriate strategies, and specific implementation measures. B. Methodology The methodology employed for the 2020 Cary Affordable Housing Plan involved a housing market analysis of the Town of Cary and surrounding Wake County to determine the key housing demand and supply factors and conditions that impact short- and long-term affordability. The study team conducted a series of interviews with Town officials and a community stakeholders group to gain a general overview and understanding of the Town s evolving housing market with specific focus on the eight years since the adoption of the 2000 Plan. The study team then conducted a review of existing Town housing and planning
6 documents, including the 2000 Town of Cary Affordable Housing Plan, Consolidated Housing and Community Development Plan, FY 2004 FY 2009 and Town of Cary Land Development Ordinance. The housing market analysis and short- and long-term strategies included the following components: 1. Affordable Housing Demand Analysis: This section provides an analysis of the regional and local economy to determine the levels of affordable housing needs in the Town of Cary; 2. Affordable Housing Supply Analysis: This section provides an analysis of the key housing supply factors and conditions that impact housing affordability and accessibility in the Town of Cary; 3. Housing Affordability Analysis: This section extrapolates the key data findings from the housing demand and supply sections to determine the levels of housing affordability in the Town of Cary. 4. Affordable Housing Strategies: This section provides a comprehensive package of affordable housing policy, funding, and program strategies based on best practice research. C. Data Sources The primary data sources for the 2020 Cary Affordable Housing Plan included the U.S. Census, 2007 and American Community Surveys (ACS), the 2008 North Carolina Department of Commerce, Economic Development Intelligence System (EDIS), Realtor.com, Rent.com and Realtytrac.com. Other sources included the 2008 Triangle Area Residential Realty (TARR) Report and local newspapers. D. Determining a Community s Housing Needs A basic premise of all housing markets is the need to create and maintain a spectrum of housing choice and opportunity for local residents. This axiom establishes that housing choice and needs differ within community settings due to a variety of factors including: household income, population age, proximity of employment, and personal preference. A spectrum of rental housing choice and opportunity is particularly important as an adequate supply of affordable rental housing provides choice and opportunity to working individuals and families with more modest incomes. Prior studies have established that these families and individuals comprise a significant percentage of the Town of Cary s resident population. A number of housing studies in recent years have shown a clear correlation between workforce housing demand and transportation costs. The critical link between housing and transportation costs has significant implications with respect to housing choice and affordability. Housing and transportation costs can severely limit a working household s choice in terms of both housing and job location. Unfortunately, for many working households limited choice in terms of housing affordability has created mounting transportation expenditures. Statistics show that development patterns have significantly increased commute times. For example, Town of Cary workers who commute 60+ minutes to their place of employment increased by 38 percent between 2000 and The Town s aggregate commute time increased by 26 percent during this period.
7 E. Defining and Measuring Housing Affordability Housing Affordability is generally defined as the capacity of households to consume housing services and, specifically, the relationship between household incomes and prevailing housing prices and rents. The standard most frequently used by various units of government is that households should spend no more than 30 percent of their income on housing costs. This is the standard definition for housing programs administered by the Department of Housing and Urban Development (HUD) and most state housing agencies. However, this definition has its limitations because of the inability to determine whether households spend more than 30 percent of their income on housing due to necessity or by choice. Specifically, the definition does not consider that upper income households are able to afford spending far above 30 percent of their incomes on housing and still have sufficient income left over to satisfy other basic needs; whereas low income households that pay only 10 percent of their incomes on housing costs may be forced to forgo essential medical care and healthy food (The Brookings Institution, 2002). Therefore, it is important to develop a clear understanding of the demand for housing based on local employment and wages and the supply of housing based on workforce affordability and accessibility. F. Affordability Indices One measure of housing affordability is the cost of homeownership, commonly conveyed through housing affordability indices. These indices generally indicate that affordability increased substantially toward the end of the last decade, primarily because of lower interest rates during that period. A housing affordability index for an area brings together the price and the income elements that contribute to housing affordability. While housing affordability indices are useful tools, they typically examine affordability only from an ownership perspective. For households of lower income in a rapidly appreciating housing market, rent price increases have far exceeded growth in incomes, deepening the housing affordability problem. The following describes the most recognized affordability indices: Median House Price-to-Income Ratio The median house price-to-income ratio used by the National Association of Realtors and other housing analysts is a key economic indicator in assessing local market trends and vitality. The index compares the median sales price of an existing single-family home to the median household income in a given market. Ideally, a community s ratio should not exceed 3:1. Nationally, the median house price-to-income ratio has more than tripled in the past five years in many high priced metropolitan markets, including New York City, Boston, Los Angeles, and Miami. National Association of Realtors (NAR) Index The most common index is that produced by the National Association of Realtors (NAR). The NAR index measures the ability of the median income household in an area to afford a median priced house. In addition to the median income and median house price in an area, the NAR index considers current mortgage interest rates, assumptions about the down payment required to purchase the median price home, and the maximum percentage of household income that can be spent on housing. An index of 100 indicates the typical (median) family in the area has sufficient income to purchase a single-family home selling at the median price. Housing and Transportation Affordability Index
8 The Housing and Transportation Affordability Index, aka Affordability Index, evolved from research on the Location Efficient Mortgage (LEM) developed by the Centers for Neighborhood Technology and Transit Oriented Development. This Affordability Index calculates the sum of average housing costs plus the average transportation costs for a neighborhood divided by average neighborhood income. Total housing costs equal current housing sales prices and rents, and total transportation costs equal the sum of the costs for auto ownership, auto use, and transit. The Affordability Index would calculate the affordability of a home based on its market value and the transportation cost incurred by its location. Nationally, transportation is the second largest household expenditure after housing. Transportation expenditures range from 10 percent of the average household s expenditures in transit-rich areas to 25 percent in more auto dependent areas of the country. The Brookings Institution has calculated that the average U.S. household spends 19 percent of its budget on transportation. 1 Rising transportation costs have especially significant impacts on the rental housing market. The location of affordable rental housing is particularly relevant as proximity to job centers and public transportation is vital to low and moderate income renters who may already be costburdened. II.Housing Demand Analysis A. Background This section provides a housing demand analysis of the Town of Cary based on industry, occupational wages, and household income. Housing demand is largely determined by ongoing and planned economic development activities that result in sustained and expanded employment opportunities. Employment growth occurs through the retention and expansion of existing establishments and new economic growth resulting from start-ups, spin-offs, and relocations to the Town of Cary and surrounding area of Wake County. Populations follow jobs and the demand for workforce housing can be determined by the location, occupation types, and wage levels of Wake County s major employment sectors. Significantly, all communities contain both a resident workforce and a commuter workforce. An understanding of the composition and varying demands of both is critical to an effective affordable housing plan. B. The Local Economy In order to effectively develop affordable housing policies and strategies that address the demand for workforce affordable housing, it is important to first understand the spatial dimension of the regional economy and its effect on the Town of Cary. The first step is to 1 The Brookings Institution, Urban Markets Initiative, Market Innovation Brief, January 2006.
9 determine the labor market area (LMA). The Bureau of Labor Statistics (BLS) designates these LMAs in reporting key employment and unemployment data. LMAs are intended to capture economic integration, which is determined by population density and commuting patterns. Within a defined LMA, workers can generally change their jobs without changing their places of residence. Once the LMA is defined, planners and policy makers must consider the critical relationship between housing supply and demand and the dynamics of the local economy and labor market. Local or regional economies defined by labor markets are fairly structured and have a certain level of geographic arrangement that relates to housing supply and demand. A spectrum of housing choice and opportunity within close commuting distance of employment centers helps create and support sustainable local economies. C. Employment Base and Leading Occupations An economic analysis of the Town of Cary and surrounding labor market area of Wake County indicates that the local economy is comprised of four major industries: 1) Retail Trade, 2) Professional and Technical Services, 3) Accommodation and Food Services, Health Care and Social Assistance, and 4) Administrative and Waste Services. Together, these industries comprise 48 percent of Wake County s private sector employment base. Government, though not included in the private sector employment base, is the second largest employer (41,297 employees) in Wake County. Table 1 Wake County Leading Industries by Employment, 2007 Employees Establishments Total, All Industries 408,225 27,847 Retail Trade 50,999 2,912 Government 41, Professional and Technical Services 37,565 4,351 Accommodation and Food Services 36,295 1,676 Health Care and Social Assistance 35,835 2,007 Administrative and Waste Services 35,587 1,806 Source: North Carolina Department of Commerce, EDIS, 2008 Wake County s leading occupations are reflective of the industrial base. Office and Administrative Support (52,185 employees) is the leading occupation, followed by Management (49,244 employees), and Sales & Related (48,292 employees) occupations. Employment projections through the Year 2012 for Wake County, provided by the North Carolina Department
10 of Commerce, show continued growth in many of the same industries that comprise the existing economic base. Office and Administrative Support (9,077 employees) is projected to have the largest occupational growth followed by Sales & Related (8,887 employees), and Management (8,166 employees) occupations. Significantly, there are substantial differences in the annual salaries and wages of Wake County s leading industries and the occupations that comprise these industries. According to the North Carolina Department of Commerce, two of the top three occupations (Office/Administrative Support, and Sales/Related), which constitute 34 percent of the workforce, earn less than $30,000 annually and four of the eight occupations shown earn $40,000 or less. Table 2 shows current and projected employment and the 2007 Annual Salary or Wage. Table 2 Wake County Leading Occupations by Employment and Income, 2007/2012 # of Workers Occupation Occupation Growth % Growth Annual Wage/Salary Office/Administrative Support 52,185 61,262 9,077 17% $29,172 Management 49,244 57,410 8,166 17% $68,432 Sales/Related 48,292 57,179 8,887 18% $26,832 Computer and Mathematical 26,911 33,763 6,852 25% $68,692 Business/Financial 26,895 34,201 7,306 27% $64,116 Construction 25,094 27,433 2,339 9% $47,060 Education/Training/Library 24,715 30,334 5,619 23% $32,760 Health Care Practitioner/Technician Occupations 20,023 24,250 4,227 21% $40,872 Source: North Carolina Department of Commerce, EDIS, 2008 Though these figures are for Wake County, Cary s leading industries and occupations somewhat mirror those of the County. As shown on Table Three below, the leading
11 occupations of Cary s working residents include: Management (10,313 employees), Sales & Related (7,929 employees) and Office and Administrative Support (6,691 employees). These occupations include the full spectrum of annual wages and salaries ranging from $26,832 for employment in Sales & Related, to $68,692 for employment in Computers and Mathematics. Table 3 Town of Cary Leading Occupations by Employment and Income, 2007 Occupation # of Workers 2007 Annual Wage/Salary Management 10,313 $68,432 Sales/Related 7,929 $26,832 Office/Administrative Support 6,691 $29,172 Computer and Mathematical 6,135 $68,692 Business/Financial 5,947 $64,116 Construction 2,272 $47,060 Source: U.S. Census, American Community Survey It should be noted that the two lowest paying occupations make up 37 percent of the workforce. A further extrapolation of leading occupations shows that 19.4 percent of Cary s working residents are employed in Education and Healthcare. As shown in Table 2 above, the median annual wage/salary of these occupations ranges from $32,760 to $40,872. It is useful to translate these figures into terms that audiences can readily grasp. Table 4 below identifies a number of occupations in these broader categories and shows their typical wage and the income category for each. A Low Income household is abbreviated as LI and Very Low Income as VLI. These household income categories will be defined in greater detail below. Job Title Table 4 Average Wages of Leading Occupations Wake County, 2008 Estimated Average Wage (Hourly) Estimated Yearly Earnings (40 hours/week Income Category Veterinary Asst. $8.97 $18, VLI Home Health Aide $10.11 $21, VLI Child Care Worker $10.28 $21, VLI Retail Sales Clerk $11.38 $23, VLI Travel Agent $15.44 $32, LI Hair Dresser $16.94 $35, LI Dental Assistant $18.07 $37, LI Fitness Trainer $18.46 $38, LI
12 Source: NC Occupational Employment and Wages, Wake County, 2008 Also, figures show that at present most of the workers in these types of occupations are commuting to Cary already. Table 5 below, based on Dun and Bradstreet figures for the Town, show the degree to which Cary relies on persons from out-of-town to fill lower wage jobs. Table 5 Commuting of Leading Occupations Industry Resident Population Employed in Cary Construction Retail Transportation Arts & Entertainment and Food Services Other Services Source: Dun and Bradstreet, 2008 Even if all of the resident workers in these categories were employed in Cary, a considerable number of persons still commute to the Town for employment. Though some percentage of workers will always commute, it is generally more desirable to live close to one s work for both cost and convenience. If employees in these household income categories and occupations are not able to find housing in Cary, they will be forced to look elsewhere for not only housing, but just as likely for new jobs. Workers, especially those in lower paying positions are only willing, or able, to bear the cost and loss of time in commuting to a certain point. At the same time, these commuters add to traffic congestion and air pollution concerns. Also, from an economic standpoint, replacing these workers will cost more in the form of higher wages, and thus increasing prices for goods and services. While many of Cary s residents do earn wages or have salaries that are relatively high, and give the Town high income figures in statistical tables and presentations, these high salaries mask the fact that a considerable percentage of workers in Cary are employed in relatively low wage positions. This creates significant affordable housing demand issues for many of Cary s working residents. D. Calculating Housing Demand As previously noted, the level of workforce housing demand is largely determined by job growth and retention. The affordability component of workforce housing demand, however, is based on local wages and salaries that are then translated into household income. The previous industry and occupational analysis shows that the economic base of both Wake County and the Town of Cary is comprised of a mix of high-paying employment in Professional and Technical Services and low-paying employment found in Retail Trade and Administrative and Waste Services. The range of occupations and annual salaries/wages within specific industries is a critical factor in
13 determining workforce-housing demand. This is because annual salaries and wages determine annual household income and level of housing affordability. The Town of Cary has a relatively high Median Household income as shown in Table 6. Table 6 Comparison of Median Household Incomes, 2007 Cary Wake North Carolina US Median HH Income $89,702 $61,554 $44,670 $50,740 Source: U. S. Census, American Community Survey The figure of $89,702 is double that of the state, and one and one-half times the US figure. A high-income level speaks well for the economy of the area, but places significant pressure on those not earning a high income. As noted, the mix of industries, occupations, and salaries/wages results in the Town of Cary s varied mix of household incomes (Table 7 below). Approximately one-third (30 percent) of Cary s households earn greater than 150 percent ($134,533) of the Town s current annual median household income of $89,702. However, 38 percent of Cary s households earn less than $71,763 annually (classified as Moderate Income) and 24 percent less than $44,851 (50 percent of median, which is defined as Low Income). Significantly, a total of 16,841 Town of Cary households earn less than 80 percent of the annual median income, that is, they are Moderate to Low Income Households. Table 7 Town of Cary Household Income Categories Median HH Income = $89,702 Household Income Estimated # of HHs Estimated % of Total HHs Category Very Low Income 4,823 11% <30 percent of median (<$26,911) Low Income 5,612 13% percent of median ($26,912-$44,851) Moderate Income 6,406 14% percent of median ($44,852-$71,762) Middle Income 8,037 18% percent of median ($71,763-$107,642) Above Middle Income 6,355 14% percent of median ($107,643-$134,553) Upper Income 13,330 30% 151+ percent of median ($134,554-$200,000+) Total Households 44, %
14 Source: U.S. Census, 2007 American Community Survey Low and moderate income working households are especially impacted by high housing costs as housing choice and opportunity become more limited. The level of impact can be readily determined by calculating the growth in cost-burdened households (households paying 30 percent of more on housing costs). According to the 2007 American Community Survey (ACS), the percentage of the Town of Cary s low and moderate-income households that are costburdened has grown significantly. The percentages are particularly striking for those households (owner and renter) earning less than $50,000 annually (Table 8 below). Significantly, nearly all households (94 percent) earning less than $20,000 are cost-burdened. Table 8 Town of Cary Housing Costs as Percentage of Household Income 2007 Total Households Owner-Occupied Households Renter-Occupied Households TOTAL 44,563 31,260 13,303 Less than $20,000: 2, ,194 Less than 20 percent to 29 percent percent or more 1, ,194 Percent cost-burdened 94% 86% 100% $20,000 to $34,999: 5,187 1,716 3,471 Less than 20 percent to 29 percent 1, , percent or more 2, ,199 Percent cost-burdened 58% 47% 63% $35,000 to $49,999 3,952 2,059 1,893 Less than 20 percent to 29 percent 1, percent or more 1, Percent cost-burdened 38% 43% 32% $50,000 to $74,999 6,749 4,327 2,422 Less than 20 percent 3,227 1,771 1, to 29 percent 2,552 1, percent or more Percent cost-burdened 14% 17% 10% $75,000 or more 25,681 22,130 3,551 Less than 20 percent 17,254 14,564 2, to 29 percent 6,554 5, percent or more 1,873 1, Percent cost-burdened 7% 8% 3% Source: U.S. Census, American Community Survey, 2007
15 E. Key Housing Demand Findings Town of Cary/Wake County labor market area (LMA) largely comprised of five major industries Retail Trade, Professional Services, Accommodation and Food Services, Healthcare and Social Assistance, and Administrative and Waste Services, along with Government; Employment projections by the North Carolina Department of Commerce for Wake County show continued growth in many of the same industries that comprise the existing economic base through the Year 2012; Town of Cary s leading occupations, including range of salaries and wages, are reflective of the industrial base; Two of the top three occupations (Office/Administrative Support and Sales/Related) earn less than $30,000 annually; Approximately one-third (30 percent) of Cary s households earn greater than 150 percent of the Town s current median household income or more than $134,533 annually; However, 38 percent of Cary s households earn less than $71,763 annually and 24 percent less than $44,852 (50 percent of median); According to the 2007 ACS, the percentage of the Town of Cary s low and moderate income households that are cost-burdened has become significant; The percentages are particularly striking for those households (owner and renter) earning less than $50,000 annually; Nearly all households (94 percent) earning less than $20,000 are cost burdened. Thus, there is a significant demand/need for affordable housing in Cary. Over 45 percent of the jobs held by Cary residents are in occupations that place these people in the Moderate, Low, and Very Low Income categories (earning less than $71,763 per year). The percentage of Cary moderate and low-income households that are cost burdened is significant, especially among the Very Low Income households.
16 III. Housing Supply Analysis A. Background Housing supply factors include the total number of units by type, price range, tenure, and absorption. Housing supply analysis also considers development trends and conditions impacting the overall housing market such as the current foreclosure and mortgage credit issues. When combined with key housing demand factors, the data can be extrapolated to determine the relative balance between affordable housing demand and supply in the Town of Cary. B. Housing Inventory According to the 2007 American Community Survey, the Town of Cary has a current total housing inventory of 47,385 units, which represents a 29 percent increase from The largest increases in the Town s inventory were in single-family, detached units (7,627 units/31 percent increase) and multi-family units of 5+ units (2,581 units/35 percent increase). Structure Type Table 9 Town of Cary Housing Inventory Year 2000 Year 2007 Net Change %Change Single-family, detached 24,306 31,933 7, % Single-family, attached 3,115 3, % Multi-family, 2-4 units 1,409 1, % Multi-family, 5+ units 7,449 10,030 2, % Mobile homes and others (22) (0.04%) Total Housing Units 36,850 47,385 10, % Source: 2000 U.S. Census; American Community Survey, 2007 It should be noted that only 18 percent of Cary s housing stock was built before 1970, and much of this housing is in the Town Center area. Though there was significant construction in the 1970s and 1980s, over 40 percent of Cary s housing was constructed in the 1990s. The effect of this building pattern is that older homes, those most likely in need of rehabilitation efforts, are clustered in this area. While they offer opportunities for affordable housing based on market price, they are likely to require considerable additional expenditure to bring them up to current market standards. C. Housing Occupancy and Vacancies The Town of Cary s occupied housing inventory is comprised of 31,260 owner-occupied units (70.1 percent) and 13,303 renter-occupied units (29.9 percent). From , Cary had an increase of 5,748 owner-occupied units (22.5 percent) and 3,928 renter-occupied units (41.9 percent).
17 Table 10 Town of Cary Housing Occupancy Status Housing Occupancy Status % Change Occupied housing units 34,887 44, % Owner-occupied 25,512 31, % Renter-occupied 9,375 13, % Vacant housing units 1,963 2, % Total Housing Units 36,850 47, % Source: 2000 U.S. Census; American Community Survey, 2000 Significantly, the Town of Cary experienced a 43.8 percent increase (859 units) in vacant housing units from The largest increase (200 percent) occurred in the other vacant status of the 2007 American Community Survey (ACS). The 2007 ACS for the Town of Cary does not include the housing vacancy status, For seasonal, recreational, or occasional use. It is assumed, however, that the large increase in other vacant units is the result of a developer held inventory that was not available for sale or rent at the time of the census survey. In addition, anecdotal information suggests that the Town has developed a market of homes that are rented or leased to households or corporations for short-term use by persons and families on temporary assignment in the Research Triangle area. This may also affect the number of vacant units at any point in time. Table 11 Town of Cary Housing Vacancy Status Housing Vacancy Status Year 2000 Year 2007 % Change Total Vacant Housing Units: 1,963 2, % For rent, for sale only, and rented or sold, not occupied 1,633 1, % All other vacant 330 1, % Source: 2000 U.S. Census; American Community Survey, 2007 D. Key Housing Supply Findings According to the 2007 ACS, the Town of Cary has a total current housing inventory of 47,385 units which represents a 29 percent increase from 2000; Largest increases are in single-family, detached units (7,627 units/31 percent increase) and multi-family units of 5+ units (2,581 units/35 percent increase); Cary s increase in multi-family units is largely in and unit structure types; Cary s occupied housing inventory is comprised of 31,260 owner-occupied units and 13,303 renter-occupied units, a proportion that is above the US norm in terms of owneroccupied units; From , Cary had an increase of 5,748 owner-occupied units and 3,928 renteroccupied units;
18 Cary experienced a 43.8 percent increase (859 units) in vacant housing units from ; While the majority of Cary s housing inventory is less than 20 years old, 18 percent (8,517 units) is now thirty years or older; Thus, the Town of Cary has a considerable supply of housing, including a large number of vacant units. Construction of single-family dwellings has been the primary focus of recent development, but the Town still has seen a solid increase in the numbers of multifamily dwellings. Much of the Town s housing is new, but the older housing units are concentrated in the Town Center area.
19 IV. Housing Affordability Analysis A. Defining Affordability The U.S. Department of Housing and Urban Development (HUD) calculates income definitions for use in administering housing programs across the nation. These figures are based upon different household sizes and income levels and vary according to the region or government statistical area. The usual benchmark is based on a family of four earning the area median income (AMI). The larger the household, the greater the income limits, which allow for multiple wage earners and higher income requirements for family expenses. Table 12 below shows the income limits for renter and owner households in the Raleigh-Cary Metropolitan Statistical Area (MSA): Table 12 HUD Household Income Limits Raleigh-Cary MSA FY 2008 Household Income Limits and Maximum Affordable Housing Costs, FY 2008 Max. House 80% of HUD Household Income Limits - Max. Monthly 50% of Median Median HUD Income - Household Family Size Raleigh- Income (Persons) Cary, MSA Limits - 80% Median 50% 1 $41,950 $139,833 $26,200 $550 2 $47,900 $159,667 $29,950 $629 3 $53,900 $179,667 $33,700 $708 $74,900 4 $59,900 $199,667 $37,450 $786 5 $64,700 $215,667 $40,450 $849 6 $69,500 $231,667 $43,450 $912 Source: HUD Tables The area median income (AMI) for Raleigh-Cary is $74,900 as it includes households across the larger MSA. This figure is considerably less than the Town of Cary median household income ($89,702). The average household size in Cary is 2.79 persons, which is rounded off to three persons. Thus, according to the above table, a three-person household could qualify for housing at 80 percent of AMI if their income did not exceed $53,900. Table 7 in the previous chapter estimated the total number of households within each income level for the Town of Cary based on the Town s median household income of $89,702. The analysis shows that all three-person households in the Very Low and Low Income categories would qualify at 80 percent of AMI along with a significant number of the Town s Moderate Income households. Table 13 below helps to more clearly define target populations by affordable housing demand and the types of housing and programs that are generally applied. This spectrum shows the income levels and types of housing that households at each level are most like to seek. The
20 affordable housing market typically includes renters in the under 80 percent of AMI range and first time homebuyers in the 80 to 120 percent of AMI range. Income Levels Income at AMI = $74,900 Number of HH in Cary Type of Housing Type of Program Table 13 Spectrum of Housing Demand and Program Response Very Low Income < $30% of AMI <$22,470 Low Income - 30 to 50% of AMI $22,471 - $37,450 Moderate Income - 51 to 80% of AMI Middle Income - 81 to 120% of AMI $37,451 - $59,920 $59,921 - $89,880 Above Middle Income to 150% of AMI $89,881 - $112,350 4,823 5,612 6,406 8,037 6,355 Emergency/ Subsidized Housing Income Restricted Market Rate Rentals/Assisted 1st-Time Homebuyers Entry Level Market Housing Step-up or Higher-end Market Housing ESG/Public Section Housing 8/CDBG CDBG/HOME/NSP CDBG/HOME/NSP N/A Buyer Market Affordable Housing Market Renter Market Source: 2000 U.S. Census; American Community Survey, 2007 B. Housing Prices and Rents The Town of Cary has experienced significant increases in housing prices during the past five years. According to the Housing and Community Development Consolidated Plan: FY , the median price of new and existing single-family homes in 2002 was $320,750 and $219,000, respectively. The current median sale price of a new single-family home in the Town of Cary is $650,000 (103 percent increase) and $320,000 for an existing single-family home (46 percent increase). The current $182,000 median sale price of an existing townhouse represents a 52 percent increase from The median sales price ($102,000) of an existing condominium unit decreased by 2 percent during the same period. Table 14 Town of Cary Housing Sale Price Trends Value 2008 Value % Change House Type New Existing New Existing New Existing Single-Family $320,750 $219,000 $650,000 $320, % 46% Detached Townhouse $171,500 $120,000 N/A $182,000 N/A 52% Condo N/A $104,000 N/A $102,000 N/A 2% Sources: 2002 sales prices extracted from Town of Cary Housing and Community Development Consolidated Plan: FY ; 2008 sales prices from Realtor.com. By way of comparison, the national inflation rate for the same period of housing price increases was 18 percent. Wage data for comparison for the same period specifically for Cary is not available. However, the median household income for the Town increased by 19.4 percent between 2000 and Though the increase in the median sale price of a single-family home in the Town of Cary has been offset, somewhat, by a continued rise in the Town s median household income, neither this figure nor the inflation figure approximates the increase in housing prices.
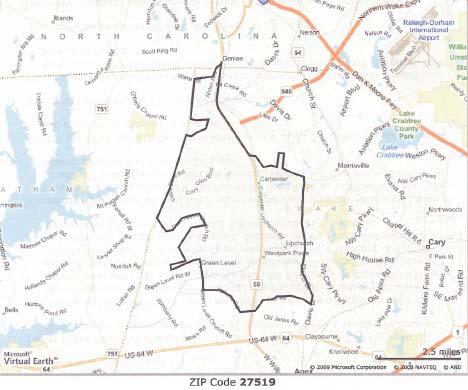
21 An analysis of single-family home sales activity for the Town as a whole shows that the median sales price in 2008 was $320,000, while the affordable price at the median household income was $253,994. Thus, significant affordability gaps exist for Low and Moderate income households and for Workforce income households earning approximately $100,000 or less annually. Table 15 Town of Cary Single-Family Home Affordability, 2008 HH Income Affordable Home Median Sale Price Gap/Surplus Category Purchase Low Income $125,528 $320,000 $194,472 Moderate Income $172,103 $320,000 $147,897 Median HH Income $253,884 $320,000 $66,116 ($89,702) Workforce Income $335,664 $320,000 $15,664 Middle Income $458,276 $320,000 $138,276 Source: Realtor.com; median value based on adjusted current median sales price of 945 single-family homes The increase in the median sale price of single-family homes has diminished affordability in certain geographic sub-markets and has created pressure on the larger market as evidenced by higher asking prices throughout the Town. Affordability gaps do exist in higher-priced sections of the Town, where new high-priced single-family construction has occurred, thereby increasing the comparative market value of the entire area. Table 16 Town of Cary Existing Single-Family Home Affordability by Zip Code 2008 Affordable Median Affordability Sales Price Median HH Gap/Surplus Zip Code 2008 Median $209,500 $349,000 $139, $250,000 $349,000 $109, $405,000 $349,000 $56, $364,250 $349,000 $15,250 Town Median Sales Price $320,000 $253,884 $66,116 Source: Realtor.com, 2008 Appendix A contains maps of the four ZIP Codes in Cary. As previously noted, the percentage of the Town of Cary s Low and Moderate income households that are cost-burdened is significant. The percentages are particularly high for renter households earning less than $35,000 annually. Current market rents in the Town of Cary average $900 for a 2-bedroom unit and $1,250 for a 3-bedroom unit. At these rent levels, substantial affordability gaps exist for all Very Low : income households for both 2- and 3- bedroom units. Essentially, market rents are unaffordable for all Town of Cary households earning less than $26,911 annually. Low-income renters, those earning less than $44,841 annually, are also cost-burdened based on the average market price of a 3-bedroom apartment.
22 Table 17 Town of Cary Rent Affordability 2008 HH Income Category Affordable Rent Median Market Rent 2 BR Gap/Surplus Median Market Rent 3 BR Gap/Surplus Very Low $672 $900 $228 $1,250 $578 Income Low Income $1,121 $900 $221 $1,250 $129 Moderate $1,794 $900 $894 $1,250 $544 Income Workforce Income $2,691 $900 $1,791 $1,250 $1,441 Middle Income $3,364 $900 $2,463 $1,250 $2,114 Sources: Rent.com and local newspaper listings C. Other Housing Supply Issues The Town of Cary and surrounding areas in Wake County are experiencing the impacts of rising home foreclosure activity. While pre-foreclosure activity has lessened in the Town of Cary since the Fall of 2008, there are currently (March, 2009) 74 homes in some stage of foreclosure activity, including 44 REOs or bank-owned properties. The Town also has 21 residential properties going through foreclosure auction. The highest concentrations of foreclosure activity are found in Zip Codes 27511, and though foreclosure activity can be found throughout the Town limits and surrounding areas of Wake County. Maps of the Town ZIP Codes are in Appendix A. Table 18 Town of Cary Foreclosure Activity 2008 Zip Code Pre-Foreclosures Bank-Owned Auction Totals Source: RealtyTrac.com, March, 2009 D. Key Housing Affordability Findings The Town of Cary has experienced significant increases in housing prices during the past five years; the current median sale price of a new single-family home in the Town of Cary is $650,000; the current median sale price of an existing single-family home in the Town of Cary is $320,000; The increase in the median sale price of a single-family home in the Town of Cary has been offset somewhat by a continued rise in the Town s median household income, but housing price increases have far outstripped wage increases and inflation;
23 The increase in the median sale price of single-family homes has especially diminished affordability in certain geographic sub-markets; Increase in the median sale price of single-family homes appears to have impacted the larger market as evidenced by higher listing prices throughout the Town; Current market rents in the Town of Cary average $900 for a 2-bedroom unit and $1,250 for a 3-bedroom unit; at these rent levels, substantial affordability gaps exist for all very low income households for both 2- and 3-bedroom units; The Town of Cary and surrounding areas in Wake County are experiencing the impacts of rising home foreclosure activity; there are currently 74 homes in the Town of Cary that are in some stage of foreclosure activity including 44 REOs or bank-owned properties; Thus, the Town of Cary does have a significant affordability gap, even at the Median Household Income level. At lower income levels, the gap becomes even greater, and, as shown, this gap is over $100,000 in two if the Town s four ZIP code areas. Renters also face an affordability gap, especially in the very low income category. The recent decline in housing prices and the increase in the number of foreclosures do not necessarily have a positive effect upon affordability. V. Affordable Housing Strategies A. Background Introduction The 2000 Cary Affordable Housing Plan included a list of strategies to implement the eight goals of the Plan. The strategies are more fully described in the Plan s Toolkit at the end of the document. The strategies were intended to provide the foundation of housing programs to be developed for the Town of Cary through policies, ordinances, procedures, and related documents. The strategies selected reflect the advice received from Town Council, Town of Cary staff, the Town Planning and Zoning Board, housing stakeholders, and the citizens of Cary who participated in the Plan development process. The 2020 Cary Affordable Housing Plan and current housing market analysis further substantiates the 1998 findings of Cary s Growth Management Task Force and the stated goal
24 of the Town Council, which supported an Affordable Housing Initiative to promote increased affordable housing opportunities in the community. The current analysis clearly shows that the housing market conditions that were impacting housing affordability and accessibility in 1998 have heightened considerably during the past ten years. The opportunity for many of Cary s current residents and workers to own a home in the community has decreased substantially. Further, rising housing values have resulted in many Cary owners and renters becoming increasingly cost-burdened. The Need The affordable housing needs assessment in this analysis provides an objective and measurable affordable housing supply and demand analysis that serves as the underpinning for the Town of Cary s creation and adoption of clear affordable housing goals and strategies. Key factors demonstrating this need are: Two of the top three occupations (Office/Administrative Support and Sales Related) earn less than $30,000 annually; Thirty-eight percent of Cary s households earn less than $71,763 annually and 24 percent less than $44,852 (50 percent of median); The percentage of the Town of Cary s low and moderate income households, both owner and renter, that are cost-burdened has become significant; The percentages are particularly striking for those households (owner and renter) earning less than $50,000 annually; Nearly all households (94 percent) earning less than $20,000 are cost burdened. The Town of Cary has a significant affordability gap, even at the Median Household Income level. At lower income levels, the gap becomes even greater, and this gap is over $100,000 in two if the Town s four ZIP code areas. Renters also face an affordability gap, especially in the very low income category. The recent decline in housing prices and the increase in the number of foreclosures do not necessarily have a positive effect upon affordability. The 2020 Plan directly addresses the key affordable housing findings in the housing needs assessment and provides clear policy direction and support for the Town s affordable housing strategies. The Town can be most effective by focusing on households in the low- and moderate-income groups. The Town can provide limited assistance to the Very Low-Income group because it does not have a Section 8 housing program, has a small homelessness problem, and is supportive of the City of Raleigh and the Wake County Housing Authorities. At the same time, the Middle-Income households do not require assistance. Existing programs do focus on these groups. Based upon an analysis of this data, the focus of the Town s Affordable Housing Program should be the following income groups, each of which has particular types of housing program needs: Moderate Income (50-80% of Area Median Income (AMI)) Low Income (30-50% AMI) Middle Income (80-120% AMI) The following income ranges are based upon a HUD-calculated (Raleigh-Cary) Area Median Income of $74,900.
25 Moderate Income Households are those having an income of between $27,451 and $59,920. Households in this group are typically seeking market rate rental housing or are first-time homebuyers, requiring some degree of assistance. Programs that offer such assistance include CDBG funding, the HOME Investment program, and currently, the Neighborhood Stabilization Program (NSP). Low Income Households are households having an income of between $22,471 and $37,450. Households in this income range are most likely seeking rental housing that is affordable. In Cary, this means rental housing constructed with the assistance of CDBG or other programs in order to make the units affordable. Middle Income Households are those with incomes between $59,921 and $89,880. These households are typically seeking entry-level home purchases. The programs most often employed to assist such households include CDBG funding, the HOME Investment program, and currently, the NSP. Thus, the types of programs that are most needed in Cary are ones: to develop affordable rental housing, to develop affordable owner units, to assist first-time market rate homebuyers, to keep households in their homes (e.g., rehab and repair programs), and to increase the use of the Town s Affordable Housing Program. The affordable housing strategies of the 2020 Cary Affordable Housing Plan build on the goals and strategies initially proposed in the 2000 Plan. Many of the strategies and the full Toolkit included in the 2000 Plan are supported by affordable housing best practice case studies throughout the country. Therefore, the 2020 Plan re-states many of these strategies within the current housing market context and proposes a package of strategies from a comprehensive policy, funding and programmatic standpoint. B. Recommendations The following are the key recommendations that flow from the preceding analysis and discussion of affordable housing with the Town Council in the course of several work sessions. RECOMMENDATION 1 Define the Affordable Housing Program We recommend that the Town of Cary adopt a comprehensive affordable housing policy. The adoption of a comprehensive local affordable housing policy and the implementation of a coordinated and integrated housing management system are the hallmarks of an effective policy and management process. A comprehensive affordable housing policy will address the interrelated elements of an affordable housing delivery system: planning and land use, local dedicated funding, and public/private institutional capacity building. The adoption of a comprehensive local affordable housing policy and design of a housing delivery system will help ensure the effective coordination and integration of the Town of Cary s affordable housing planning and management activities.
26 The Town has a policy of supporting and promoting affordable housing, working with developers and other housing groups to tie the production of market-rate housing to the provision of units for low- and moderate-income households. This policy should be continued and expanded upon. The Town can tie or incorporate Land Use Planning to the provision of Affordable Housing. The principles of Smart Growth, Traditional Neighborhood Design, higher densities, and mixed-use development accommodate growth and provide affordable housing in a sustainable fashion. Higher densities and a mix of land uses will reduce land consumption as well as vehicle trips, and the amenities and connections provided through Traditional Neighborhood Design enhance the quality of life while providing jobs for residents. These methods also provide for more diverse housing and pricing of that type of housing. The policy statement may read as follows: The Town Council desires to balance the population of Cary via an Affordable Housing initiative and perceives the following benefits of increasing the inventory of affordable housing: Promote social-economic diversity within our citizens Provide a ready inventory of employees for local employers Promote racial and ethnic diversity within our citizens Provide different economic levels of housing within our community Increase longevity of employment by enabling employees to live closer to work Ensure there are viable housing alternatives for Town employees within the town limits. To achieve these ends, the Town will: Continue to work with developers and not-for-profit organizations in the development of affordable rental and ownership units, expanding these efforts where possible, Continue to support and expand if possible, the current Owner Occupied Housing Rehabilitation Program, Target Affordable Housing Funds to neighborhood revitalization efforts, Assist First-Time Homebuyers to the extent possible, Seek new funding mechanisms, sources, and programs to enhance these efforts and make them more sustainable, Coordinate affordable housing programs with other aspects of planning, such as transportation, sustainability, and green growth, and Be conscious of opportunities to implement additional proven and acceptable affordable housing programs over time. RECOMMENDATION 2 - Continue and Expand the Existing Affordable Housing Delivery System A. The Town should continue its support of its current affordable housing programs, providing funds to complement resources from the various Federal programs. When possible, the Town should expand its support of these affordable housing programs. The current Affordable Housing Program, and the Town s Housing Rehabilitation Program have been successful in the past, and the operating mechanisms and procedures are already in place. As noted, 784 affordable housing units have been created in the past decade. Additional funding would expand the number of units that could be addressed each year.
27 More specifically: Pre-development Funding Support for Non-Profit Workforce/Affordable Housing Development Organizations The Town of Cary should provide pre-development funding assistance to able non-profit housing organizations, including community land trusts (CLTs) and community development corporations (CDCs), to increase affordable housing development opportunities in targeted neighborhoods. Targeting Affordable Housing Funds to Neighborhood Revitalization Affordable housing funding should be targeted to comprehensive neighborhood revitalization where high concentrations of the workforce reside. These efforts should include public infrastructure investments, code enforcement and increased crime prevention. Funding Emphasis on Purchase/Rehabilitation and Rental Rehabilitation Activities Given that the highest concentrations of low- and moderate-income households reside in older neighborhoods, the Town should direct affordable housing funding to targeted neighborhood purchase/rehabilitation and investor-owned, rental rehabilitation programs. This program maximizes the use of funds and sustains the number of affordable units in the Town. Low Income Housing Tax Credits The use of Low Income Housing Tax Credits is a tool that the Town has successfully employed in the past, and which has yielded very satisfactory results; there is little debate about the continued use of this mechanism when appropriate. B. Create a revolving loan fund for these programs so that funds used for these programs can be recaptured over time and used to continue and expand the program. Interest rates for the program would be modest and the infusion of additional capital from the Town each year in addition to the recycling of the original assets would expand each program s impact. It is estimated that ten to twelve rehabilitation loans per year would result in over $10,000 per year being paid back into the loan fund. RECOMMENDATION 3 Establish Realistic Goals and Routinely Monitor Program Activity and Progress We recommend that the Town establish realistic targets for the creation of affordable housing, regularly review and assess the program in light of current needs and the economic situation, and develop and use a set of measures to monitor program activity and success. GOALS As noted, the Town has been successful in developing and maintaining affordable housing units over the past decade, using a combination of funds from Federal and local resources, including the Town s General Fund. Based upon the success of this program at the earlier funding levels, and assuming consistent funding at this level going forward, the Town could expect to create:
28 o o o 40 new affordable rental housing units per year, 8 new owner housing units per year, The repair or rehabilitation of 15 owner units per year, These goals are both realistic, and conservative. It should be noted that costs have increased consistently over the past decade, and despite the recent recession, land costs and housing prices in Cary have remained high. Implementation of some of the measures recommended above, such as a revolving loan fund, will help mitigate expected increases. PROGRAM REVIEW The ability to measure accomplishments and the attainment of goals is important, and indeed is increasingly becoming necessary. Such information not only provides validation of successful programs, but also identifies under-performing programs. At a minimum, the Town should monitor the amounts spent by type of program, the number of affordable units created and the number of households assisted. This information not only provides a baseline for program evaluation, but also can greatly assist in providing accurate and up-to-date data for reporting and applications for funding entities, including HUD. The Town should make a conscious effort to review and assess its affordable housing programs once each year. The best time to conduct this review is at the time of the approval of the Town s Annual Action Plan and the Consolidated Annual Performance Evaluation Report (CAPER) for HUD. This document calls for a review of the preceding year s activities involving CDBG and HOME funds, and much of the data for an assessment of the affordable housing program will be collected for the HUD report. It should be noted that some flexibility should be given in this assessment. In some years, funds may be committed for a project, but other issues or the economy may create problems and delays. We suggest that the Town go further, however, and measure topics such as integration of affordable housing into overall planning and land use activities, the on-going monitoring and direction of the program, and other policy, implementation, and program management measures. The Town may examine issues such as the degree to which additional sources of funding e.g., grants, have been sought; how economic development and transportation policies address or include affordable housing concerns; how extensive are relationships with not-forprofit organizations and have any new relationships been developed? The Town should also consider the extent to which it has developed new mechanisms to further and expand the development and maintenance of affordable housing. For example, in light of rising land costs and a diminishing supply of available sites, has the Town established a Land Trust to acquire and hold property for the development affordable units, or at least to be able to acquire property if it becomes available? A number of municipalities in Florida are using a detailed Municipal Scorecard for Affordable Housing Delivery developed at Florida International University, conducting a thorough review of their program on a regular basis. Research into the application of specific affordable housing policies and mechanisms reveals no definitive benchmarks or trigger points for a particular policy or program. Rather, communities adopt the policies and ordinances that best suit their needs, approach, and commitment to affordable housing. The use of a land trust, linkage fees, density bonuses, and investment trusts reflect the perceived need and desire to provide affordable housing as opposed to identifying a particular level of need or selecting the means to provide a certain number of units.
29 However, following recommendation notes that there a number of widely used mechanisms available to the Town, and that these tools should be reviewed and discussed periodically as needs and the Town s situation evolve. RECOMMENDATION 4 - Identify Additional Program Mechanisms The Town should review and consider additional tools and programs that it wishes to use to implement its affordable housing program and objectives in the future. The current affordable housing program has employed a number of tools and has been successful in creating affordable units. However, this recommendation emphasizes the need to review and consider other policy and financial options for increasing the stock of affordable housing in the Town. POLICY MECHANISMS Density Bonus Program Density bonus programs are designed as affordable housing incentives for private and nonprofit developers. Density bonus programs work best when designed as an element of a comprehensive affordable housing delivery strategy that may include inclusionary housing and targeted housing and infrastructure resources. A density bonus program would provide guidelines and restrictions to qualify for an increase in density/height. A municipality may approve residential development at a density up to a certain percent above the maximums provided it is certified that no less than a certain percent (generally a minimum of 20 percent) of the units in the development will be priced to be affordable to low and very-low income households. Developers may also meet this requirement by providing the units onsite, providing a monetary contribution, or delivery of offsite units. A combination of the three options is usually permissible. For each required workforce housing unit, developers may make a payment of a sum equal to the funds payable to a Housing Trust Fund in lieu of providing the workforce housing unit within the development. However, please note that the pattern of traditional single-family detached housing that has marked much of Cary s recent development does not affect, or in many cases even permit, the development of affordable housing. Overall market conditions determine what buyers are willing to purchase, and any of the programs described above should be combined with other workforce housing programs to promote diverse and affordable neighborhoods. Based upon discussions of this topic with Council in work sessions and meetings with Town staff, we perceive that establishing a policy tool that provides developers with incentives or a rationale to produce affordable housing is the most viable mechanism to create affordable housing units. The Town imposed a 15 percent requirement for the development of affordable units in the successful Grove at Cary Park project. This method can result in the production of both rental and owner units. Workforce Housing Overlay Districts The creation of overlay districts allows the Town to target neighborhoods, districts or other locations generally for workforce/affordable housing infill development.
30 Inclusionary Zoning (Housing) Inclusionary zoning (IZ) is a policy tool that ties the production of affordable homes to the production of new market-rate housing by requiring, or providing incentives to encourage, developers to reserve a share of units in new residential developments for low- or moderateincome households. Inclusionary zoning, sometimes called "inclusionary housing," can take many forms. Some IZ programs are mandatory, while others are voluntary or incentivedriven. Some jurisdictions require developers to construct affordable units within the development, while others allow affordable units to be constructed in another location. Some require developers to build the units, while other communities allow developers to contribute in lieu of to an affordable housing trust fund. We cite the Town of Davidson Planning Ordinance (Section 6.0) as an example of creating affordable housing through both the construction of such units or the payment in lieu of construction. Also, note that in some jurisdictions developers of commercial and office projects are required to develop affordable housing or make payments to an affordable housing trust fund based upon the number of jobs created/supported by their project or the dollar value of the project. These linkage fees are typically supported by a nexus study. The topic is a sensitive one, as North Carolina law does not specifically address a municipality s authority to enact such regulations, and the General Assembly itself does not appear to want to address the topic. The Town may wish to pursue the Chapel Hill model of adopting a policy requiring developers to produce a certain percentage of affordable units for persons earning 80 percent or less of the AMI. In this case, the Town should define the desired product and match it to the need. We note that properties developed as affordable units should be deed restricted as permanently affordable. Less than permanent affordability status sets the stage for the loss of the unit or the need for what is likely to prove to be an expensive buy-back at the end of the period. We also note the need for the assessment of a stewardship fee to provide for the maintenance and upkeep of the property over time. Many homeowners in these income categories do not have the resources to keep these structures up, and assistance may be required over time. FUNDING MECHANISMS Housing Investment (Trust) Fund The Town of Cary already has a local affordable housing fund in place that receives general funds from the Town of Cary. The Affordable Housing Program (AHP) allocates funds through a competitive request for proposal process and is used for funding projects not eligible for CDBG funding (i.e. new construction projects by for profit developers). The Town s AHP could be capitalized through a Housing Investment (Trust) Fund that receives voluntary donations from private developers in-lieu of building affordable housing under the Town s recommended inclusionary housing provisions. Funds could also be generated via the establishment of a Housing Linkage Fee and through an innovative blend of corporate and community investors including voluntary donations from local corporations, foundations, government, and individuals as well as investments and loans from financial institutions.
31 Community Land Trust Acquisition of land has become one of the key cost barriers to developing affordable housing within the Town. Community land trusts (CLTs) purchase and hold the land asset in trust for the benefit of low- and moderate-income households, and this entity provides the means to develop and implement a land banking program in conjunction with school site, open space, or other land acquisition programs. By removing land cost from sales and rental transactions, CLTs reduce rent and home prices. CLTs also ensure that the housing will remain affordable in perpetuity. In addition to lowering costs and ensuring long-term affordability, a Town of Cary Community Land Trust can purchase land for housing development; seek opportunities to use vacant land for infill development or to convert old buildings to new uses; and coordinate with institutional providers (e.g. Housing Authorities, School Board, Hospital District, private sector employers). Double Bottom Line Investment Fund A double bottom line investment fund is designed to provide a return for its investors and help fill the financing gap faced by developers interested in building housing affordable to middle-income households in communities where land costs are excessive. Investors in the fund may include a number of banks as well as insurance companies, pension funds, and other market-driven investors. Sources of funds include might private sector market-driven investments and New Markets Tax Credits. The double bottom line investment fund can provide significant gap financing for development including mezzanine financing for mixedincome/mixed-use development (e.g. transit-oriented development), and can assist smaller developers on projects that will not only provide housing affordable to a mix of incomes, but will also help revitalize older low- and moderate-income neighborhoods. These suggested financial program strategies would create opportunities to leverage local public/private dedicated funds (e.g. Housing Trust Fund) with federal, state, and other local public funding resources. Given the scale of Cary s affordable housing demand and limited CDBG resources, it is critical for the Town to effectively leverage and target public/private funds to maximize assistance to low- and moderate-income owner and renter households. The programs within the family of funds should be balanced among revenue-generating activities (e.g. housing linkage fees, voluntary in-lieu payments); revenue renewable activities (low-interest loans) and non-renewable activities (deferred payment loans). C. Conclusion In conclusion, the Town officials endorses the continuation of its current affordable housing programs, including the housing rehabilitation program, the partnering with nonprofit organizations, the use of low-income Housing Tax Credits where appropriate, and the targeting of affordable housing funds to neighborhood revitalization efforts. As noted, these programs have been successful in providing significant additions to the Town s stock of affordable housing. Based on the feedback from work sessions, meetings with staff and stakeholder group, the Town should consider the following key recommendations for short term including 1) the creation of a revolving loan fund for the current programs, 2) the establishment of program goals, as described, and 3) the regular review of the programs to determine how they are meeting those goals.
32 Longer term, this strategy calls for the review and consideration of additional program mechanisms to implement the Town s affordable housing efforts. These mechanisms may be either policy mechanisms or funding mechanisms or a combination of both, depending upon the Town s needs and aims, as well as the state of the economy.


33 APPENDIX A TOWN OF CARY ZIP CODE MAPS The following maps, from show the areas of the Town included in each of the four ZIP Codes.

34
Little Haiti Community Needs Assessment: Housing Market Analysis December 2015
 Little Haiti Community Needs Assessment: Housing Market Analysis December 2015 Prepared by: EXECUTIVE SUMMARY Background The Little Haiti Housing Needs Assessment provides a current market perspective
MONROE COUNTY HOUSING NEEDS ASSESSMENT
 MONROE COUNTY HOUSING NEEDS ASSESSMENT PREPARED BY: FLORIDA INTERNATIONAL UNIVERSITY THE METROPOLITAN CENTER FOR: THE PARTNERSHIP FOR COMMUNITY HOUSING INTRODUCTION Overview and Methodology Tasks Labor
4. HOUSEHOLD INCOME AND AFFORDABILITY
 4. HOUSEHOLD INCOME AND AFFORDABILITY The analysis of the Household and Affordability section relied primarily on data from the State Department of Housing and Community Development (HCD), California Tax
ECONOMIC CURRENTS. Vol. 3, Issue 1. THE SOUTH FLORIDA ECONOMIC QUARTERLY Introduction
 ECONOMIC CURRENTS THE SOUTH FLORIDA ECONOMIC QUARTERLY Introduction Economic Currents provides an overview of the South Florida regional economy. The report contains current employment, economic and real
SJC Comprehensive Plan Update Housing Needs Assessment Briefing. County Council: October 16, 2017 Planning Commission: October 20, 2017
 SJC Comprehensive Plan Update 2036 Housing Needs Assessment Briefing County Council: October 16, 2017 Planning Commission: October 20, 2017 Overview GMA Housing Element Background Demographics Employment
Housing Study & Needs Assessment
 Housing Study & Needs Assessment Phase II Public Engagement Presentation #2 Winston-Salem, North Carolina January 25, 2018 MEETING OVERVIEW Welcome & Introductions Purpose & Goals Community Discussions
Metro Atlanta Rental Housing Affordability: How Hot is Too Hot for Low-Income Workers?
 Metro Atlanta Rental Housing Affordability: How Hot is Too Hot for Low-Income Workers? July 2018 Atlanta Regional Commission For more information, contact: cdegiulio@atlantaregional.org Metro Atlanta s
H o u s i n g N e e d i n E a s t K i n g C o u n t y
 1999 2000 2001 2002 2003 2004 2005 2006 2007 2008 2009 2010 Number of Affordable Units H o u s i n g N e e d i n E a s t K i n g C o u n t y HOUSING AFFORDABILITY Cities planning under the state s Growth
Addressing the Impact of Housing for Virginia s Economy
 Addressing the Impact of Housing for Virginia s Economy A REPORT FOR VIRGINIA S HOUSING POLICY ADVISORY COUNCIL NOVEMBER 2017 Appendix Report 2: Housing the Commonwealth's Future Workforce 2014-2024 Jeannette
ECONOMIC CURRENTS. Vol. 3, Issue 3 SOUTH FLORIDA ECONOMIC QUARTERLY. Introduction
 ECONOMIC CURRENTS THE Introduction SOUTH FLORIDA ECONOMIC QUARTERLY Economic Currents provides an overview of the South Florida regional economy. The report presents current employment, economic and real
Housing Characteristics
 CHAPTER 7 HOUSING The housing component of the comprehensive plan is intended to provide an analysis of housing conditions and need. This component contains a discussion of McCall s 1990 housing inventory
Young-Adult Housing Demand Continues to Slide, But Young Homeowners Experience Vastly Improved Affordability
 Young-Adult Housing Demand Continues to Slide, But Young Homeowners Experience Vastly Improved Affordability September 3, 14 The bad news is that household formation and homeownership among young adults
ECONOMIC CURRENTS. Vol. 4, Issue 3. THE Introduction SOUTH FLORIDA ECONOMIC QUARTERLY
 ECONOMIC CURRENTS THE Introduction SOUTH FLORIDA ECONOMIC QUARTERLY Vol. 4, Issue 3 Economic Currents provides an overview of the South Florida regional economy. The report presents current employment,
Post-Katrina housing affordability challenges continue in 2008, worsening among Orleans Parish very low income renters
 Post-Katrina housing affordability challenges continue in 2008, worsening among Orleans Parish very low income renters Based on 2004, 2007 and 2008 American Community Survey data from the U.S. Census Bureau
HOUSING AFFORDABILITY
 HOUSING AFFORDABILITY (RENTAL) 2016 A study for the Perth metropolitan area Research and analysis conducted by: In association with industry experts: And supported by: Contents 1. Introduction...3 2. Executive
Housing Indicators in Tennessee
 Housing Indicators in l l l By Joe Speer, Megan Morgeson, Bettie Teasley and Ceagus Clark Introduction Looking at general housing-related indicators across the state of, substantial variation emerges but
AN ECONOMIC, FISCAL AND CAPITAL ASSET IMPACT ANALYSIS OF THIRTEEN PROPOSED NEW DEVELOPMENTS ON THE TOWN OF DENTON, MARYLAND.
 AN ECONOMIC, FISCAL AND CAPITAL ASSET IMPACT ANALYSIS OF THIRTEEN PROPOSED NEW DEVELOPMENTS ON THE TOWN OF DENTON, MARYLAND Prepared for The Denton Town Council Denton, Maryland by Dean D. Bellas, Ph.D.
City of Lonsdale Section Table of Contents
 City of Lonsdale City of Lonsdale Section Table of Contents Page Introduction Demographic Data Overview Population Estimates and Trends Population Projections Population by Age Household Estimates and
Briefing Book. State of the Housing Market Update San Francisco Mayor s Office of Housing and Community Development
 Briefing Book State of the Housing Market Update 2014 San Francisco Mayor s Office of Housing and Community Development August 2014 Table of Contents Project Background 2 Household Income Background and
Modeling Housing Affordability in Corpus Christi, Texas
 Modeling Housing Affordability in Corpus Christi, Texas December 13, 2018 Overview I. Background II. Owner-Occupied Housing Affordability III. Renter-Occupied Housing Affordability IV. Future Housing Needs
Affordably- Priced Housing
 Affordably- Priced Housing Can the next generation afford to live in Chester County? Chester County Planning Commission This slide deck is an annotated version of one presented at the Chesco2020 Affordably-Priced
Detroit Inclusionary Housing Plan & Market Study Preliminary Inclusionary Housing Feasibility Study Executive Summary August, 2016
 Detroit Inclusionary Housing Plan & Market Study Preliminary Inclusionary Housing Feasibility Study Executive Summary August, 2016 Inclusionary Housing Plan & Market Study Objectives 1 Evaluate the citywide
Housing & Neighborhoods Trends
 Housing & Neighborhoods Trends Where do we stand in 2017 At A Glance: Indicator Trend Comparison to State Financial Housing Burden Tax Burden To Note: In 2017, there were a number of Housing & Neighborhood
New affordable housing production hits record low in 2014
 1 Falling Further Behind: Housing Production in the Twin Cities Region December 2015 Key findings Only a small percentage of added housing units were affordable to households with low and moderate incomes.
HOUSING ELEMENT TABLE OF CONTENTS INTRODUCTION...HO- 1 BAINBRIDGE ISLAND SNAPSHOT: PEOPLE AND HOUSING.. HO-1
 HOUSING ELEMENT TABLE OF CONTENTS PAGE INTRODUCTION...HO- 1 BAINBRIDGE ISLAND SNAPSHOT: PEOPLE AND HOUSING.. HO-1 GMA GOAL AND REQUIREMENTS FOR HOUSING. HO-1 HOUSING NEEDS..HO-2 HOUSING ELEMENT VISION...HO-3
July 1, 2015 thru September 30, 2015 Performance Report
 Grantee: Grant: Hernando County, FL B-11-UN-12-0021 July 1, 2015 thru September 30, 2015 Performance Report 1 Grant Number: B-11-UN-12-0021 Grantee Name: Hernando County, FL Grant Award Amount: $1,953,975.00
Housing Needs in Burlington s Downtown & Waterfront Areas
 Housing Needs in s Downtown & Waterfront Areas Researched and written by Vermont Housing Finance Agency for the City of Planning & Zoning Department 10/31/2011 Contents Introduction... 2 Executive Summary...
Integrating Housing into Regional Planning
 Integrating Housing into Regional Planning Background SCI provides resources to more fully integrate housing and economic vitality into Metro Vision Housing and economic vitality identifies as areas of
ECONOMIC CURRENTS. Vol. 5 Issue 2 SOUTH FLORIDA ECONOMIC QUARTERLY. Key Findings, 2 nd Quarter, 2015
 ECONOMIC CURRENTS THE Introduction SOUTH FLORIDA ECONOMIC QUARTERLY Economic Currents provides an overview of the South Florida regional economy. The report presents current employment, economic and real
Community Revitalization Efforts 2016 Thresholds and Scoring Criteria
 s 2016 Thresholds and Scoring Criteria Definitions: a deliberate, concerted, and locally approved plan or documented interconnected series of local approvals and events intended to improve and enhance
Chapter 4: Housing and Neighborhoods
 Chapter 4: Housing and Neighborhoods Introduction Medina is a growing community that provides a variety of housing types and neighborhood styles while protecting and enhancing the City s open spaces and
The rapidly rising price of single-family homes in. Change and Challenges East Austin's Affordable Housing Problem
 Change and Challenges East 's Affordable Housing Problem Harold D. Hunt and Clare Losey March 2, 2017 Publication 2161 The rapidly rising price of single-family homes in East has left homeownership out
Document under Separate Cover Refer to LPS State of Housing
 Document under Separate Cover Refer to LPS5-17 216 State of Housing Contents Housing in Halton 1 Overview The Housing Continuum Halton s Housing Model 3 216 Income & Housing Costs 216 Indicator of Housing
October 17, Proposal Due Date: Friday, November 10, 2017 by 4:00 pm
 Request for Proposal (RFP) For Housing Study and Needs Assessment Lamoille County Planning Commission (LCPC) Lamoille Housing Partnership (LHP) Stowe Land Trust (Identified below as The Contracting Partners
2014 Plan of Conservation and Development
 The Town of Hebron Section 1 2014 Plan of Conservation and Development Community Profile Introduction (Final: 8/29/13) The Community Profile section of the Plan of Conservation and Development is intended
Subject. Date: 2016/10/25. Originator s file: CD.06.AFF. Chair and Members of Planning and Development Committee
 Date: 2016/10/25 Originator s file: To: Chair and Members of Planning and Development Committee CD.06.AFF From: Edward R. Sajecki, Commissioner of Planning and Building Meeting date: 2016/11/14 Subject
DRAFT REPORT. Residential Impact Fee Nexus Study. June prepared for: Foster City VWA. Vernazza Wolfe Associates, Inc.
 DRAFT REPORT Residential Impact Fee Nexus Study June 2015 prepared for: Foster City VWA Vernazza Wolfe Associates, Inc. Table of Contents I. EXECUTIVE SUMMARY... 4 Introduction... 4 Background... 4 Report
ATTACHMENT B DRAFT NON-RESIDENTIAL NEXUS ANALYSIS. Prepared for City of Sonoma. Prepared by: Keyser Marston Associates, Inc.
 ATTACHMENT B DRAFT NON-RESIDENTIAL NEXUS ANALYSIS Prepared for City of Sonoma Prepared by: Keyser Marston Associates, Inc. February 2018 TABLE OF CONTENTS I. INTRODUCTION... 1 Purpose... 1 Analysis Scope...
TOD and Equity. TOD Working Group. James Carras Carras Community Investment, Inc. August 7, 2015
 TOD and Equity TOD Working Group James Carras Carras Community Investment, Inc. August 7, 2015 What is Equitable TOD? Equity is fair and just inclusion. Equitable TOD is the precept that investments in
2011 Broward County A f f o r d a b l e H o u s i n g Needs Assessment
 2011 Broward County A f f o r d a b l e H o u s i n g Needs Assessment RESEARCH TEAM The Metropolitan Center at Florida International University: The Metropolitan Center at Florida International University
Denver Comprehensive Housing Plan. Housing Advisory Committee Denver, CO August 3, 2017
 Denver Comprehensive Housing Plan Housing Advisory Committee Denver, CO August 3, 2017 Overview 1. Review of Comprehensive Housing Plan process 2. Overview of legislative and regulatory priorities 3. Overview
HOUSING ELEMENT Inventory Analysis
 HOUSING ELEMENT Inventory Analysis 2.100 INVENTORY Age of Housing Stock Table 2.25 shows when Plantation's housing stock was constructed. The latest available data with this kind of breakdown is 2010.
2009 Broward County Housing Needs Assessment
 2009 Broward County Housing Needs Assessment Prepared for: Broward County Housing Council Prepared by: FIU Metropolitan Center EXECUTIVE SUMMARY i TABLE OF CONTENTS ii I. INTRODUCTION AND METHODOLOGY The
WELLSVILLE AFFORDABLE HOUSING PLAN
 WELLSVILLE AFFORDABLE HOUSING PLAN 2014 DRAFT 2.2 Wellsville: Affordable Housing Plan 2014 Page 2 DRAFT 2.2 Wellsville: Affordable Housing Plan 2014 Table of Contents Summary of Affordable Housing Conditions...
Town of Limon Comprehensive Plan CHAPTER 4 HOUSING. Limon Housing Authority Affordable Housing
 CHAPTER 4 HOUSING Limon Housing Authority Affordable Housing 40 VISION Throughout the process to create this comprehensive plan, the community consistently voiced the need for more options in for-sale
2015 New York City. Housing Security Profile and Affordable Housing Gap Analysis
 2015 New York City Housing Security Profile and Affordable Housing Gap Analysis 1 Contents: Housing Insecurity in New York City 3 A City of Renters. 6 Where the Housing Insecure Population Lives 16 Housing
Ann Arbor Downtown Market Scan
 2018 Market Scan Market Scan July 2018 OVERVIEW 2 POPULATION & HOUSEHOLDS 5 MULTI-FAMILY 9 RETAIL & RESTAURANT 14 EMPLOYMENT & OFFICE 18 CONSTRUCTION COSTS 22 4WARD PLANNING INC. 1 2018 Market Scan OVERVIEW
2012 Profile of Home Buyers and Sellers New Jersey Report
 Prepared for: New Jersey Association of REALTORS Prepared by: Research Division December 2012 Table of Contents Introduction... 2 Highlights... 4 Conclusion... 7 Report Prepared by: Jessica Lautz 202-383-1155
CONTENTS. Executive Summary 1. Southern Nevada Economic Situation 2 Household Sector 5 Tourism & Hospitality Industry
 CONTENTS Executive Summary 1 Southern Nevada Economic Situation 2 Household Sector 5 Tourism & Hospitality Industry Residential Trends 7 Existing Home Sales 11 Property Management Market 12 Foreclosure
The Knox County HOUSING MARKET
 T E C H REPORT SERIES The Knox HOUSING MARKET Date: August 2007 For more information: MPC Contact Person: Bryan Berry 215-2500 MPC Website and e-mail www.knoxmpc.org contact@knoxmpc.org INTRODUCTION In
The supply of single-family homes for sale remains
 Oh Give Me a (Single-Family Rental) Home Harold D. Hunt and Clare Losey December, 18 Publication 2218 The supply of single-family homes for sale remains tight in many markets across the United States.
WHERE WILL WE LIVE? ONTARIO S AFFORDABLE RENTAL HOUSING CRISIS
 WHERE WILL WE LIVE? ONTARIO S AFFORDABLE RENTAL HOUSING CRISIS 48% of Ontario renters make less than $40,000 a year. Nearly half of Ontario renters pay unaffordable rental housing costs. 46% of all renters
RESIDENTIAL MARKET STUDY. for the TOWN OF CHAPEL HILL PREPARED BY DEVELOPMENT CONCEPTS, INC.
 RESIDENTIAL MARKET STUDY for the TOWN OF CHAPEL HILL PREPARED BY DEVELOPMENT CONCEPTS, INC. JANUARY 2010 1 Chapel Hill Housing Trends 2 Housing Demand 3 Housing Affordability i AGENDA just the facts, ma
Housing Affordability in Lexington, Kentucky
 University of Kentucky UKnowledge CBER Research Report Center for Business and Economic Research 6-29-2009 Housing Affordability in Lexington, Kentucky Christopher Jepsen University of Kentucky, chris.jepsen@uky.edu
Attachment 3. Guelph s Housing Statistical Profile
 Attachment 3 Guelph s Housing Statistical Profile Table of Contents 1. Population...1 1.1 Current Population (26)...1 1.2 Comparative Growth, Guelph and Ontario (21-26)...1 1.3 Total Household Growth (21
APPENDIX A. Market Study Standards and Requirements
 APPENDIX A Market Study Standards and Requirements Section 42(m)(1)(A)(iii) of the IRS Code and Section IV(A)(2) of the 2018 Qualified Allocation Plan (QAP) require market studies for all low-income housing
Housing Market Update
 Housing Market Update March 2017 New Hampshire s Housing Market and Challenges Market Overview Dean J. Christon Executive Director, New Hampshire Housing Finance Authority New Hampshire s current housing
REGIONAL. Rental Housing in San Joaquin County
 Lodi 12 EBERHARDT SCHOOL OF BUSINESS Business Forecasting Center in partnership with San Joaquin Council of Governments 99 26 5 205 Tracy 4 Lathrop Stockton 120 Manteca Ripon Escalon REGIONAL analyst april
2012 Profile of Home Buyers and Sellers Texas Report
 2012 Profile of Home and Sellers Report Prepared for: Association of REALTORS Prepared by: NATIONAL ASSOCIATION OF REALTORS Research Division December 2012 2012 Profile of Home and Sellers Report Table
AFFORDABLE WORKFORCE HOUSING REPORT OF THE WORKING GROUP Recommendations for our Region Approved February 22, 2006
 AFFORDABLE WORKFORCE HOUSING REPORT OF THE WORKING GROUP Recommendations for our Region Approved February 22, 2006 www.rrregion.org RAPPAHANNOCK RAPIDAN REGIONAL COMMISSION WORKFORCE HOUSING WORKING GROUP
The Texas 2005 Profile of Home Buyers and Sellers. Prepared by: NATIONAL ASSOCIATION OF REALTORS Research Division
 The Texas 2005 Profile of Home Buyers and Sellers Prepared by: NATIONAL ASSOCIATION OF REALTORS Research Division February, 2006 The 2005 NATIONAL ASSOCIATION OF REALTORS Profile of Home Buyers and Sellers
While the United States experienced its larg
 Jamie Davenport The Effect of Demand and Supply factors on the Affordability of Housing Jamie Davenport 44 I. Introduction While the United States experienced its larg est period of economic growth in
TABLE OF CONTENTS TABLE OF FIGURES
 PREPARED FOR THE CITY OF BEVERLY HILLS RENT STABILIZATION ANALYSIS DRAFT DATA BRIEF JULY 26, 2018 TABLE OF CONTENTS TABLE OF FIGURES TABLE OF CONTENTS INTRODUCTION... 3 RSO BUILDING STOCK CHARACTERISTICS...
Myth Busting: The Truth About Multifamily Renters
 Myth Busting: The Truth About Multifamily Renters Multifamily Economics and Market Research With more and more Millennials entering the workforce and forming households, as well as foreclosed homeowners
The Local Impact of Home Building in Douglas County, Nevada. Income, Jobs, and Taxes generated. Prepared by the Housing Policy Department
 The Local Impact of Home Building in Douglas County, Nevada Income, Jobs, and Taxes generated = Prepared by the Housing Policy Department May 2007 National Association of Home Builders 1201 15th Street,
Public Review Draft. January 2007
 Lee County, Florida SUPPORT STUDY: AFFORDABLE HOUSING METHODOLOGY January 2007 Public Review Draft Submitted by: CLARION ASSOCIATES, LLC 1526 East Franklin Street, Suite 102 Chapel Hill, NC 27514 (919)
CHAPTER 3. HOUSING AND ECONOMIC DEVELOPMENT
 CHAPTER 3. HOUSING AND ECONOMIC DEVELOPMENT This chapter analyzes the housing and economic development trends within the community. Analysis of state equalized value trends is useful in estimating investment
Metropolitan Development and Housing Agency. Reviewed and Approved
 Action Plan Grantee: Grant: Metropolitan Development and Housing Agency B-09-CN-TN-0024 LOCCS Authorized Amount: Grant Award Amount: $ 30,469,999.99 $ 30,469,999.99 Status: Reviewed and Approved Estimated
CULPEPER AFFORDABLE HOUSING NEEDS ASSESSMENT SUBMITTED TO VIRGINIA DEPARTMENT OF HOUSING AND COMMUNITY DEVELOPMENT JUNE 2013
 CULPEPER AFFORDABLE HOUSING NEEDS ASSESSMENT SUBMITTED TO VIRGINIA DEPARTMENT OF HOUSING AND COMMUNITY DEVELOPMENT JUNE 2013 Prepared by the Culpeper Affordable Housing Committee and Rappahannock-Rapidan
Prepared For: Pennsylvania Utility Law Project (PULP) Harry Geller, Executive Director Harrisburg, Pennsylvania
 Harry Geller, Executive Director Harrisburg, Pennsylvania") THE CONTRIBUTION OF UTILITY BILLS TO THE UNAFFORDABILITY OF LOW-INCOME RENTAL HOUSING IN PENNSYLVANIA June 2009 Prepared For: Pennsylvania Utility Law Project (PULP) Harry Geller, Executive Director Harrisburg,
THE CONTRIBUTION OF UTILITY BILLS TO THE UNAFFORDABILITY OF LOW-INCOME RENTAL HOUSING IN PENNSYLVANIA June 2009 Prepared For: Pennsylvania Utility Law Project (PULP) Harry Geller, Executive Director Harrisburg,
Impact Fee Nexus & Economic Feasibility Study
 Impact Fee Nexus & Economic Feasibility Study Stakeholder Working Group November 12, 2015 Urban Economics Oakland Impact Fee Stakeholder Working Group November 12, 2015 INTRODUCTIONS 1 Agenda Introductions
April 1, 2014 thru June 30, 2014 Performance Report
 Grantee: Grant: Prince Georges County, MD B-11-UN-24-0002 April 1, 2014 thru June 30, 2014 Performance Report 1 Grant Number: B-11-UN-24-0002 Grantee Name: Prince Georges County, MD Grant Award Amount:
City of. Hood River. Housing and. Income Metrics. Report. Prepared by: Decisions Decisions
 City of Prepared by: Decisions Decisions Hood River Housing and Income Metrics Project Manager: Allison Handler, Associate 503-249-0000 allison@decision2.com Report December 14, 2009 1001 SE Water Avenue,
RENTAL MARKET REPORT. Manitoba Highlights* Highlights. Housing market intelligence you can count on
 H o u s i n g M a r k e t I n f o r m a t i o n RENTAL MARKET REPORT Highlights* C a n a d a M o r t g a g e a n d H o u s i n g C o r p o r a t i o n Date Released: Spring 2012 Figure 1 Winnipeg CMA Brandon
Highs & Lows of Floodplain Regulations
 Highs & Lows of Floodplain Regulations Luis B. Torres, Clare Losey, and Wesley Miller September 6, 218 H ouston, the nation s fourth-largest city and home to a burgeoning oil and gas sector, has weathered
July 1, 2014 thru September 30, 2014 Performance Report
 Grantee: Grant: Broward County FL B-11-UN-12-0002 July 1 2014 thru September 30 2014 Performance Report 1 Grant Number: B-11-UN-12-0002 Grantee Name: Broward County FL Grant Award Amount: $5457553.00 LOCCS
2014 Plan of Conservation and Development. Development Plan & Policies
 The Town of Hebron Section 3 2014 Plan of Conservation and Development Development Plan & Policies C. Residential Districts I. Residential Land Analysis This section of the plan uses the land use and vacant
THAT Council receives for information the Report from the Planner II dated April 25, 2016 with respect to the annual Housing Report update.
 Report to Council Date: April 25, 2016 File: 1200-40 To: From: Subject: City Manager Laura Bentley, Planner II, Policy & Planning Annual Housing Report Update Recommendation: THAT Council receives for
Status of HUD-Insured (or Held) Multifamily Rental Housing in Final Report. Executive Summary. Contract: HC-5964 Task Order #7
 Multifamily Rental Housing in Final Report. Executive Summary. Contract: HC-5964 Task Order #7") Status of HUD-Insured (or Held) Multifamily Rental Housing in 1995 Final Report Executive Summary Cambridge, MA Lexington, MA Hadley, MA Bethesda, MD Washington, DC Chicago, IL Cairo, Egypt Johannesburg,
Status of HUD-Insured (or Held) Multifamily Rental Housing in 1995 Final Report Executive Summary Cambridge, MA Lexington, MA Hadley, MA Bethesda, MD Washington, DC Chicago, IL Cairo, Egypt Johannesburg,
Implementing Small Area Fair Market Rents (SAFMRs) in the HCV Program. Plano Housing Authority Case Study
 in the HCV Program. Plano Housing Authority Case Study") Implementing Small Area Fair Market Rents (SAFMRs) in the HCV Program Plano Housing Authority Case Study 1 Contents Background...2 Motivations for Implementing SAFMR...2 Market conditions...2 Strategic
Implementing Small Area Fair Market Rents (SAFMRs) in the HCV Program Plano Housing Authority Case Study 1 Contents Background...2 Motivations for Implementing SAFMR...2 Market conditions...2 Strategic
HOUSING NEEDS ANALYSIS & ASSESSMENT REQUEST FOR PROPOSALS
 HOUSING NEEDS ANALYSIS & ASSESSMENT REQUEST FOR PROPOSALS I. Introduction Sibley County is located southwest of the seven-county metro. It directly borders Scott, Carver, McLeod, Le Sueur, Renville, and
HOUSING IMPACT FEE NEXUS STUDY
 HOUSING IMPACT FEE NEXUS STUDY SUBMITTED TO City of Salinas January 2016 Prepared by VERNAZZA WOLFE ASSOCIATES, INC. www.vernazzawolfe.com 2909 Shasta Road Tel: (510) 548-8229 Berkeley, California 94708
Regional Snapshot: Affordable Housing
 Regional Snapshot: Affordable Housing Photo credit: City of Atlanta Atlanta Regional Commission, June 2017 For more information, contact: mcarnathan@atlantaregional.com Summary Home ownership and household
State of the Nation s Housing 2008: A Preview
 State of the Nation s Housing 28: A Preview Eric S. Belsky Remodeling Futures Conference April 15, 28 www.jchs.harvard.edu The Housing Market Has Suffered Steep Declines Percent Change Median Existing
A Tale of Two Canadas
 Centre for Urban and Community Studies Research Bulletin #2 August 2001 A Tale of Two Canadas Homeowners Getting Richer, Renters Getting Poorer Income and Wealth Trends in Toronto, Montreal and Vancouver,
CHAPTER 7 HOUSING. Housing May
 CHAPTER 7 HOUSING Housing has been identified as an important or very important topic to be discussed within the master plan by 74% of the survey respondents in Shelburne and 65% of the respondents in
Housing for the Region s Future
 Housing for the Region s Future Executive Summary North Texas is growing, by millions over the next 40 years. Where will they live? What will tomorrow s neighborhoods look like? How will they function
Washtenaw County Housing Affordability and Economic Equity - Analysis
 Washtenaw County Housing Affordability and Economic Equity - Analysis czb is an Alexandria, Virginia - based community planning practice specializing in econometric analysis, community engagement, and
Glenmont Sector Plan Staff Draft AFFORDABLE HOUSING ANALYSIS
 Glenmont Sector Plan Staff Draft AFFORDABLE HOUSING ANALYSIS November 1, 2012 Center for Research and Information Systems Montgomery County Planning Department M NCPPC Executive Summary The Glenmont Sector
Housing Affordability Versus Location Affordability
 Housing Affordability Versus Location Affordability The Rent s Too Damn High! But the Metrocard Is a Pretty Good Deal How much more would you pay for an apartment just a short walk from your job than for
Glenmont Sector Plan Staff Draft AFFORDABLE HOUSING ANALYSIS
 Glenmont Sector Plan Staff Draft AFFORDABLE HOUSING ANALYSIS UPDATED December 4, 2012 Center for Research and Information Systems Montgomery County Planning Department M-NCPPC Executive Summary The Glenmont
Ontario Rental Market Study:
 Ontario Rental Market Study: Renovation Investment and the Role of Vacancy Decontrol October 2017 Prepared for the Federation of Rental-housing Providers of Ontario by URBANATION Inc. Page 1 of 11 TABLE
Estimating National Levels of Home Improvement and Repair Spending by Rental Property Owners
 Joint Center for Housing Studies Harvard University Estimating National Levels of Home Improvement and Repair Spending by Rental Property Owners Abbe Will October 2010 N10-2 2010 by Abbe Will. All rights
A REPORT FROM THE OFFICE OF INTERNAL AUDIT
 A REPORT FROM THE OFFICE OF INTERNAL AUDIT PRESENTED TO THE CITY COUNCIL CITY OF BOISE, IDAHO AUDIT / TASK: AUDIT CLIENT: REPORT DATE: October 14, 2013 AUDIT GRADE: #13-04, Property Rehabilitation / Loan
Housing Market Update
 Housing Market Update September 2017 EXECUTIVE SUMMARY TIGHT HOUSING MARKET CONTINUES, REFLECTS LOW INVENTORY AND HIGHER PRICES Dean J. Christon, Executive Director September 2017 The trend continues in
Affordability. Housing that is Affordable, Not Affordable Housing. Neighborhoods NOW Conference November 10, 2016
 Housing that is Affordable, Not Affordable Housing Neighborhoods NOW Conference November 10, 2016 Prepared by Greenstreet Ltd. Greenstreet Ltd. All rights reserved 2016. At some point during the 2000s,
CHAPTER 2: HOUSING. 2.1 Introduction. 2.2 Existing Housing Characteristics
 CHAPTER 2: HOUSING 2.1 Introduction Housing Characteristics are related to the social and economic conditions of a community s residents and are an important element of a comprehensive plan. Information
Economic Impacts of MLS Home Sales and Purchases in Canada and the Provinces
 Economic Impacts of MLS Home Sales and Purchases in Canada and the Provinces 2006 2008 FINAL REPORT April 24, 2009 Economic Impacts of MLS Home Sales and Purchases in Canada and the Provinces 2006-2008
Housing Price Forecasts. Illinois and Chicago PMSA, August 2016
 Housing Price Forecasts Illinois and Chicago PMSA, August 2016 Presented To Illinois Association of Realtors From R E A L Regional Economics Applications Laboratory, Institute of Government and Public
Congressional District Report for the 115th Congress
 Congressional District Report for the 115th Congress New York District 22 Honorable Claudia Tenney (R) Congressional Districts of New York August 2018 Report National Association of REALTORS Q1/1980 Q3/1981