PROPERTY BAROMETER FNB House Price Index Year-on-year house price growth appears to be approaching a mini-peak, at 4.
|
|
|
- Georgina Rich
- 6 years ago
- Views:
Transcription


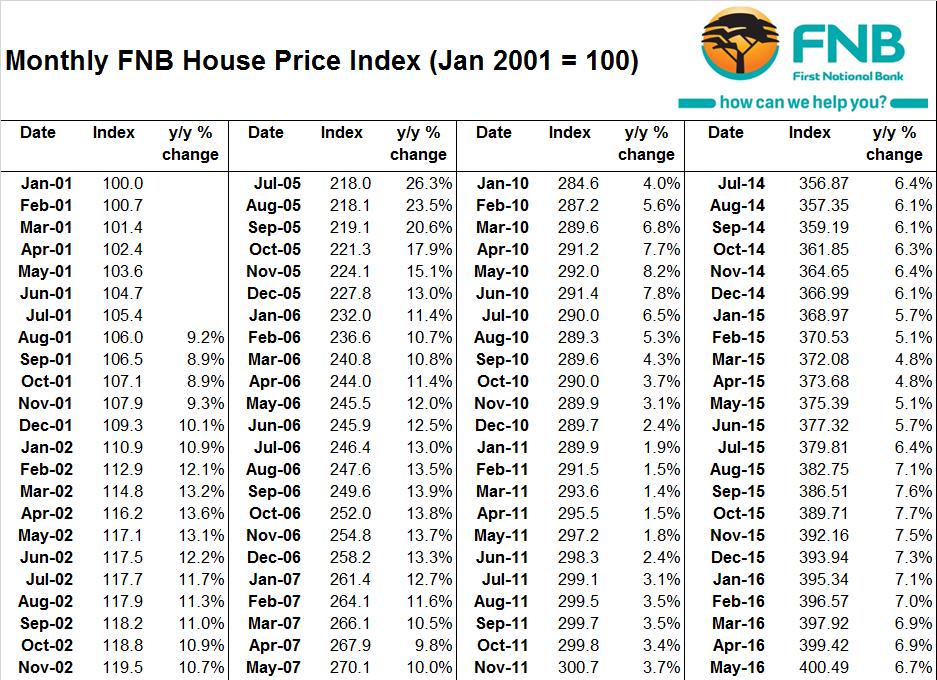
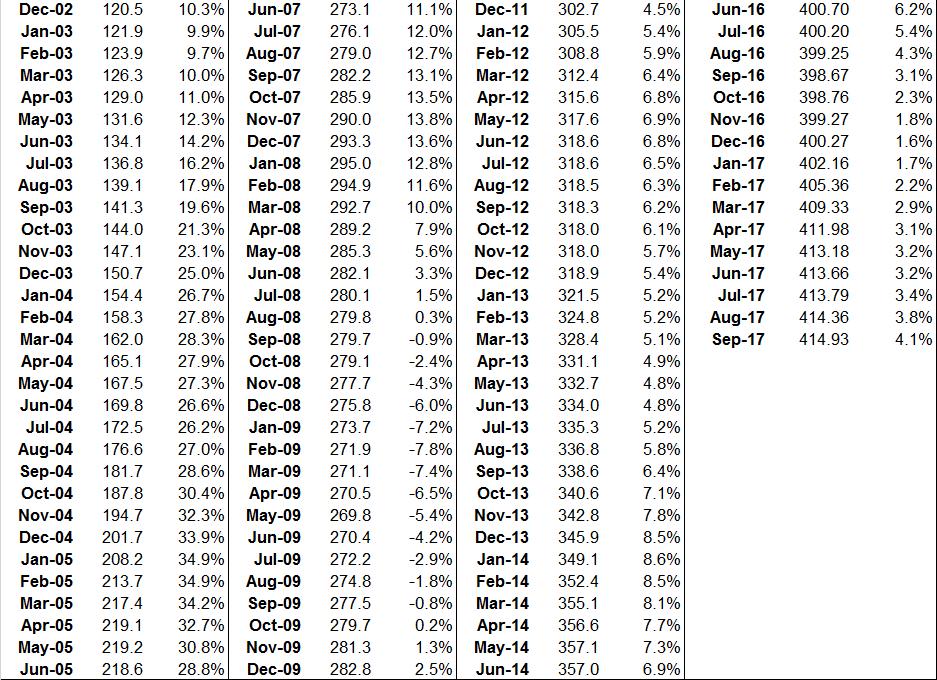
1 2 October 2017 MARKET ANALYTICS AND SCENARIO FORECASTING UNIT JOHN LOOS: HOUSEHOLD AND PROPERTY SECTOR STRATEGIST LIZE ERASMUS: STATISTICIAN The information in this publication is derived from sources which are regarded as accurate and reliable, is of a general nature only, does not constitute advice and may not be applicable to all circumstances. Detailed advice should be obtained in individual cases. No responsibility for any error, omission or loss sustained by any person acting or refraining from acting as a result of this publication is accepted by Firstrand Group Limited and / or the authors of the material. PROPERTY BAROMETER FNB House Price Index Year-on-year house price growth appears to be approaching a mini-peak, at 4.1% in September In September 2017, the FNB House Price Index showed a further mild acceleration in year-on-year growth compared with revised August growth. However, a better momentum indicator is the month-on-month seasonally adjusted growth calculation, and this points to renewed slowing, suggesting that with the customary lag the year-on-year price growth rate is also probably set to resume a slowing trend in the near term, constrained by an economy battling to achieve any meaningful growth. SEPTEMBER FNB HOUSE PRICE INDEX FINDINGS The FNB House Price Index for September 2017 rose by 4.1% year-on-year. This is a mild acceleration from the revised 3.8% for August. Backward revisions in recent months data points occur regularly, partly due to some raw data additions periodically, but mostly due to our application of light smoothing using a statistical smoothing function. In real terms, when adjusting for CPI (Consumer Price Index) inflation, the house price correction gradually continued, with the real rate of house price change remaining in negative territory to the tune of a -0.9% year-on-year decline in August (September CPI data not yet available). This is a diminished real house price deflation rate, however, from -1.1% year-on-year in July and from a low of -4.8% reached in December This diminished real price decline in August was due to the acceleration in the year-on-year house price inflation rate of that month from 3.4% in July to 3.8%. However, a slight rise in CPI inflation from 4.6% year-on-year in July to 4.8% in August partly offset the effect of the house price growth acceleration. The average price of homes transacted in September was R1,102,394. First National Bank a division of FirstRand Bank Limited. An Authorised Financial Services provider. Reg No. 1929/001225/06

2 SLOWING MONTH-ON-MONTH PRICE GROWTH TREND RESUMES However, while the year-on-year house price growth rate still shows mild acceleration, a better way to be up to date on most recent house price growth momentum is to view it on a month-on-month seasonally-adjusted basis. Calculating house price growth on this basis we see a resumption of the slowing price growth trend, which started in April 2017, after a very brief pause for a solitary month in August. The month-on-month house price growth rate was a lowly 0.13% for September, down from the prior month s 0.25% and now well-down on the 2017 high of 0.82% reached in March. This most recent month-on-month slowing house price growth trend once again broadly coincides with a marked dip in the Absa Manufacturing Sector Purchasing Managers Index (PMI), suggesting that it is reflective of a renewed economic dip after a brief economic growth improvement in the 2 nd quarter of 2017 which ended the prior 2-quarter recession. Not only does the recent slowing month-on-month house price growth rate point to possible renewed weakening in the economy, but also to the likelihood that year-on-year house price growth may soon begin to slow once more. If we annualize the most recent 0.13% month-on-month rate, it says to us that, in the hypothetical scenario of house price growth remaining at this September rate, in the next 12 months we would achieve a mere 1.61% growth in total over the period. It thus appears highly likely that low single-digit average house price growth will continue in the near term, and that the house price correction will continue in the form of a further price decline in real terms (adjusted for CPI) REMAINS ON COURSE TO BEING A SLOWER PRICE GROWTH YEAR THAN THE PREVIOUS 3. Viewing the bigger annual picture, the renewed slowing in month-on-month house price growth suggests to us that, despite a brief acceleration in monthly year-on-year house price growth in 2017 to above 4% in September, for the year as a whole we are likely to see average house price growth slower than that of the past 3 years (2014 recording 7% price growth, %, and %), with the year-to-date year-on-year average price growth sitting at 3.1%, and a -3.1% decline in real terms.

3 HOUSE PRICE CORRECTION WATCH LONGER RUN REAL HOUSE PRICE ADJUSTMENTS Examining the longer term real house price trends (house prices adjusted for CPI inflation), we see that the level as at August 2017 had lost -4.6% since a post-2008/9 recession high in December Looking a bit further back to the all-time real house price peak at the end of 2007 (at the end of the pre-2008 housing boom period), on a cumulative basis real house prices were -19.2% down on that high as at August However, looking back further, despite a mediocre performance in recent years, the average real price currently remains a massive 63.9% above the end-2000 level, around 16.5 years ago, and a time back just before boom-time price inflation started to accelerate rapidly. In nominal terms, when not adjusting for CPI inflation, the average house price in September 2017 was 318.0% above the end-2000 level. By comparison, consumer goods and services prices, as measured by the CPI, were only 154.7% higher over virtually the same period (up to August 2017 due to September CPI data not yet available).
4
5 ADDENDUM - NOTES: Note on The FNB Average House Price Index: Although also working on the average price principle (as opposed to median or repeat sales), the FNB House Price Index differs from a simple average house price index in that it could probably be termed a fixed weight average house price index. One of the practical problems we have found with house price indices is that relative short term activity shifts up and down the price ladder can lead to an average or median price index rising or declining where there was not necessarily genuine capital growth on homes. For example, if Full Title 3 Bedroom volumes remain unchanged from one month to the next, but Sectional Title 1 Bedroom and Less (the cheapest segment on average) transaction volumes hypothetically double, the overall national average price could conceivably decline due to this relative activity shift. This challenge of activity shifts between segments is faced by all constructors of house price indices. In an attempt to reduce this effect, we decided to fix the weightings of the FNB House Price Index s sub-segments in the overall national index. This, at best, can only be a partial solution, as activity shifts can still take place between smaller segments within the sub-segments. However, it does improve the situation. With our 2013 re-weighting exercise, we have begun to segment not only according to room number, but also to segment according to building size within the normal segments by room number, in order to further reduce the impact of activity shifts on average price estimates. The FNB House Price Index s main segments are now as follows: The weightings of the sub-segments are determined by their relative transaction volumes over the past 5 years, and will now change very slowly over time by applying a 5-year moving average to each new price data point. The sub-segments are: - Sectional Title: Less than 2 bedroom Large Less than 2 bedroom Medium Less than 2 bedroom Small 2 Bedroom Large 2 bedroom Medium 2 bedroom Small 3 Bedroom and More - Large 3 Bedroom and More - Medium 3 Bedroom and More - Small - Full Title: 2 Bedrooms and Less - Large 2 Bedrooms and Less - Medium 2 Bedrooms and Less - Small 3 Bedroom - Large 3 Bedroom - Medium 3 Bedroom - Small 4 Bedrooms and More - Large 4 Bedrooms and More - Medium 4 Bedrooms and More Small
6 The size cut-offs for small, medium and large differ per room number sub-segment. Large would refer to the largest one-third of homes within a particular room number segment over the past 5 year period, Medium to the middle one-third, and Small to the smallest one-third of homes within that segment. The Index is constructed using transaction price data from homes financed by FNB. The minimum size cut-off for full title stands is 200 square metres, and the maximum size is 4000 square metres The maximum price cut-off is R10m, and the lower price cut-off is R20,000 (largely to eliminate major outliers and glaring inputting errors). The index is very lightly smoothed using a Hodrick-Prescott smoothing function with a Lambda of 5.
1 February FNB House Price Index - Real and Nominal Growth
 1 February 2017 MARKET ANALYTICS AND SCENARIO FORECASTING UNIT JOHN LOOS: HOUSEHOLD AND PROPERTY SECTOR STRATEGIST 087-328 0151 john.loos@fnb.co.za THEO SWANEPOEL: PROPERTY MARKET ANALYST 087-328 0157
1 June FNB House Price Index - Real and Nominal Growth MAY FNB HOUSE PRICE INDEX FINDINGS
 1 June 2016 MARKET ANALYTICS AND SCENARIO FORECASTING UNIT JOHN LOOS: HOUSEHOLD AND PROPERTY SECTOR STRATEGIST 087-328 0151 john.loos@fnb.co.za THEO SWANEPOEL: PROPERTY MARKET ANALYST 087-328 0157 tswanepoel@fnb.co.za
2 July 2018 FNB HOUSE PRICE INDEX RESULTS FOR JUNE 2018 ACCELERATION, BUT FOR HOW LONG?
 2 July 2018 MARKET ANALYTICS AND SCENARIO FORECASTING UNIT JOHN LOOS: HOUSEHOLD AND PROPERTY SECTOR STRATEGIST 087-328 0151 john.loos@fnb.co.za THULANI LUVUNO: ANALYST 087-730 2254 thulani.luvuno@fnb.co.za
PROPERTY BAROMETER FNB House Price Index Early signs of the positive national sentiment shift impacting on national house price trends
 5 June 2018 MARKET ANALYTICS AND SCENARIO FORECASTING UNIT JOHN LOOS: HOUSEHOLD AND PROPERTY SECTOR STRATEGIST 087-328 0151 john.loos@fnb.co.za THULANI LUVUNO: ANALYST 087-730 2254 thulani.luvuno@fnb.co.za
PROPERTY BAROMETER Residential Property Affordability Review The recently improving Housing Affordability trend stalled in the 1 st quarter of 2017
 21 June 2017 MARKET ANALYTICS AND SCENARIO FORECASTING UNIT JOHN LOOS: HOUSEHOLD AND PROPERTY SECTOR STRATEGIST FNB HOME LOANS 087-328 0151 john.loos@fnb.co.za LIZE ERASMUS: STATISTICIAN 087-335 6664 lize.erasmus@@fnb.co.za
PROPERTY BAROMETER FNB Area Value Band House Price Indices
 PROPERTY BAROMETER FNB Area Value Band House Price Indices The Luxury Area Value Band has seen the most noticeable price growth slowdown since 2014, while the Lower End has done a little better of late.
16 April 2018 KEY POINTS
 16 April 2018 MARKET ANALYTICS AND SCENARIO FORECASTING UNIT JOHN LOOS: HOUSEHOLD AND PROPERTY SECTOR STRATEGIST FNB HOME LOANS 087-328 0151 john.loos@fnb.co.za THULANI LUVUNO: STATISTICIAN 087-730 2254
PROPERTY BAROMETER FNB Mining Towns House Price Indices
 PROPERTY BAROMETER FNB Mining Towns House Price Indices A return to positive growth in Mining production from the latter stages of 2016 and into 2017 appears to be providing some improved support to Mining
3 November rd QUARTER FNB SEGMENT HOUSE PRICE REVIEW. Affordability of housing
 3 November 2011 3 rd QUARTER FNB SEGMENT HOUSE PRICE REVIEW JOHN LOOS: HOUSEHOLD AND PROPERTY SECTOR STRATEGIST 011-6490125 John.loos@fnb.co.za EWALD KELLERMAN: PROPERTY MARKET ANALYST 011-6320021 ekellerman@fnb.co.za
6 April 2018 KEY POINTS
 6 April 2018 MARKET ANALYTICS AND SCENARIO FORECASTING UNIT JOHN LOOS: HOUSEHOLD AND PROPERTY SECTOR STRATEGIST 087-328 0151 john.loos@fnb.co.za THULANI LUVUNO: STATISTICIAN 087-730 2254 thulani.luvuno@fnb.co.za
14 September 2015 MARKET ANALYTICS AND SCENARIO FORECASTING UNIT. JOHN LOOS: HOUSEHOLD AND PROPERTY SECTOR STRATEGIST
 14 September 2015 MARKET ANALYTICS AND SCENARIO FORECASTING UNIT JOHN LOOS: HOUSEHOLD AND PROPERTY SECTOR STRATEGIST 087-328 0151 john.loos@fnb.co.za THEO SWANEPOEL: PROPERTY MARKET ANALYST 087-328 0157
FNB-TPN RESIDENTIAL YIELDS REVIEW
 FNB-TPN RESIDENTIAL YIELDS REVIEW 17 November 2015 John Loos, Household and Property Sector Strategist Tel: (087) 328 0151 Cell:083-453 8096 E-mail: john.loos@fnb.co.za Website: http://blog.fnb.co.za/category/economics/
3 October 2017 KEY POINTS
 3 October 2017 FNB HOME LOANS: MARKET ANALYTICS AND SCENARIO FORECASTING UNIT JOHN LOOS: HOUSEHOLD AND PROPERTY SECTOR STRATEGIST 087-328 0151 John.loos@fnb.co.za THEO SWANEPOEL: PROPERTY MARKET ANALYST
Smoothed Weighted National Housing Index (base = January 2008)
") HOUSING INDEX April 2013 Moderating House Prices 1 1 1 120 Smoothed Weighted National Housing Index (base = January 8) 174.2 119.9 Value Index Volume Index The FNB House Price Index regained some lost
HOUSING INDEX April 2013 Moderating House Prices 1 1 1 120 Smoothed Weighted National Housing Index (base = January 8) 174.2 119.9 Value Index Volume Index The FNB House Price Index regained some lost
Smoothed Weighted National Housing Index (base = January 2008)
") HOUSING INDEX May 2013 Decelerating Real House Prices 1 1 1 120 Smoothed Weighted National Housing Index (base = January 8) 1.2 107.0 Value Index Volume Index The FNB House Price Index regained some lost
HOUSING INDEX May 2013 Decelerating Real House Prices 1 1 1 120 Smoothed Weighted National Housing Index (base = January 8) 1.2 107.0 Value Index Volume Index The FNB House Price Index regained some lost
Residential building statistics 17 May 2018
 Compiled by Jacques du Toit Property Analyst Absa Home Loans 15 Troye Street Johannesburg 21 PO Box 7735 Johannesburg 2 South Africa Tel +27 ()11 35 7246 jacques@absa.co.za www.absa.co.za Explanatory note:
Smoothed Weighted National Housing Index (base = January 2008)
") HOUSING INDEX November 2012 New Housing Supply Soften House Prices 200 180 160 140 120 100 80 Smoothed Weighted National Housing Index (base = January 2008) 164.1 143.0 60 40 Value Index Volume Index Data
HOUSING INDEX November 2012 New Housing Supply Soften House Prices 200 180 160 140 120 100 80 Smoothed Weighted National Housing Index (base = January 2008) 164.1 143.0 60 40 Value Index Volume Index Data
Smoothed Weighted National Housing Index (base = January 2008)
") HOUSING INDEX February 2013 House Prices Remain Stubbornly High 1 1 1 120 Smoothed Weighted National Housing Index (base = January 8) 178.6 102.2 Value Index Volume Index The FNB House Price Index fell
HOUSING INDEX February 2013 House Prices Remain Stubbornly High 1 1 1 120 Smoothed Weighted National Housing Index (base = January 8) 178.6 102.2 Value Index Volume Index The FNB House Price Index fell
Residential building statistics 15 February 2018
 Compiled by Jacques du Toit Property Analyst Absa Home Loans 15 Troye Street Johannesburg 21 PO Box 7735 Johannesburg 2 South Africa Tel +27 ()11 35 7246 jacques@absa.co.za www.absa.co.za Explanatory note:
Economic Highlights. Retail Sales Components 1. University of Michigan Consumer Sentiment Index 2. Industrial Production and Capacity Utilization 3
 November 17, 2010 Economic Highlights Consumer Spending Retail Sales Components 1 University of Michigan Consumer Sentiment Index 2 Manufacturing Industrial Production and Capacity Utilization 3 Real Estate
Performance of the Private Rental Market in Northern Ireland
 Summary Research Report July - December Performance of the Private Rental Market in Northern Ireland Research Report July - December 1 Northern Ireland Rental Index: Issue No. 8 Disclaimer This report
Residential May Karl L. Guntermann Fred E. Taylor Professor of Real Estate. Adam Nowak Research Associate
 Residential May 2008 Karl L. Guntermann Fred E. Taylor Professor of Real Estate Adam Nowak Research Associate The use of repeat sales is the most reliable way to estimate price changes in the housing market
Cycle Monitor Real Estate Market Cycles Third Quarter 2017 Analysis
 Cycle Monitor Real Estate Market Cycles Third Quarter 2017 Analysis Real Estate Physical Market Cycle Analysis of Five Property Types in 54 Metropolitan Statistical Areas (MSAs). Income-producing real
2013 Arizona Housing Market Mid-Year Report
 2013 Arizona Housing Market Mid-Year Report This mid-year market report outlines the latest trends in Arizona real estate. The housing market hit bottom in mid to late 2011, and has been in recovery mode
San Francisco Housing Market Update
 San Francisco Housing Market Update California Economic and Housing Market Outlook The national economy maintained a healthy growth rate in the first quarter of 2005 and appeared to be settling in for
Residential December 2010
 Residential December 2010 Karl L. Guntermann Fred E. Taylor Professor of Real Estate Adam Nowak Research Associate I The preliminary data for November shows that housing prices declined for another month
Residential July 2010
 Residential July 2010 Karl L. Guntermann Fred E. Taylor Professor of Real Estate Adam Nowak Research Associate The Phoenix housing market overall continued to show gradual improvement through June but
Nothing Draws a Crowd Like a Crowd: The Outlook for Home Sales
 APRIL 2018 Nothing Draws a Crowd Like a Crowd: The Outlook for Home Sales The U.S. economy posted strong growth with fourth quarter 2017 Real Gross Domestic Product (real GDP) growth revised upwards to
PROPERTY BAROMETER FNB City of Cape Town House Price Indices
 13 November 2017 MARKET ANALYTICS AND SCENARIO FORECASTING UNIT JOHN LOOS: HOUSEHOLD AND PROPERTY SECTOR STRATEGIST 087-328 0151 john.loos@fnb.co.za LIZE ERASMUS STATISTICIAN 087-335 6664 lize.erasmus@@fnb.co.za
Linkages Between Chinese and Indian Economies and American Real Estate Markets
 Linkages Between Chinese and Indian Economies and American Real Estate Markets Like everything else, the real estate market is affected by global forces. ANTHONY DOWNS IN THE 2004 presidential campaign,
Smoothed Weighted National Housing Index (base = January 2008)
") HOUSING INDEX January 2014 Rising Volumes Decelerate House Prices For Now 220 200 180 160 1 120 100 80 60 Smoothed Weighted National Housing Index (base = January 2008) Value Index Volume Index Although
HOUSING INDEX January 2014 Rising Volumes Decelerate House Prices For Now 220 200 180 160 1 120 100 80 60 Smoothed Weighted National Housing Index (base = January 2008) Value Index Volume Index Although
RESIDENTIAL PROPERTY PRICE INDEX (RPPI)
") EUROSYSTEM RESIDENTIAL PROPERTY PRICE INDEX (RPPI) 2017Q1 Residential property prices continued to increase moderately in 2017Q1 1 The RPPI (houses and apartments) recorded the third consecutive marginal
EUROSYSTEM RESIDENTIAL PROPERTY PRICE INDEX (RPPI) 2017Q1 Residential property prices continued to increase moderately in 2017Q1 1 The RPPI (houses and apartments) recorded the third consecutive marginal
Residential January 2010
 Residential January 2010 Karl L. Guntermann Fred E. Taylor Professor of Real Estate Adam Nowak Research Associate Another improvement to the ASU-RSI is introduced this month with new indices for foreclosure
Housing Price Forecasts. Illinois and Chicago PMSA, January 2019
 Housing Price Forecasts Illinois and Chicago PMSA, January 2019 Presented To Illinois Realtors From R E A L Regional Economics Applications Laboratory, Institute of Government and Public Affairs University
ECONOMIC CURRENTS. Vol. 5 Issue 2 SOUTH FLORIDA ECONOMIC QUARTERLY. Key Findings, 2 nd Quarter, 2015
 ECONOMIC CURRENTS THE Introduction SOUTH FLORIDA ECONOMIC QUARTERLY Economic Currents provides an overview of the South Florida regional economy. The report presents current employment, economic and real
Multifamily Market Commentary February 2018
 Multifamily Market Commentary February 2018 2018 Multifamily Affordable Market Outlook A Long Way to Go Momentum in the overall multifamily sector will likely slow in 2018 due to elevated levels of new
Estimating National Levels of Home Improvement and Repair Spending by Rental Property Owners
 Joint Center for Housing Studies Harvard University Estimating National Levels of Home Improvement and Repair Spending by Rental Property Owners Abbe Will October 2010 N10-2 2010 by Abbe Will. All rights
Residential March 2010
 Residential March 2010 Karl L. Guntermann Fred E. Taylor Professor of Real Estate Adam Nowak Research Associate The latest data for December 2009 reveals that overall house prices declined by 13 percent
Residential January 2009
 Residential January 2009 Karl L. Guntermann Fred E. Taylor Professor of Real Estate Adam Nowak Research Associate Methodology The use of repeat sales is the most reliable way to estimate price changes
Housing Markets: Balancing Risks and Rewards
 Housing Markets: Balancing Risks and Rewards October 14, 2015 Hites Ahir and Prakash Loungani International Monetary Fund Presentation to the International Housing Association VIEWS EXPRESSED ARE THOSE
California Housing Market Update. Monthly Sales and Price Statistics May 2018
 California Housing Market Update Monthly Sales and Price Statistics May 2018 Sales Lost Momentum as Mortgage Rates Continued to Climb California, May 2018 Sales: 409,270 Units, +0.3% YTD, -4.6% YTY 700,000
PROPERTY BAROMETER FNB City of Cape Town House Price Indices
 16 February 2018 MARKET ANALYTICS AND SCENARIO FORECASTING UNIT JOHN LOOS: HOUSEHOLD AND PROPERTY SECTOR STRATEGIST 087-328 0151 john.loos@fnb.co.za THULANI LUVUNO STATISTICIAN 087-730 2254 thulani.luvuno@@fnb.co.za
Mueller. Real Estate Market Cycle Monitor Third Quarter 2018 Analysis
 Mueller Real Estate Market Cycle Monitor Third Quarter 2018 Analysis Real Estate Physical Market Cycle Analysis - 5 Property Types - 54 Metropolitan Statistical Areas (MSAs). It appears mid-term elections
PROPERTY BAROMETER FNB City of Cape Town House Price Indices
 19 July 2017 MARKET ANALYTICS AND SCENARIO FORECASTING UNIT JOHN LOOS: HOUSEHOLD AND PROPERTY SECTOR STRATEGIST 087-328 0151 john.loos@fnb.co.za LIZE ERASMUS STATISTICIAN 087-335 6664 lize.erasmus@@fnb.co.za
FNB PROPERTY BAROMETER
 HOME LOANS DIVISION FNB PROPERTY BAROMETER 4 TH Quarter 2009 - Ending the last decade on a strengthening note, but financial stress and affordability issues are far from over PROPERTY AND MORTGAGE MARKET
Residential September 2010
 Residential September 2010 Karl L. Guntermann Fred E. Taylor Professor of Real Estate Adam Nowak Research Associate For the first time since March, house prices turned down slightly in August (-2 percent)
Residential August 2009
 Residential August 2009 Karl L. Guntermann Fred E. Taylor Professor of Real Estate Adam Nowak Research Associate Summary The latest data for May 2009 reveals that house prices declined by 33 percent in
An Introduction to RPX INTRODUCTION
 An Introduction to RPX INTRODUCTION Radar Logic is a real estate information company based in New York. We convert public residential closing data into information about the state and prospects for the
ECONOMIC CURRENTS. Vol. 4, Issue 3. THE Introduction SOUTH FLORIDA ECONOMIC QUARTERLY
 ECONOMIC CURRENTS THE Introduction SOUTH FLORIDA ECONOMIC QUARTERLY Vol. 4, Issue 3 Economic Currents provides an overview of the South Florida regional economy. The report presents current employment,
HOUSING MARKETS. Strength in Early 2005 Pushed Most National Housing Indicators into Record Territory
 HOUSING MARKETS Despite another record-setting performance, housing markets showed clear signs of cooling late in 2005. As mortgage interest rates moved up and house prices soared, home sales turned down
Housing Bulletin Monthly Report
 February 21 1 Housing Bulletin Monthly Report Housing Starts 25, 2, 15, 1, 5, Alberta Housing Starts up 5 per cent from 29 From February 29 to 21, preliminary housing starts increased 82.7 per cent across
REGIONAL. Rental Housing in San Joaquin County
 Lodi 12 EBERHARDT SCHOOL OF BUSINESS Business Forecasting Center in partnership with San Joaquin Council of Governments 99 26 5 205 Tracy 4 Lathrop Stockton 120 Manteca Ripon Escalon REGIONAL analyst april
2015 First Quarter Market Report
 2015 First Quarter Market Report CAAR Member Copy Expanded Edition Charlottesville Area First Quarter 2015 Highlights: Median sales price for the region was up 5.1% over Q1-2014, rising from $244,250 to
Multifamily Market Commentary February 2017
 Multifamily Market Commentary February 2017 Affordable Multifamily Outlook Incremental Improvement Expected in 2017 We expect momentum in the overall multifamily sector to slow in 2017 due to elevated
Housing Market Cycles
 MEGA AGENT Market Update Gary Keller and Jay Papasan 2 The U.S. Housing Market Keller Williams Realty, Inc. Housing Market Cycles 4 The U.S. Housing Market Housing Market Cycles 5 The U.S. Housing Market
Hamilton s Housing Market and Economy
 Hamilton s Housing Market and Economy Growth Indicator Report November 2016 hamilton.govt.nz Contents 3. 4. 5. 6. 7. 7. 8. 9. 10. 11. Introduction New Residential Building Consents New Residential Sections
Residential December 2009
 Residential December 2009 Karl L. Guntermann Fred E. Taylor Professor of Real Estate Adam Nowak Research Associate Year End Review The dramatic decline in Phoenix house prices caused by an unprecedented
Trends in Scottish Residential Lettings
 The Citylets Report Issue 1 Spring 2007 Trends in Scottish Residential tings A Tale of Three Cities Introduction citylets.co.uk is Scotland s original residential lettings portal advertising over 45,000
Cycle Forecast Real Estate Market Cycles First Quarter 2019 Estimates
 Black Creek Research Cycle Forecast Real Estate Market Cycles First Quarter 0 Estimates Gross Domestic Product (GDP) is expected to grow.% in 0 due to new tax legislation and.% in 0. Employment growth
Rapid recovery from the Great Recession, buoyed
 Game of Homes The Supply-Demand Struggle Laila Assanie, Sarah Greer, and Luis B. Torres October 4, 2016 Publication 2143 Rapid recovery from the Great Recession, buoyed by the shale oil boom, has fueled
RESIDENTIAL PROPERTY PRICE INDEX (RPPI)
") EUROSYSTEM RESIDENTIAL PROPERTY PRICE INDEX (RPPI) 2017Q2 Moderate recovery in the Residential Property Price Index 1 The RPPI (houses and apartments) recorded an increase of 0,5% on a quarterly basis
EUROSYSTEM RESIDENTIAL PROPERTY PRICE INDEX (RPPI) 2017Q2 Moderate recovery in the Residential Property Price Index 1 The RPPI (houses and apartments) recorded an increase of 0,5% on a quarterly basis
In the Eye of the Storm: An Update on Pennsylvania Housing Prices
 BRIEFING PAPER In the Eye of the Storm: An Update on Pennsylvania Housing Prices Mark Price The Keystone Research Center Harrisburg, Pennsylvania September 2008 KRC BRIEFING PAPER In the Eye of the Storm:
HOUSING MARKET OUTLOOK Greater Toronto Area
 H o u s i n g M a r k e t I n f o r m a t i o n HOUSING MARKET OUTLOOK Greater Toronto Area C a n a d a M o r t g a g e a n d H o u s i n g C o r p o r a t i o n Date Released: Spring 2013 Table of Contents
Housing and Economy Market Trends
 Housing and Economy Market Trends Mainstreet Organization Prices of single-family, detached homes in suburban Chicago increased 12.1 percent in May 2014 compared with the same period a year ago. Overall,
Change on the Horizon:
 Change on the Horizon: An overview of the economy and its impact on commercial real estate By Elliot M. Shirwo, Founder and Principal BridgeCore Capital, Inc. Commercial real estate is intrinsically linked
Minneapolis St. Paul Residential Real Estate Index
 University of St. Thomas Minneapolis St. Paul Residential Real Estate Index Welcome to the latest edition of the UST Minneapolis St. Paul Residential Real Estate Index. The University of St Thomas Residential
California Housing Market Update. Monthly Sales and Price Statistics October 2018
 California Housing Market Update Monthly Sales and Price Statistics October 2018 Sales Had the 2 nd Largest Drop in the Last 6 Months California, October 2018 Sales: 397,060 Units, -3.7% YTD, -7.9% YTY
MARKET IN A MINUTE A SUMMARY OF MARKET CONDITIONS FOR SEPTEMBER & 3rd QUARTER 2017
 STATPAK LOUDOUN COUNTY OCTOBER 2017 McEnearney.com MARKET IN A MINUTE A SUMMARY OF MARKET CONDITIONS FOR SEPTEMBER & 3rd QUARTER 2017 Contract activity in September 2017 was up just 0.6% from September
STATPAK MARKET IN A MINUTE A SUMMARY OF MARKET CONDITIONS FOR JANUARY McEnearney.com CONTRACTS URGENCY INDEX INVENTORY INTEREST RATES
 STATPAK LOUDOUN COUNTY FEBRUARY 2018 McEnearney.com MARKET IN A MINUTE A SUMMARY OF MARKET CONDITIONS FOR JANUARY 2018 Contract activity in January 2018 was down just 2.0% from January 2017, but that is
Housing Market Update
 Housing Market Update September 2017 EXECUTIVE SUMMARY TIGHT HOUSING MARKET CONTINUES, REFLECTS LOW INVENTORY AND HIGHER PRICES Dean J. Christon, Executive Director September 2017 The trend continues in
820 First Street, NE, Suite 510, Washington, DC Tel: Fax:
 820 First Street, NE, Suite 510, Washington, DC 20002 Tel: 202-408-1080 Fax: 202-408-1056 center@cbpp.org www.cbpp.org March 16, 2004 HUD S RELIANCE ON RENT TRENDS FOR HIGH-END APARTMENTS TO CRITICIZE
THE REAL ESTATE BOARD OF NEW YORK
 THE REAL ESTATE BOARD OF NEW YORK REAL ESTATE BROKER CONFIDENCE INDEX FIRST QUARTER 2018 EXECUTIVE SUMMARY The Real Estate Board of New York s (REBNY) Real Estate Broker Index for the first quarter of
Focus article: Metropolitan and rural housing market developments
 Focus article: Metropolitan and rural housing market developments Introduction The upswing in the South African residential property market which started around was driven by a wide range of economic,
ARLA Members Survey of the Private Rented Sector
 Prepared for The Association of Residential Letting Agents & the ARLA Group of Buy to Let Mortgage Lenders ARLA Members Survey of the Private Rented Sector Fourth Quarter 2010 Prepared by: O M Carey Jones
Sales Ratio: Alternative Calculation Methods
 For Discussion: Summary of proposals to amend State Board of Equalization sales ratio calculations June 3, 2010 One of the primary purposes of the sales ratio study is to measure how well assessors track
TEXAS HOUSING INSIGHT
 TEXAS HOUSING INSIGHT JAMES P. GAINES CHIEF ECONOMIST WESLEY MILLER RESEARCH ASSOCIATE PAIGE WOODSON RESEARCH INTERN LUIS B. TORRES RESEARCH ECONOMIST 2 1 2 0 REPORTING AUGUST 2018 DATA TECHNICAL REPORT
CITI HABITATS. Manhattan Residential Sales Market Report
 Manhattan Residential Sales Market Report Contents 4/7 12/17 3 8 9 10 Market Wide 4 Sales / Days on Market 5 / Months of Supply 6 7 Market Share Resale Co-ops Resale Condos New Developments 11 Luxury Neighborhoods
REAL ESTATE SENTIMENT INDEX 2 nd Quarter 2018
 About Real Estate Sentiment Index (RESI) The Real Estate Sentiment Index (RESI) is jointly developed by the Real Estate Developers Association of Singapore (REDAS) and the Department of Real Estate (DRE),
5 RENTAL AFFORDABILITY
 5 RENTAL AFFORDABILITY While affordability has improved somewhat, the share of renter households with cost burdens remains well above levels in 21. Although picking up since 211, renter incomes still lag
Construction Outlook: Major construction to further build on high base of activity
 SUNDAY 2 DECEMBER 2018 Construction Outlook: Major construction to further build on high base of activity Building on a high base, Australia s leading construction companies are projecting further expansion
Residential Commentary - Perth Apartment Market
 Residential Commentary - Perth Apartment Market March 2016 Executive Summary The Greater Perth apartment market has attracted considerable interest from local and offshore developers. Projects under construction
Economic Highlights. Payroll Employment Growth by State 1. Durable Goods 2. The Conference Board Consumer Confidence Index 3
 August 26, 2009 Economic Highlights Southeastern Employment Payroll Employment Growth by State 1 Manufacturing Durable Goods 2 Consumer Spending The Conference Board Consumer Confidence Index 3 Real Estate
Housing and Mortgage Market Update
 Housing and Mortgage Market Update Views from the Top Frank E. Nothaft Vice President and Chief Economist January 8, 2015 Summary: Housing & Mortgage Market Outlook for 2015 Interest rates expected to
RESIDENTIAL PROPERTY PRICE INDEX (RPPI)
") EUROSYSTEM RESIDENTIAL PROPERTY PRICE INDEX (RPPI) Q3 The Residential Property Price Index continued to recover 1 The RPPI (houses and apartments) increased by 0,4% in Q3 1, its fifth consecutive quarterly
EUROSYSTEM RESIDENTIAL PROPERTY PRICE INDEX (RPPI) Q3 The Residential Property Price Index continued to recover 1 The RPPI (houses and apartments) increased by 0,4% in Q3 1, its fifth consecutive quarterly
TREND Economic and Market Watch Report. Index
 TREND Economic and Watch Report TREND is the Multiple Listing Service (MLS) for more than 32,000 real estate professionals in and around the Philadelphia metropolitan region. TREND s 13-county primary
HOUSING MARKET OUTLOOK St. John s CMA
 H o u s i n g M a r k e t I n f o r m a t i o n HOUSING MARKET OUTLOOK St. John s CMA C a n a d a M o r t g a g e a n d H o u s i n g C o r p o r a t i o n Date Released: Fall 2014 Highlights New home
Survey of Emerging Market Conditions
 Survey of Emerging Market Conditions Quarter 1 2008 Preview Edition Published March 18, 2008 Lead Researcher and Analyst Dr. Wayne R. Archer, Executive Director University of Florida Bergstrom Center for
2018 Housing Market Outlook. Central Coast Realty Group Business Symposium February 22, 2018 Oscar Wei Senior Economist
 2018 Housing Market Outlook Central Coast Realty Group Business Symposium February 22, 2018 Oscar Wei Senior Economist Overview Economic Update California Housing Market Outlook Regional Housing Market
ECONOMIC CURRENTS. Vol. 3, Issue 3 SOUTH FLORIDA ECONOMIC QUARTERLY. Introduction
 ECONOMIC CURRENTS THE Introduction SOUTH FLORIDA ECONOMIC QUARTERLY Economic Currents provides an overview of the South Florida regional economy. The report presents current employment, economic and real
Housing Price Forecasts. Illinois and Chicago PMSA, March 2016
 Housing Price Forecasts Illinois and Chicago PMSA, March 2016 Presented To Illinois Association of Realtors From R E A L Regional Economics Applications Laboratory, Institute of Government and Public Affairs
Journal of the Statistical and Social Inquiry Society of Ireland Vol. XXXIV. (read before the Society, 14 April 2005)
") Journal of the Statistical and Social Inquiry Society of Ireland Vol. XXXIV SYMPOSIUM ON THE IRISH HOUING MARKET: ISSUES AND PROSPECTS (read before the Society, 14 April 2005) Abstract The housing sector
Journal of the Statistical and Social Inquiry Society of Ireland Vol. XXXIV SYMPOSIUM ON THE IRISH HOUING MARKET: ISSUES AND PROSPECTS (read before the Society, 14 April 2005) Abstract The housing sector
Cycle Monitor Real Estate Market Cycles Second Quarter 2018 Analysis
 Black Creek Research Cycle Monitor Real Estate Market Cycles Second Quarter 0 Analysis Real Estate Market Cycle analysis of five property types in Metropolitan Statistical Areas (MSAs). Important note:
Quarterly Housing Market Update
 Quarterly Housing Market Update An Overview New Hampshire s current housing market performance, as well as its overall economy, is slowly improving, with positives such as increasing employment and rising
INLAND EMPIRE REGIONAL INTELLIGENCE REPORT
 INLAND EMPIRE REGIONAL INTELLIGENCE REPORT June 2016 EMPLOYMENT After a slow start to 2016, the Inland Empire s labor market returned to form, in recent job figures. Seasonally adjusted nonfarm employment
State of the Nation s Housing 2008: A Preview
 State of the Nation s Housing 28: A Preview Eric S. Belsky Remodeling Futures Conference April 15, 28 www.jchs.harvard.edu The Housing Market Has Suffered Steep Declines Percent Change Median Existing
FY General Revenue Forecast Presentation
 FY 2015-2019 General Revenue Forecast Presentation Steven A. Solomon Director of Finance February 18, 2014 Overview Current Economic Outlook National State Local FY 2014 2nd Quarter Revenue Update Five
Housing Price Forecasts. Illinois and Chicago PMSA, October 2014
 Housing Price Forecasts Illinois and Chicago PMSA, October 2014 Presented To Illinois Association of Realtors From R E A L Regional Economics Applications Laboratory, Institute of Government and Public
Orange County Multifamily
 MARKET REPORT / Orange County Multifamily Employment Gains Driving Rental Demand, Low Vacancy Rates More than 2,600 units have come online to this point in, and nearly 5,000 apartments are currently under
Research. A Capital Value production. An analysis of the Dutch residential (investment) market 2018
 market 2018") Research A Capital Value production An analysis of the Dutch residential (investment) market 2018 Summary Never before has so much capital been invested in Dutch rented housing. In 2017, a total of 5.5
Research A Capital Value production An analysis of the Dutch residential (investment) market 2018 Summary Never before has so much capital been invested in Dutch rented housing. In 2017, a total of 5.5
Vesteda Market Watch Q
 Vesteda Market Watch Q1 2018 7.6 Housing Market Indicator 1 Housing Market Indicator The Housing Market Indicator in the first quarter of 2018 hits a level of 7.6. This score clearly reflects the positive