TABLE OF CONTENTS. Project Analysis A-1. Findings F-1. Public Hearing and Communications P-1
|
|
|
- Ross Gaines
- 6 years ago
- Views:
Transcription


1
2 CPC CA TABLE OF CONTENTS Project Analysis A-1 Summary Background Proposed Ordinance Discussion of Key Issues Conclusion Findings F-1 General Plan/Charter Findings CEQA Findings Public Hearing and Communications P-1 Summary of Public Hearing Testimony and Communications Working Group Participation Exhibits: A Proposed Ordinance B Environmental Clearance C Affordable Housing Linkage Fee Nexus Study D Changes from September 21 st Draft Ordinance
3 CPC CA A-1 PROJECT ANALYSIS SUMMARY The City of Los Angeles has been facing an escalating housing crisis for the last 40 years and retains an unfortunate distinction as the most unaffordable city in the in the country. However, Los Angeles remains one of only a handful of cities with high housing costs that does not have either a permanent source of local funding for affordable housing or an inclusionary housing policy. This report recommends the adoption of an Affordable Housing Linkage Fee (AHLF) pursuant to the attached ordinance (Exhibit A). The ordinance was drafted based on the results of the Affordable Housing Linkage Fee Nexus Study that was recently completed by urban economics consultant BAE Economics (Exhibit C). The Nexus Study examines the relationship between new development and the demand for affordable housing and estimates the cost of mitigating the new affordable housing demand attributable to new development. A detailed economic impact analysis in the study indicates that a modest linkage fee would not materially affect the prospects for continued development of new residential or commercial buildings. Staff recommends that the City Planning Commission consider adopting a housing linkage fee policy, with a proposed fee level of $5.00 per square foot on office, hotel, retail and warehouse/distribution uses and $12.00 per square foot on residential uses. The goal of the proposed ordinance is to establish such a fee in order to provide a permanent, dedicated source of funding for affordable housing. Several additional provisions have been added to the ordinance, based on input received from stakeholders and members of the public (see Exhibit D). BACKGROUND The need for more affordable housing in Los Angeles is immense and more critical than it has ever been. Gaps between wages and incomes are the highest of any large city in the country. Despite the growing need, funding for affordable housing in Los Angeles, as in most California cities, has declined dramatically in recent years - almost 70% since Today, the City receives only about $30 million a year for affordable housing projects, largely from outside funding sources. This means that many potential projects are unable to obtain assistance and move forward expeditiously. With redevelopment and inclusionary zoning also severely curtailed, it is necessary for cities to be creative and employ a range of affordable housing strategies. A November 2015 report by the City Controller found that the City of Los Angeles collects far fewer development impact fees than other comparable West Coast cities. Many cities have instituted fees on commercial and/or market-rate residential development that are used solely to help build affordable housing for lower-income residents (San Diego, Oakland, San Francisco, Sacramento, Boston, Seattle and others). The fees are justified due to the link, or nexus, between new developments and the demand for affordable housing they create through added low-wage workers.
4 CPC CA A-2 In October 2015, Mayor Eric Garcetti announced support for an effort to implement an affordable housing impact fee to establish a new dedicated stream of funding for affordable housing activities. This followed several Council motions in recent years requesting reports on options to produce and fund more affordable housing. 1 In response, the Housing and Community Investment Department (HCIDLA) issued a Nov. 17, 2015 report that recommended a linkage fee as the preferred housing funding strategy. In addition, the City Administrative Officer and Chief Legislative Analyst recommended the creation of a linkage fee nexus study as part of the 2015 Comprehensive Homeless Strategy adopted on January 27, The measure was adopted as a priority strategy by the City Council s Homelessness and Poverty Committee. What is a Linkage Fee? Housing linkage fees are a type of development impact fees assessed on new construction of commercial and residential buildings to mitigate the impact of the additional demand for affordable housing caused by such activity. New construction creates new jobs in a given location, some of which will have wage levels that qualify households as low or moderate income. As a result, the demand for affordable housing in the city increases. Due to the gap between development costs and operating income of affordable housing, new affordable housing must otherwise be subsidized by public funding. Based on a nexus study that examines the relationship between affordable housing and new development, a fee is established that requires developers of new buildings to contribute to a dedicated fund to offset a portion of the needed subsidy. Nexus Study To assist in the development of this draft ordinance, the City contracted with BAE Urban Economics in April 2016 to prepare the Affordable Housing Linkage Fee Nexus Study. The subconsultants Placeworks hosted three working group meetings of key leaders in the business, development, and affordable housing communities throughout the development of the study. The Nexus Study was completed in September Its primary aim was to determine the relationship that exists between new development and the demand for new affordable housing. It follows a methodology used successfully by other cities and conforms to the California Mitigation Fee Act. The study also includes detailed research on best practices from other cities and analyzed economic feasibility criteria for a variety of development types. Information on similar policies in other cities is summarized in Appendices A and D of the Nexus Study (Exhibit C). The methodology for establishing the legal nexus between different types of new development and affordable housing differs between residential and nonresidential projects. The nonresidential analysis relies upon establishing the density of low wage workers in different industries in Los Angeles, linking those industries with different commercial land uses and then calculating the financing needed to create affordable housing units for workers expected with the new development. The nexus analysis for residential projects relies on IMPLAN, an econometric tool that allows for estimating the number of low wage jobs created as the result of higher local 1 Council Files S1, S34 and S123, and
5 CPC CA A-3 spending by new market-rate households. The new low wage jobs are then translated to the gap cost of providing affordable housing. The analysis established a legal nexus for a linkage fee in the range of $42 to $74 per square foot for residential and $118 to $309 for nonresidential, well above what would be economically feasible for many projects to sustain. To establish economically feasible fee levels in a diverse city like Los Angeles, the study divided the city into three market areas - low, medium and high. It also looked at different development types - office, retail, industrial, warehouse/construction, medical, and institutional as well as multifamily rental, condo, single-family attached, and singlefamily detached. The Nexus Study used market information to test the feasibility of different fees for different types of projects across the City. Feasible fee levels were generally found to vary from $5 to $35 per square foot for nonresidential and $19 to $49 per square foot for residential (depending on the market and type of project). Projects in the low market area were found to not afford any fee, meaning that they were already deemed to be infeasible by the model, prior to any fee. Generally, the Nexus Study found residential development able to support a higher fee than nonresidential. Because the fees are designed to apply citywide, including weaker market areas, the recommended fees set forth in the proposed ordinance are lower than those supported by the Nexus Study s feasibility analysis. The lower proposed fee amounts have the additional benefit of being more supportable during all market cycles, and not only during the current environment with relatively high rents and sales prices. PROPOSED ORDINANCE The proposed ordinance (Exhibit A) amends Chapter II of the LAMC to establish the Affordable Housing Linkage Fee (Section 21.18), a fee levied on new development to mitigate that development s impact on affordable housing. It also amends Chapter 172 of the Administrative Code to create a Housing Impact Trust Fund to receive and disburse revenues collected as a result of the Linkage Fee. The proposed fee schedule is $5 per square foot for commercial (nonresidential) use, and $12 per square foot for residential use. The fee would apply to projects creating floor area of resulting in a change of use to residential. Deductions or credits would be subtracted from the total fee amount for certain project types meeting established policy criteria, as described below. The attached draft ordinance proposes that the fee would become effective three months after adoption. An annual adjustment for inflation according to the change in the Consumer Price Index for all Urban Consumers (CPI-U) is also proposed. Exemptions The draft ordinance provides for targeted waivers and exemptions to accommodate categories of projects where the fee may have unintended negative consequences or to align with policy priorities of the City. The proposed fee would not apply to any of the following types of development:
6 CPC CA A-4 Small Multifamily Buildings. Multifamily buildings with 5 or fewer units. These building types are often produced by smaller builders with lower profit margins. When built in lower- and middle-income neighborhoods, they often provide an affordable typology. Thresholds for Single-Family Home Additions or New Construction. New construction of or addition to a single-family detached home resulting in an increase of less than 2,000 square feet. Small Commercial Projects/Mixed-Use. Nonresidential development with less than 25,000 square feet of new floor area. Retail Required by City Policy. Any nonresidential floor area required by the Department of City Planning through a zoning ordinance, Specific Plan, Community Plan, Pedestrian Overlay Zone, or other set of development standards. Affordable Housing. Residential projects that include a certain percentage of affordable units (40% moderate, 20% low-income or 11% very low-income). Such projects would be subject to a No Net Loss provision consistent with State density bonus law). Public/Institutional Projects. Any project developed by an institutional or government entity. Accessory Dwelling Units (ADUs), a.k.a. Second Dwelling Units. ADUs are typically small structures that provide a unique housing typology, often reserved for family members, students, elderly and the disabled. They are typically some of the most affordable housing in the neighborhoods they are located. Grocery Stores. Any grocery store, defined as a Retail Use of which greater than one half of the floor area is devoted to the sale of food items intended for consumption or use off the premises, excluding alcoholic beverages. Historic-Cultural Monuments. Any adaptive reuse project that is a designated Historic-Cultural Monument, when it is being converted to a residential use. Three additional exemptions are proposed to ensure that individual projects are not subject to multiple competing policies, all of which aim to accomplish the same objective of providing affordable housing: Central City West Projects. Any project located within the boundaries of the Central City West Specific Plan Area and is otherwise subject to linkage fee and replacement housing obligations. Coastal Zone Projects. Any residential portion of a project that is subject to a greater inclusionary affordable housing obligation pursuant to the Mello Act. Other Affordable Housing Obligations. Any residential or mixed-use project that is subject to greater affordable housing requirements as a result of any superseding land use policy or zoning ordinance.
7 CPC CA A-5 Deductions or Credits The draft ordinance also provides targeted deductions or credits to ensure that the fee is in alignment with the City s policy priorities. The proposed fee would be subject to a deduction or fee credit in the following scenarios: Change of Use. When a development project is a change of use from commercial or industrial to residential, the fee is calculated on the net change based on the preexisting use and corresponding fee requirements. Affordable Housing Units. Any restricted affordable units would not be subject to the fee. The total linkage fee obligation would be calculated based on the number of market rate dwelling units or guest rooms. Mixed-Use. The first 25,000 square feet of nonresidential floor area in a mixed-use building would be excluded from the fee calculation. Land Dedication. An applicant would be able to, upon approval by HCIDLA, dedicate land for the purpose of building affordable housing and deduct the land value from the project s total linkage fee obligation. The Department has reviewed exemptions that other cities have included in similar policies, and has found that there is no common benchmark, as most cities design these exemptions and credits to be responsive to particular policy objectives, market conditions, and other issues that are unique to the particular policy context. This strategy is consistent with the one used to identify the appropriate exemptions and deductions as outlined above. Housing Impact Trust Fund Fees generated as a result of this ordinance would be directed to a new fund, the Housing Impact Trust Fund, created by the proposed ordinance. The creation of the new fund will ensure that funds generated by the Linkage Fee would be able to be easily tracked and monitored to ensure maximum accountability and transparency as required under the California Mitigation Fee Act. The fund is designed to be a flexible source of funding for affordable housing that can be used to fund the construction of new units, to drive down the rent levels in projects, or to support the rehabilitation and preservation of existing affordable units. Additionally, fees can be used for down payment assistance for affordable homeownership. Administration of the funds and their distribution would be managed by HCIDLA. Expected Annual Revenue It is anticipated that the proposed ordinance, as recommended, has the potential to generate an estimated average range of between $75- $92 million per year to fund the development of affordable housing in Los Angeles. Estimates of between $90 -$130 million were provided with the release of the draft ordinance in September. Given additional policy changes since then, as well as the approval of Measure JJJ, the annual revenue estimates have been decreased. However, the number of restricted affordable housing units built on site is expected to increase as more projects are expected to choose the affordable housing exemption. Estimates are
8 CPC CA A-6 influenced by market fluctuations and regulatory changes, as well as a number of assumptions, which could affect the accuracy of these figures. KEY ISSUES This section addresses the primary issues regarding a linkage fee, including the need and justification for a fee, the appropriate balance between securing adequate funding and not discouraging quality new development, and the trade-offs between various options in structuring a fee. Need for a Linkage Fee Numerous reports in recent years have detailed the immense affordability challenge faced in the City of Los Angeles. The City has an estimated shortfall of approximately 200,000 homes that are affordable for low income households - a number that has been fast growing in recent years as affordable homes become increasingly rare. On top of that, the Regional Housing Needs Assessment for the years projects that the City will require an additional 4,000 units a year that are affordable to low income households in Los Angeles based just on future growth Unfortunately, the City only created 1,353 units affordable to low income households in a growing shortfall of more than 2,600 units each year. Rapid construction in recent years has not been able to slow the rise of rents and home prices. Zillow.com reports that the estimated December 2016 median monthly rent price in the City of Los Angeles is now $2,852, an increase of more than $500 since just Rents and sale prices in new construction are even higher, requiring household income of about $120,000 to afford. This is more than twice the median annual household income in Los Angeles. The Nexus Study analysis shows that as new low-wage jobs are created by new development, those new workers would largely be unable to afford living in the City of Los Angeles. This results in a combination of overcrowding, overpayment and long distance commutes - all areas where Los Angeles has the unfortunate distinction of being at or near first in the country. Housing is generally cheaper further from job-rich central and west Los Angeles. As such, the new development exacerbates important traffic, air quality and greenhouse gas concerns in these areas. Households stretched to the limit with housing costs do not have the money to support local businesses or invest in health, education, or other daily essentials. By contributing to an affordable housing fund, new development would help offset the impact it creates, aiding the region s equity and sustainability goals. The City of Los Angeles remains one of the few major US cities with a housing crisis that does not have a permanent source of funding for affordable housing. The City has occasionally been able to make one-time allotments of housing resources, but is largely reliant on the federal government. Measure HHH, recently approved by the voters, provides significant funding for affordable housing, but is temporary (10 years) and largely dedicated towards permanent supportive housing for persons experiencing homelessness. See Figure 1 for a comparison of
9 CPC CA A-7 local affordable housing commitments compared to Federal HOME Funding in Los Angeles versus other major cities with high housing costs. Figure 1. Local Affordable Housing Commitments, Compared to Federal HOME Funding HCIDLA analyzed various affordable housing funding options available to the City in a November 17, 2015 report to City Council (CF ). HCIDLA recommended a linkage fee (called an Affordable Housing Benefit Fee in the report) over other potential tools based on an extensive review of other cities throughout the country. It compared one-time versus long-term, sustainable revenue generating methods. Of the various methods reviewed, a linkage fee is the most viable and consistent method of generating a permanent funding source. While other options may generate greater funding, such as a bond measure, these funds are short-term solutions with finite funding. Impact on New Development The largest concern raised by those in the business and development community is the potential impact of the fees on the cost of housing and the ability to continue to produce new housing. The concern is that fees will be passed on to renters and homebuyers in the form of higher-cost housing or that many projects will not be built, resulting in fewer housing units and higher housing costs for everyone. It is certainly true that the City suffers from an overall lack of housing units, with the third lowest residential vacancy rate of any major city in the country (2.7%). Also, many areas of the City are in need of economic development and the jobs that come with new construction. Therefore, any fee that slows housing development or economic development is a valid concern.
10 CPC CA A-8 While there remains a lack of consensus in the academic literature, several comprehensive reviews have found little to no influence from impact fees (or similar requirements in inclusionary housing policies) on the amount or eventual price of new development, particularly when accounting for the offsetting benefits of the fee. 2 One reason offered by the studies is that there are larger market and regulatory factors that influence the decision to build housing in a given locale than just the amount of one fee. Orthodox economic theory indicates that a new fee will absorbed be by the party most able to adjust their price (i.e. the concept of elasticity). Assuming that the cost of housing cannot be increased much more than it already is and that developers already charge the highest price they can for the new housing product, it appears unlikely developers can simply pass the cost of the new fee to the end buyer or renter. Instead, research tends to support the notion that developers either accept lower profit (to a certain level) or that the cost of fees gets factored in through lower land sales prices as developers may be unable to pay the same amount for land as they could before the fee. The Nexus Study supports this notion, describing that the impact of the fee is typically experienced through a slowed trend in land value appreciation. However, there are several studies that do show a positive relationship between new impact fees and increased housing prices or reduced housing production. These studies tend to be focused on smaller suburban cities that face high competition from neighboring jurisdictions with lower impact fees, or on areas with a high amount of vacant land. That is not the case in the City of Los Angeles, which has long had some of the lowest development impact fees in the State according to the CA Housing and Community Development Dept., and is bordered by cities like Pasadena, West Hollywood and Santa Monica that have higher affordable housing requirements. The Nexus Study does acknowledge that the change of moving from no fee to a fee may be disruptive for some projects in the short run particularly those that were unable to consider the fee in their project decision making. The three-month grace period (increased since the release of the ordinance) and exemption for projects which are already in the pipeline at the time of ordinance adoption are meant to assist these projects. The Terner Center for Housing at the University of California, Berkeley recently released a useful Housing Development Dashboard that attempts to quantify the precise trade-offs of different housing policies by using up-to-date economic and land use information from actual parcels in a 2 Schuetz, Jenny, Rachel Metzler, and Vicki Been Silver Bullet or Trojan Horse? The Effects of Inclusionary Zoning on Local Housing Markets. Urban Studies. Been, Vicki Impact Fees and Housing Affordability. Cityscape: A Journal of Policy Development and Research Volume 8, Number Mayer, Christopher J. and C. Tsuriel Somerville Land Use Regulation and New Construction Journal of Urban Economics, 48 (1), Mukhija, Vinit, Lara Regus, Sara Slovin, and Ashok Das Can inclusionary zoning be an effective and efficient housing policy? Evidence from Los Angeles and Orange Counties. Journal of Urban Affairs 32.2, Rosen, David Inclusionary Housing and its Impacts on Housing and Land Markets Inclusionary Zoning: The California Experience. National Housing Conference. Dresch, Marla and Steven M. Sheffrin Who Pays for Development Fees and Exactions. San Francisco, California: Public Policy Institute of California.
11 CPC CA A-9 number of Bay Area cities. The City of Oakland recently adopted a similar housing linkage fee as to the one being proposed here ($5.44/sq. ft. on commercial and a range of $8,000 to $22,000/unit on residential). The Dashboard predicts that between 432 and 608 market rate units a year, at least in the short term, would not be produced as a result of the Oakland linkage fee requirements. However, the model also shows that there is a net increase in affordable housing units with a linkage fee in place. This illustrates that, while a fee could impact some small share of new market rate housing, at least in the short-term, at least half of the loss will likely be made up by increased affordable housing production. It is worth highlighting that Oakland s per unit fee, when fully phased in, is about twice that being proposed for the average multifamily project in Los Angeles - and Los Angeles is generally a stronger real estate market. Therefore, potential impacts to market rate housing production in LA would likely be less significant than in Oakland. Furthermore, rents and home values have increased dramatically in recent years in the City of Los Angeles. Zillow.com reports that the median home value in Los Angeles as of December 2016 is $610,400. This represents a 65% increase since December 2012 when the median home value was $369,000. Rents have increased 26% in the same period. Given such gains, a modest fee should easily be absorbed by the continued trend in rising home values and rents. The Nexus Study was intentionally crafted to deliver a conservative estimate of maximum feasible fees in all development scenarios. Wherever possible, the lower end of the range of revenuerelated variables, and the higher end of the range of cost-related variables, was used. Even though a 10-12% return on cost was indicated by several developers to be adequate to green light a project, a 15% return on cost was used for the study to determine feasibility. Even under this conservative approach, the Study suggests the vast majority of development in the city can afford significantly higher fees than are being proposed. The draft ordinance attempts to limit potential negative impacts by creating exemptions or credits for key development types (including affordable housing, smaller projects, accessory dwelling units, adaptive reuse, and mixed use, among others). The ordinance also includes strategies such as exempting all projects already in the entitlement pipeline (which would have been designed and initiated without knowledge of the fee). Since release of the ordinance, based on feedback from the development community, several exemptions and deductions were adjusted to further reduce negative impacts. Due to the particular concern regarding potential impacts on housing development, and to support the provision of housing amenities, the fee does not apply to any common areas including hallways, stairs or community rooms in residential buildings (residential floor area is calculated per Section A.29(c)(1) of the LAMC). Impacts on Low-Market Areas The Nexus Study was structured to evaluate fees in high, medium and low market areas of the city. As would be expected, the study shows the biggest potential impacts would be on projects in areas of the city that command lower rents and sales prices. The Department has carefully crafted a proposal to address this legitimate concern.
12 CPC CA A-10 One option that was studies and is not recommended was to exempt or differentiate low-market areas within the fee ordinance using the geographic market areas proposed in the Nexus Study as a basis to offer different fee levels to different market areas. However, this is challenging to implement because market conditions fluctuate rapidly, and the boundaries of the market areas may shift within a few years time. Data sources used to establish zones are proprietary and may no longer exist in the future, increasing the potential difficulties associated with having to regularly update the zones. Data which are more readily available, for example rental cost data available through the Census and American Community Survey, are also flawed in the sense that they do not necessarily reflect current rents or sale prices. Furthermore, the Department has received feedback from many in the development community that they value certainty and predictability in making development decisions. A fee structure that relies upon geographic-based market areas could change from the point when a developer buys land to the point of paying an actual fee, resulting in unanticipated changes to the development cost budget. A second option that was studied and not recommended was to simply exempt low-market areas by using a proxy such as Enterprise Zones or Low Income Census Tracts. These methods are also flawed, however, as incomes, on which Enterprise Zones are largely based, are lagging indicators of current market conditions. Enterprise Zones were created many years or decades ago and their boundaries are not frequently adjusted. For example, Downtown and Hollywood remain largely within Enterprise Zone areas and also continue to show as neighborhoods with low median incomes, despite being located in some of the most heated development markets in the region, areas that the Nexus Study identified as high and medium market areas. The proposed ordinance includes several key exceptions as to type and scale. An analysis of building permit data in the low-market areas between 2011 and 2015 reveals that 60% of all development occurring in these areas would be otherwise exempt from the AHLF based on the recommended exemptions described above (full analysis is in the attached environmental document provided in Exhibit B). Half of all multifamily projects with five units or fewer are built in this area. These projects, which often provide a more affordable housing typology, would not be subject to the fee. Furthermore, a good deal of development in these areas is affordable housing, which would generally be exempt. This information suggests that any potential impacts to development patterns in these areas may be minimized by the exemptions recommended in the ordinance. Relationship to Other New Fees and Development Requirements Two other development impact fees have either been proposed or recently approved. These include an update and expansion to Quimby (parks) Fees citywide, and an update to Transportation Impact Assessment (TIA) Fees currently applicable only to two Westside specific plans (West Los Angeles and the Coastal Transportation Corridor). The Nexus Study incorporated a full analysis of the cumulative impact of these expanded and updated fees when combined with the AHLF. The proposed linkage fee is shown to be feasible when taking into account the per-unit costs imposed by the updated Quimby Fee and TIA Fees.
13 CPC CA A-11 Some commenters have mentioned that the impact of the recently voter approved Measure JJJ needs to be analyzed in relation to the proposed fee. The proposed fee ordinance anticipated the potential passage of Measure JJJ. If a project is subject to Measure JJJ it will be completely exempt from paying the linkage fee because it will have met the on-site affordable housing alternative under the JJJ provisions (20% low income, 11% very low income). More generally, Los Angeles is noted to have relatively low development impact fees compared to other large cities in California and across the country. A November 2015 audit released by the City Controller reported that Los Angeles may not be fully exercising its power to charge citywide development impact fees. Los Angeles is currently only charging a fraction of the impact fees charged in other west coast cities such as San Francisco and Portland. Most suburban communities in the Los Angeles region also charge significantly higher development impact fees than the City does for things like schools, sewers, parks or other public services. Stakeholders from the development community indicated that the main hindrance to development derives from the City s decentralized development approval process, which they believe delays the issuance of a certificate of occupancy. These same opinions were noted by Matrix Consulting during its 2014 study of the City s development services processes. Many improvements have been made to the entitlement and permitting process in recent years and the City continues to prioritize further improvements. Setting Appropriate Fee Levels Another key challenge in developing the Affordable Housing Linkage Fee was determining appropriate fee levels that would strike a balance between accumulating meaningful revenue for affordable housing and minimizing potential impacts on new development. The Nexus Study established a framework for understanding the maximum feasible level of fees that are considered supportable by ten different development types across three geographic sub-markets in the City. The recommended fee structure proposed in the draft ordinance simplifies these various feasible fee amounts into a single fee for commercial ($5 per sq. ft.) and residential ($12 per sq. ft.) development that would apply citywide. Because the fees would apply citywide, including weaker market areas, the recommended fee levels are generally well below than what is considered to be supportable in medium and stronger market areas. The exceptions are hotels and warehouse space, which were both found to be feasible at $5 per sq. ft. The recommended fees were also lowered below the levels supported by the study's feasibility analysis because these calculations were made during a period of relatively high rents and sale prices, and the fee should be supportable during all market cycles. Fee Structure The basic structure of the proposed fee is meant to be simple to understand and predictable from year to year. It applies one fee to residential projects ($12 per sq. ft.), regardless of whether it is multiple-family or single-family, and one fee to commercial projects ($5 per sq. ft.), regardless of whether it is retail, office or industry. The location of the project does not impact the fee.
14 CPC CA A-12 The Nexus Study evaluated 11 different development types in three different types of markets - low, medium and high (based on a composite of current market rents and prices). As a result, the City has detailed information on the economic feasibility of different fee levels on different categories of development in different areas of the City. Some have asked why the City did not develop a fee structure that used this information to essentially charge a higher fee to developments that could afford it, while lowering fees on less economically strong development typologies. Different iterations of this fee structure were analyzed in the Nexus Study (Fee Options A-C), most of which were based on different fees corresponding to the (high, medium or low) market area in which the project was located. The City closely evaluated alternative fee structure options and determined they would be difficult to administer and maintain, while also providing less certainty and more complexity to the development community (see Impact on Low Market Areas on pg. A-11 for a discussion of a market area based approach). Creating multiple fee categories for different development types, such as office, retail, industrial and warehouse, would also introduce more complexity and uncertainty for the development community. Increasingly, new developments also include a mix of uses and many newer commercial or live-work operations blur the traditional boundaries between development types. Favoring one type of commercial construction over another could also lead to a skewing of the market away from typologies that may be desired from a policy point of view. Fee Deferral Different cities have allowed developers to pay the linkage fee at different points in the process - permit application, permit issuance or certificate of occupancy. A few cities go further and try to alleviate the impact of a new fee by allowing for deferral of payment into the building operation period. Boston allows payment installments for up to a maximum of 7 or 12 years. This flexibility has facilitated the progress of development in difficult circumstances. Deferred payments past schedule allow developers to pay linkage fees out of operating revenues from the project rather than from up front equity investment, reducing the financing necessary to begin construction. However this also lowers the worth or Net Present Value of the $5.00 fee to $3.83 (7 years) and $2.58 (12 years). There are also obvious concerns about what ability the City has to collect payment once a structure is operational. For these reasons, the Department does not recommend deferring fees beyond the date of permit issuance. Another option is to allow payment at the time of Certificate of Occupancy issuance. However the Department understands the current Department of Building and Safety permit issuance system is unable to collect fees at this point in the process. Also, there are concerns regarding what the City would do if and when a project is unable or unwilling to pay the required fee at this point as it is more difficult from a practical and legal perspective to disallow a Certificate of Occupancy compared to a building permit. For those reasons, the Department continues to recommend to require payment when a building permit is issued.
15 CPC CA A-13 Fee Exemptions As described above, several exemptions from the fee are provided to minimize the impact on development. In areas where the fee may conflict with other policy objectives, for instance in projects already providing affordable housing or in mixed use buildings, a deduction or exemption may apply. These exemptions are designed so as not to disincentivize these types of projects. Multi-Family Buildings with 5 Units or Less Residential buildings with 5 units or less are a unique type of residential building typology that often provide a source of moderately affordable housing. Such projects frequently provide larger unit sizes, and have lower profit margins than projects with more units. They also are unable to access the density bonus program, unlike larger projects, putting them at an additional disadvantage. Given the importance of providing this type of lower-density multi-family housing at a more affordable level, the Department recommends exempting these projects. On Site Affordable Housing Restricted affordable housing units are exempt from paying under the proposed housing linkage fee, as the provision of affordable housing is the intent of the fee. However, the Department wanted to further encourage additional on-site affordable housing units, particularly where they are already being provided as part of a density bonus or other incentive program. Because density bonus applicants already receive incentives (i.e. additional housing units or height) for providing some affordable units on site, the proposed ordinance sets the thresholds for the mixed-income housing exemption slightly higher than those required through State Density Bonus Law (SB 1818). For example, in order to qualify for an exemption from the Linkage Fee, a residential project would be required to set aside 11% of the total units for very low income households. Under the Density Bonus program, a project is only required to set aside 11% of the base number of units for very low income households in order to qualify which is roughly equivalent to 8% of the project s total resulting units. To qualify for the exemption, density bonus projects would need to increase their affordable set-aside by about 38 percent. These projects would also be subject to a No Net Loss provision, consistent with State density bonus law to require that any existing affordable units are replaced. A new transit-based affordable housing incentive program called the Transit Oriented Communities Affordable Housing Incentive Program (TOC Program) was approved as part of Measure JJJ. The Department plans to release the guidelines needed to implement the program in March The TOC Program should provide significant incentives and development certainty to projects that commit to provide the levels of affordable housing required to obtain the Linkage Fee exemption. Mixed Use Development Mixed use buildings are an important building typology, as they provide pedestrian activation and resident amenities through the inclusion of ground-floor commercial use in addition to
16 CPC CA A-14 residential uses. Such building types are increasingly prioritized in the City s policy documents. To continue encouraging this development type, the Department has proposed increasing the deduction/exemption threshold for nonresidential uses in a mixed use building from 10,000 square feet to 25,000 square feet. Or, if ground floor nonresidential floor area is required by the Department of City Planning, one hundred percent of the required nonresidential square footage will be exempt from the Fee. How Would Funds Be Spent? The fees raised by the Linkage Fee would be deposited in the Housing Impact Trust Fund (HITF). The Trust Fund is being established through the proposed ordinance for the purpose of receiving and disbursing monies to address the affordable housing needs of the City of Los Angeles. The Fund would be administered by HCIDLA, with approval of major spending decisions by the City Council. See the Housing Impact Trust Fund discussion on page A-4 above for more detail. The advantage of having a permanent source of local funding is that it is not encumbered by other regulations that dictate how monies are spent, unlike the majority of state and local funding currently used for housing assistance in Los Angeles. The ordinance requires the funding to be used for the housing needs of the City, for the development and preservation of affordable housing and such other housing activities as that term shall be defined in a set of Guidelines created by HCID. This includes any other activity that contributes to an increased supply of decent, safe and sanitary affordable housing in the City of Los Angeles. With a permanent stream of revenue, the City can plan for and create a variety of housing programs, ranging from the construction, preservation, or rehabilitation of rental and/or for-sale housing. As described in the ordinance, HCID shall prepare for City Council consideration an annual report detailing the amount and source of all Housing Impact Trust Fund revenues generated and funds disbursed as a result of the Affordable Housing Linkage Fee ordinance. The General Manager of HCIDLA shall make recommendations to the City Council for expenditures from the Fund. No expenditure may be made from the Fund without the prior approval of the Mayor and the City Council, unless otherwise authorized.
17 CPC CA F-1 GENERAL PLAN/CHARTER FINDINGS FINDINGS Charter Findings Pursuant to City Charter sections 556 and 558, as described below, the proposed ordinance is in substantial conformance with the purpose, intent and provisions of the General Plan, as well as in conformance with public necessity, convenience, general welfare and good zoning practice. Specifically, the action addresses each of the following goals, objectives and policies of the General Plan as outlined below. General Plan Findings Framework Element Goal 4A. An equitable distribution of housing opportunities by type and cost accessible to all residents of the City. Goal 7G. A range of housing opportunities in the City. Housing Element Objective 1.1 Produce an adequate supply of rental and ownership housing in order to meet current and projected needs. Policy Expand affordable homeownership opportunities and support current homeowners in retaining their homeowner status. Policy Expand affordable rental housing for all income groups that need assistance. Policy Facilitate new construction and preservation of a range of different housing types that addresses the particular needs of the city s households. Policy Develop financial resources for new construction of affordable housing. Policy Strengthen the capacity of the development community to develop affordable housing. Objective 1.2 Preserve quality rental and ownership housing for households of all income levels and special needs. Policy Develop financial resources for the long-term affordability of publicly assisted rental and ownership housing.
18 CPC CA F-2 Policy Strengthen the capacity of the development community to preserve and manage affordable housing. Objective 2.2 Promote sustainable neighborhoods that have mixed-income housing, jobs, amenities, services and transit. Policy Promote and facilitate a jobs/housing balance at a citywide level. Objective 2.5 Promote a more equitable distribution of affordable housing opportunities throughout the City. Policy Foster the development of new affordable housing units citywide and within each Community Plan Area. As made evident by the list of General Plan goals, objectives and policies provided above, the proposed ordinance is in conformance with a range of General Plan goals related to affordable housing production and preservation. The City s General Plan clearly recognizes the need for programs which identify local sources of funding for affordable housing which benefit the public good and further these citywide policy objectives. Establishing a permanent local funding source that could be used for a variety of uses related to the construction or preservation of affordable housing in locations throughout the City will greatly assist the City in meeting its growing affordable housing needs. The ordinance also directly addresses a specific implementation program in the Housing Element of the General Plan (Program 16 - New Programs to Increase the Production of Affordable Housing). The program called for exploring the development of a local, permanent source of funding to provide funding for new affordable housing construction. Potential strategies outlined in the Program included establishing a fee on new development, which is accomplished in the proposed ordinance. CEQA FINDINGS The proposed ordinance is not a project under CEQA pursuant to CEQA Guidelines section (b)(4), which provides that CEQA does not apply to the creation of governmental funding mechanisms that do not involve a commitment to a particular project which may result in a significant impact to the environment. The ordinance does not identify any specific future project or projects which can be singled out as resulting in an environmental impact. Therefore, the Affordable Housing Linkage Fee is not considered a project, and thus not subject to CEQA. Further, the proposed ordinance qualifies under the common sense CEQA exemption pursuant to CEQA Guidelines Section 15061(b)(3), which provides that, where it can be seen with certainty that there is no possibility that a project may have a significant effect on the environment, the project is not subject to CEQA. CEQA only applies to projects that have the potential to cause a significant effect on the environment either through a direct impact or reasonably foreseeable indirect impact. The proposed ordinance does not have that possibility. As further demonstrated in Exhibit B, because the ordinance does not commit funds directly to any specific future development project, it will not cause any direct impact on the environment. At
19 CPC CA F-3 this point in time it would be speculative to evaluate the impacts of any such project which would be subject to payment of the linkage fee, or which would receive project funding as a result of this ordinance. Further, any potential indirect impact of the ordinance on the environment will be minor as the Linkage Fee is not anticipated to alter existing development patterns. As such, the ordinance is unlikely to create any foreseeable direct or indirect physical impact on the environment. However, in case there is a challenge to this project and a court disagrees, the City has prepared a Negative Declaration for this project (Exhibit B.2). CALIFORNIA MITIGATION FEE ACT FINDINGS The California Mitigation Fee Act (California Government Code Section ) requires that following findings be made: Identify the purpose of the fee. Identify the use to which the fee is to be put. If the use is financing public facilities, the facilities shall be identified. Determine how there is a reasonable relationship between the fee s use and the type of development project on which the fee is imposed. Determine how there is a reasonable relationship between the need for the public facility and the type of development project on which the fee is imposed. The Los Angeles Affordable Housing Linkage Fee Nexus Study (Exhibit C) serves to make these findings, which must be adopted by the Los Angeles City Council. Commercial Fee Purpose of the Fee The fee program proposed by draft ordinance and described in the Nexus Study will offset the impact of new commercial development on the City of Los Angeles housing market by funding the production, acquisition, rehabilitation and/or preservation of affordable housing in the City of Los Angeles. The Nexus Study outlines the serious affordable housing crisis currently facing the City of Los Angeles, and notes that Los Angeles is the only major California city without a permanent source of affordable housing funding. Use of the Fee The proposed fee program would impose linkage fees on new commercial development of most types including office, hotel, retail, and industrial uses. Fees would be collected by the City of Los Angeles and deposited into the Housing Impact Trust Fund. This fund is used to finance the production, acquisition, rehabilitation and/or preservation of affordable housing in the City of Los Angeles through grants and loans to qualified projects.
20 CPC CA F-4 Relationship between Use of Fee and Type of Development The development of commercial space will generate new employment in Los Angeles. A portion of the new employees will live in households that fall below the 120 percent Area Median Income (AMI) income threshold, and will not be able to find housing that is affordable to them. Statistics included in the Nexus Study indicated that this is particularly daunting for households earning below 50 percent of AMI. The Nexus Study contains a detailed 10-step methodology, with Steps 1-8 forming the nexus (relationship) analysis. The Study estimates the likely mix of new commercial development by type of land use, based on a detailed analysis of permitted commercial space by type for the past 10 years. The Study then estimates new employees in the new space by type, combines these new workers into households, and estimates these new worker-based households incomes based on wages for the jobs forecasted. This distribution of new worker households is then segmented by income band, resulting in the estimated affordable housing need up to 120 percent AMI (or impact ). Next, the methodology estimates the cost to provide this affordable housing, assuming it is all rental housing, and assuming that the occupants can afford to contribute no more than 30 percent of their household income to rent. The balance is the affordability gap, which is then converted into a development financing gap, and then converted into the maximum legal fee fee per square foot of new commercial development by use type, to generate the funds necessary to fund this development financing gap. The Nexus Study includes subsequent analysis beyond that required by the Mitigation Fee Act, to test the financial feasibility of charging this maximum fee on several types of new commercial development across three categories of market condition ( low, medium, and high market conditions). The Study concludes that the maximum legal fee levels are not financially feasible and could impinge on new commercial development. The Study then recommends lower fees in all cases than the maximum legal fee, based on the financial feasibility conclusions. These lowerthan-legal-maximum fee recommendations would mean that if the fee were imposed at the recommended levels, not all of the funds needed to produce new affordable housing from the impact of new commercial projects would be generated.
21 CPC CA F-5 Residential Fee Purpose of the Fee The fee program proposed by draft ordinance and described in the Nexus Study will offset the impact of new, market-rate housing development on the City of Los Angeles housing market by funding the production, acquisition, rehabilitation and/or preservation of affordable housing in the City of Los Angeles. The Nexus Study outlines the serious affordable housing crisis currently facing the City of Los Angeles, and notes that Los Angeles is the only major California city without a permanent source of affordable housing funding. Use of the Fee The proposed fee program would impose linkage fees on new, market-rate housing development projects as specified in the draft Ordinance, which would be collected by the City of Los Angeles and deposited into the Housing Impact Trust Fund. This fund is used to finance the production, acquisition, rehabilitation and/or preservation of affordable housing in the City of Los Angeles through grants and loans to qualified projects. Relationship between Use of Fee and Type of Development The development of new, market-rate residential projects will accommodate growth in households in the City. These new households will spend their income for goods and services, which will in turn generate new businesses and jobs. A portion of the new employees serving these new market-rate households, will live in households that fall below the 120 percent Area Median Income (AMI) income threshold, and will not be able to find housing that is affordable to them. Statistics included in the Nexus Study indicated that this is particularly daunting for households earning below 50 percent of AMI. The Nexus Study contains a detailed 10-step methodology, with Steps 1-8 forming the nexus (relationship) analysis. The Study estimates likely household incomes for new market-rate residential projects in Los Angeles, based on sale prices/rental rates of recently development projects, including a detailed analysis by sub-area. The Study then estimates household spending from these new market-rate units, and projects the mix of jobs to be generated for a 100-unit new residential project. This new employment, in turn is combined into new households, and incomes are estimated based on the new jobs wages and the number of estimated workers per household. This distribution of new worker households is then segmented by income band, resulting in the estimated affordable housing need up to 120 percent AMI (or impact ). Next, the methodology estimates the cost to provide this affordable housing, assuming it is all rental housing, and assuming that the occupants can afford to contribute no more than 30 percent of their household income to rent. The balance is the affordability gap, which is then converted into a development financing gap, and then converted into the maximum legal fee fee per square foot of market-rate housing to generate the funds necessary to fund this development financing gap. The Nexus Study includes subsequent analysis beyond that required by the Mitigation Fee Act, to test the financial feasibility of charging this maximum fee on several types of new, market-rate housing development projects across three categories of market condition ( low, medium, and
22 CPC CA F-6 high market conditions). The Study concludes that the maximum legal fee levels are not financially feasible and could impinge on market-rate housing production. The Study then recommends lower fees in all cases than the maximum legal fee, based on the financial feasibility conclusions. These lower-than-legal-maximum fee recommendations would mean that if the fee were imposed at the recommended levels, not all of the funds needed to produce new affordable housing from the impact of new market-rate projects would be generated.
23 CPC CA P-1 PUBLIC HEARING AND COMMUNICATIONS SUMMARY OF PUBLIC HEARING TESTIMONY AND COMMUNICATIONS The following is a summary of the comments received since the draft Ordinance was publicly released on September 21, Comments are broken out into two groups - those from individuals or organizations which were generally supportive of the fee and would like to see it higher and those with concerns about a fee and wish to see it adjusted or lowered. The main issues raised during the public comment period are addressed individually below, with additional details provided in the Key Issues section of this report. Fee Structure From Those Supportive of a Fee Fees should be raised to the maximum feasible levels, as supported by the Nexus Study in order to maximize revenue for affordable housing funding ($15 residential / $18 condominiums / $7 commercial / $5 warehouse). Fees should vary by geographic market and development type. Should not leave much needed housing funding on the table by charging modest fees. Fee should be charged on the total square footage of a residential development project, and common areas should not be excluded from the fee calculation. From Those Concerned about a Fee A more complex fee structure should be used that reflects the different ability to accommodate the fee in different markets and by different development types. This will lead to more equity, greater revenues and the ability to lower fees in lower market areas where development will not pencil with the new fees. There should be a maximum fee cap per unit, so as not to dissuade large family units. Allow for density bonus incentives if paid linkage fee. There should be more parity between the residential and non-residential fees so as not to create an anti-housing incentive. Downtown should be treated differently (include 150% AMI and deduct TFAR payment if for AH, exempt Type I construction until 2025). The fee should be paid at Certificate of Occupancy (COO), or split into multiple payments between the issuance of building permits and obtaining the COO. The Department is sensitive to the need to strike a balance with the proposed fee levels, so as not to discourage development while maximizing revenue potential for the Housing Impact Trust Fund. In order to facilitate both of these goals, the Department has explored ways to differentiate the fees by market and development type. However, for reasons described in this report, utilizing the geographic market areas proposed in the Nexus Study or a similar tool is challenging in implementation. To simplify the fee, provide greater certainty to developers, and to minimize the
24 CPC CA P-2 fee s impact on the housing market, the Department has recommended a uniform fee be applied that is feasible in all market areas citywide. For further discussion pertaining to the structure of the proposed fees and the comments raised herein, refer to the Key Issues section of this report. Fee Exemptions From Those Supportive of a Fee Concern about mixed-income exemption levels (percent of affordable units required is too low). Concern about exemption for projects located on government-owned land, as these are not necessarily affordable housing. Ensure that the application of the fee does not negate or limit application of the Mello Act Smaller luxury multifamily residential developments are common in some parts of the City, so there should be no exemption for developments with 5 units or less. The threshold for the nonresidential exemption should be lowered to 5,000 square feet. Private universities and hospitals should not be exempt from the fee. Expand exemptions to all areas of the City that place higher affordable housing requirements on development. Introduce a No Net Loss provision to ensure that developments that provide affordable units but fail to replace all existing affordable units do not qualify for the mixed-income exemption. The Department crafted the proposed ordinance in order to maximize the number of affordable units provided either through the Housing Impact Trust Fund or through on-site units in mixedincome buildings. The percent of affordable units required for a residential project to be exempt from the requirements of the linkage fee are higher than those required for other land use incentives, such as the density bonus program. As such, a development will not be able to qualify for both the density bonus and an exemption from the linkage fee without providing additional units, as described in the Setting Appropriate Fee Levels section under Key Issues above. An update has been made to the proposed ordinance to clarify that the project must be constructed by a governmental or non-profit entity in order to qualify for the exemption in Section (b)(4). From Those Concerned about a Fee Exempt ground level retail where required by a Specific Plan or similar regulation. Exempt hotels. Ordinance should exempt workforce housing units (up to 150% AMI) as workforce housing has been identified as an important below market rate option for housing. Projects with less than 25,000 square feet of new or added floor area should be exempt. The ordinance should include a hardship exemption for projects unable to pay the fee.
25 CPC CA P-3 Exempt portions of residential projects subject to inclusionary housing requirements under the Mello Act. The 1,500 sq. ft. threshold for single-family homes should be increased. The percent of affordable units required for the mixed-income exemption should follow the same methodology as the Density Bonus, and be calculated based on the base number of units rather than the total number of units. Exempt projects built with an FAR of 1.5 or less, to reflect the challenges of developing at this lower-density scale that oftentimes results in a more affordable housing typology. The updates to the proposed ordinance include several of the requested modifications to fee exemptions, including modified exemptions for ground-floor retail, an increase to the square footage threshold for single-family homes, and clarified language regarding Mello Act compliance. Fee exemptions are designed to be responsive to different development types ability to feasibly pay the fee, as well as land use requirements imposed by other City policies that may be in conflict with the fee. For additional discussion regarding fee exemptions, see the Key Issues section of this report. Fee Implementation From Those Concerned about a Fee Fee should be phased in over a few years. Effective date should be pushed back 180 days. There should be the ability for Council to temporarily pause the Fee during recession. More time is needed to digest Nexus Study (and allow for elections). An update has been made to the proposed ordinance to clarify that the Linkage Fee will become effective three months after ordinance adoption. Additional comments on the proposed ordinance and Nexus Study are encouraged, and may be submitted to the City Planning Commission, Council Committee(s), and the City Council. Use of Funds From Those Supportive of a Fee Fees should support those with the greatest need, i.e. Extremely Low Income and Permanent Supportive Housing. A minimum of $20 million should be set aside for permanent supportive housing each year. Fees should benefit those that will not benefit from Measure HHH. There should be a mechanism to ensure that funds accrued in a neighborhood are spent in that neighborhood. The majority of funds should be used for housing at the 60% AMI level and below, and a small portion should be used for affordable homeownership up to 120% AMI. From Those Concerned about a Fee
26 CPC CA P-4 Require Trust Fund to be spent equally on workforce housing. Require plan for how the money will be spent. The staff report has included a recommendation that the City Council direct the Housing and Community Investment Department (HCIDLA) to report back within six months of ordinance adoption with a detailed expenditure plan for Housing Impact Trust Fund revenues generated as a result of the linkage fee. These comments will be considered by HCIDLA in developing this funding program. Impact on Development and Housing Market From Those Concerned about a Fee New fees could reduce housing production and thereby increase home prices. New fees will translate into higher for-sale and rental prices. Higher fees deter new residential construction, thereby further exacerbating the housing crisis. Other sources for affordable housing funding should be found, including incentives outside of land use. The current land market is unable to absorb the impacts of the fee, and the Nexus Study s finding that residual land value will be reduced should be reevaluated. The fee should be paired with other incentives in order to offset the impact on the housing market. The Nexus Study provides detailed analysis of the potential effects of the linkage fee. The fee levels were selected so as to minimize the potential impact on the housing market, and are well within the feasible fee range found in the study. For a detailed discussion of the potential impacts of the fee, refer to the Key Issues section of this report and the Nexus Study provided in Exhibit C. Multiple Fees and Initiatives Introduced at Once From Those Concerned about a Fee More consideration needs to be given to address the cumulative impact of stacking multiple fees and land use incentives. The fee s relation to Measure JJJ, Measure HHH, the Neighborhood Integrity Initiative (NII), Value Capture, and other policy initiatives needs to be better understood before making a decision. As described in the Key Issues section of this report, the City of Los Angeles has relatively low development impact fees compared to other large cities in California, and currently has no permanent source of funding for affordable housing. While related, the Linkage Fee is distinct from other land use incentives in that it will provide a flexible, permanent, local funding source for the construction and preservation of affordable housing. The City is currently experiencing an
27 CPC CA P-5 unprecedented housing crisis, and a range of strategies are needed to address the severe need for affordable housing. Public Hearing The Department held a staff public hearing on October 19, The public hearing featured 62 attendees and 35 speakers, including approximately 28 who were generally supportive with some recommended changes to improve the ordinance, and 7 with concerns about the proposed ordinance. Comments raised during the public hearing were generally in line with the comments summarized above. Those in favor of the proposed code amendment were supportive of the principal of a linkage fee, but many felt that the fees could be higher. Several speakers also emphasized the need for funds to be used for a variety of affordable housing types, including permanent supportive housing, workforce housing, senior housing, and housing for extremely low income households. Those who had concerns regarding the fee primarily took issue with the fees being too high. They also raised issue with ensuring that the proposed fee does not conflict with the Mello Act, or other land use incentives or requirements related to affordable housing. In order to better assess the impact of other competing policies and ballot measures, as well as to provide more time to review and make comments on the Nexus Study, several speakers also suggested extending the public comment hearing and delaying City Council action on this matter until after the March 2017 election. WORKING GROUP PARTICIPATION Given this issue s importance, the City convened a working group to provide feedback and guidance in informing the Nexus Study methodology and recommendations around housing fees. The group included a cross section of the interested parties on this issue - both for-profit and nonprofit developers, builders of housing and commercial projects, housing advocacy organizations, business groups, etc. Organizations and individuals were identified because of specific expertise, their knowledge of Los Angeles real estate development, the role an organization plays around the issue, and the important perspective an individual could represent. The working group included the following organizations: Related Companies CA, Brookfield Residential, Equity Residential, Building Industry Association (BIA), Trammell Crow, Nancy Lewis Associates, Central City Association of Los Angeles, CIM Group, Mack Urban, Los Angeles Business Council, Southern California Association of Non-Profit Housing (SCANPH), California Community Foundation, Strategic Actions for a Just Economy (SAJE), Abode Communities, Southeast Asian Community Alliance, LA Family Housing, UCLA, Meta Housing, and McCormack Baron Salazar.
28 EXHIBIT A: Proposed Ordinance CPC CA February 23, 2017
29 Draft Affordable Housing Linkage Fee Ordinance CPC CA Page 1-2/23/17 ORDINANCE NO. An ordinance adding Section and amending Section of the Los Angeles Municipal Code, as well as adding Section of Chapter 172 of the Administrative Code, establishing an Affordable Housing Linkage Fee, and directing Linkage Fees derived from Development Projects to the Housing Impact Trust Fund. THE PEOPLE OF THE CITY OF LOS ANGELES DO ORDAIN AS FOLLOWS: Section 1. Chapter II of the Los Angeles Municipal Code is amended to add: SEC DEFINITIONS ARTICLE 1.18 AFFORDABLE HOUSING LINKAGE FEE Terms have the meaning ascribed in Section or of the Los Angeles Municipal Code, or if not defined, have the following meanings: (a) Additional Housing Units means the number of dwelling units or guest rooms to be added on a parcel of real property by issuance of a building permit, less the number of dwelling units or guest rooms legally removed, or authorized to be removed, from the same parcel of real property. (b) Additional Nonresidential Floor Area means the amount of floor area, as defined in Section of this code, to be added on a parcel of real property by issuance of a building permit, less the amount of floor area legally removed, or authorized to be removed, from the same parcel of real property. (c) "Applicant" means any individual, person, firm, partnership, association, joint venture, corporation, limited liability company, entity, combination of entities or authorized representative thereof, who undertakes, proposes or applies to the City for a Development Project. (d) Complete Building Permit Application means a complete application for a building permit a building or structure that is submitted along with architectural and structural plans sufficient for a complete plan check that is accepted by the Department of Building and Safety. (e) "Development Project" means any activity involving or requiring the issuance of a building permit that results in Additional Housing Units, Additional Nonresidential Floor Area, or a change of use from commercial or industrial to residential.
30 Draft Affordable Housing Linkage Fee Ordinance CPC CA Page 2-2/23/17 (f) Linkage Fee means that housing Linkage fee imposed under Article 1.18 of the Los Angeles Municipal Code on applicants for certain Development Projects. SEC APPLICABILITY The following provisions apply to any Development Project otherwise covered by these regulations for which a building permit is approved by the City. The Applicant for any Development Project, unless exempt from this chapter, as a condition of the building permit, must pay to the City the required Linkage Fee. The provisions of this Section are subject to the requirements set forth in California Government Code Section et seq. (a) Effective Date. Any Applicant for a Development Project for which a Complete Building Permit Application or Department of City Planning entitlement application is submitted, whichever is first, on or after, 2017 (90 days after adoption), must pay the Linkage Fee in effect at the time of building permit issuance. For these purposes, a Department of City Planning entitlement application is an application that has been accepted by City Planning and the application fees have been paid. If a project had submitted a building permit application or application sufficient for a planning or zoning entitlement for the Development Project prior to this date, the project shall not be subject to a fee. (b) Exemptions. The Department of Building and Safety shall determine which of the following exemptions apply to any Development Project based on documentation submitted by the applicant prior to the issuance of the building permit. The fee imposed by this article shall not apply to construction which includes the following: 1. Less than 25,000 square feet of Additional Nonresidential Floor Area in any nonresidential building, as determined by the Department of Building and Safety. Or, if ground floor nonresidential floor area is required by the Department of City Planning in a zoning ordinance, Specific Plan, Community Plan, Pedestrian Overlay Zone or other set of development standards, one hundred percent of the required ground floor nonresidential square footage shall be exempt from the Fee. 2. A multiple-dwelling building with 5 or fewer units. 3. Any for-sale or rental housing development containing restricted affordable units where at least 40% of the total units or guest rooms are dedicated for moderate income households, or at least 20% of the total units or guest rooms are dedicated for low income households, or at least 11% of the total units or guest rooms are dedicated for very low income households, for at least 55 years, where a covenant has been made with the Housing and Community Investment Department. Such a covenant shall also ensure that projects using this exemption are subject to the replacement policy found in Government Code Section 65915(c)(3). For the
31 Draft Affordable Housing Linkage Fee Ordinance CPC CA Page 3-2/23/17 purposes of this section, total units includes units added by a density bonus or other land use incentive. 4. Any Development Project being constructed by a government or institution such as a hospital, school, museum, homeless shelter or other similar projects that are intended for community use, as determined by the Director of Planning. 5. A single-family detached home meeting one or more of the following conditions: a. Any addition of up to 2,000 square feet to an existing single-family detached home located in a single-family or multiple-family zone. b. New construction of any single-family detached home located in a single-family zone that is less than 2,000 square feet. c. Any replacement of a single-family detached home resulting in a net increase of less than 2,000 square feet from the prior home that existed on the property. 6. A Second Dwelling Unit as defined by Section of this code, or an Accessory Dwelling Unit as defined by California Government Code Section Any project located within the boundaries of the Central City West Specific Plan Area, as defined in Ordinance No. 163,094, if the Applicant by covenant and agreement or development agreement to abide by the Linkage fee and replacement housing obligations set forth in the Specific Plan for the Central City West Area. 8. If a residential project is subject to a greater affordable housing fee requirement pursuant to the Mello Act to satisfy a project s inclusionary housing Mello obligations, or is required to provide one or more physical housing units to satisfy inclusionary housing Mello obligations, the residential component of the project shall be exempt from the linkage fee and will be subject to Mello requirements. Commercial portions of mixed-use Coastal Zone projects shall be analyzed separately from residential portions of mixed-use projects for the purposes of the linkage fee. Commercial portions of such projects shall be subject to the linkage fee ordinance. The provision of housing units or in-lieu fees to satisfy replacement housing obligations under the Mello Act (as opposed to inclusionary housing obligations) shall not exempt a project from the linkage fee ordinance. 9. If a residential or mixed-use Development Project is subject to affordable housing requirements pursuant to any land use policy or ordinance or development agreement that exceeds the Linkage Fee requirements in either fee amount or onsite affordable housing, that project shall be exempt from the linkage fee. 10. If a residential or mixed-use Development Project is subject to affordable housing and labor requirements pursuant to LAMC (Measure JJJ), that project shall be exempt from the linkage fee.
32 Draft Affordable Housing Linkage Fee Ordinance CPC CA Page 4-2/23/ Any Grocery Store. For the purposes of this Section, a Grocery Store shall be defined as a Retail Use of which greater than one half of the floor area is devoted to the sale of food items intended for consumption or use off the premises, excluding alcoholic beverages. 12. Any Adaptive Reuse Project that is a designated Historic-Cultural Monument and is being converted to a residential use. (c) Deductions or Credits. 1. Change of Use. If the Development Project is the result of a change of use from commercial or industrial to residential, the Linkage Fee to be paid is the result of subtracting the equivalent fee amount that either was paid or would have been paid based on the pre-existing use from the fee requirement amounts below. 2. Affordable Housing Units. Any Restricted Affordable Units as defined in A.25 may be subtracted from the total number of dwelling units or guest rooms in a building in determining the required Linkage Fee. 3. Mixed Use. The first 25,000 square feet of nonresidential use in a mixed-use building shall be excluded from the calculation of floor area. 4. Land Dedication. If the Department of Housing and Community Investment Department accepts, on behalf of the City, an offer to dedicate for the purpose of building affordable housing, the value of the land, as demonstrated as the average of two independent appraisals funded by the applicant, may be deducted from the Fee amount. SEC FEE REQUIREMENTS The regulations, requirements and provisions of this chapter shall apply to any Development Project. The applicant for any such project, as a condition of its building permit, must pay to the City those Linkage Fees necessary to mitigate the increased demand for affordable housing which are anticipated to be generated by or attributable to such development project, as set forth in this chapter. The Linkage Fee shall be calculated for each development project as the amount of new or added floor area, as defined for non-residential uses in Section of this Code and for residential uses in Section A.29(c)(1) of this Code, in the Development Project devoted to the following uses, as determined by the Department of Building and Safety, multiplied by the amount of the applicable fee, as found below or in the most recent Linkage Fee Schedule, at the time of a Complete Building Permit Application, minus any deductions or credits.
33 Draft Affordable Housing Linkage Fee Ordinance CPC CA Page 5-2/23/17 Type of Use Nonresidential Uses including Hotels Fee Per Square Foot $5 Residential Uses $12 (a) Annual Adjustments. The Linkage Fee amount in the Linkage Fee Schedule shall be adjusted for inflation annually beginning on July 1, 2018, by the Director in accordance with the latest change in year-over-year Consumer Price Index for Urban Consumers (CPI-U) for the Los Angeles-Riverside-Orange County area, or if such index ceases to be published, by an equivalent index chosen by the Director. (b) Payment of Linkage Fee. The Linkage Fee is due and payable by the Applicant prior to the issuance of a building permit. No additional fee shall be required for projects seeking extension of expired building permits. (c) Refunds of Linkage Fee. Any fee paid under the provisions of this article may be refunded to the Applicant if the application for the building permit has expired and was not utilized to begin construction of the project. Section 2. Section in Article 6 of Chapter 1 of the Los Angeles Municipal Code is amended to read: SEC SPECIAL PROVISIONS FOR OTHER LAND USE PROCEEDINGS. Notwithstanding any provision of Articles 1 through 9 of Chapter I of this Code or any other ordinance to the contrary, with respect to those uses, buildings and sites destroyed or damaged in connection with a declared emergency, and in the area covered by the declaration of emergency, the following exceptions shall apply: C. Payment of the Linkage Fee pursuant to Article Section 3. Chapter 172 of the Administrative Code is added to read: CHAPTER 172 HOUSING IMPACT TRUST FUND Sec Creation and Administration of the Housing Impact Trust Fund (a) There is hereby created and established within the Treasury of the City of Los Angeles a special fund to be known as the City of Los Angeles Housing Impact Trust Fund (the Fund ) for the purposes of complying with the California Mitigation Fee Act to maintain separate accounting for impact fees. The total Affordable
34 Draft Affordable Housing Linkage Fee Ordinance CPC CA Page 6-2/23/17 Housing Linkage Fee revenues received by the City pursuant to Article 1.18, shall be placed in the Housing Impact Trust Fund. The Mayor and City Council may establish additional revenue sources and appropriate funds for deposit in the Fund from time to time. The Fund shall be administered by the Housing and Community Investment Department ( HCID ). (b) The money from the Fund shall only be expended within the boundaries of the City of Los Angeles to address the evolving and varied affordable housing needs of the City, pursuant to guidelines (the Guidelines ) promulgated for this purpose by HCID. The Guidelines and any amendments thereto shall be approved by the City Council. (c) The Housing Impact Trust Fund, including accrued interest, shall be subject to reporting requirements for purposes of accounting and expenditure of the Fund to increase the supply of affordable housing in the City of Los Angeles. Annually, HCID shall prepare for City Council consideration a report detailing the amount and source of all Fund revenues generated and funds disbursed as a result of the Affordable Housing Linkage Fee ordinance. (d) In compliance with the California Mitigation Fee Act, for the fifth fiscal year following the first deposit into the Fund, and every five years thereafter, and only if any unexpended funds remain in the Housing Impact Trust Fund, whether committed or uncommitted, HCID shall make the following additional findings: (1) Identify the purpose of imposing the fee; (2) Demonstrate a reasonable relationship between the fee and the purpose for which is it charged; (3) Identify all the sources and funding amounts anticipated to complete financing of affordable housing projects; (4) Designate the approximate dates HCID expects the funding for uncompleted or unfunded affordable housing projects to be deposited in the Fund; (5) Failure to make the five-year findings requires HCID refund the monies on a prorated basis to the owner of record of the project sites originally contributing to the Fund. (e) All monies loaned from the Fund shall be repaid to the Fund in accordance with the terms of the loan. The repaid principal and interest shall be placed in the Fund. (f) Any gifts, contributions or other money received for the stated purposes of the Fund shall be placed in the Fund. All interest earnings accruing on money in the Fund shall become part of the Fund. Money in the Fund shall not revert to the Reserve Fund of the City. (g) The General Manager of HCID or his or her designee shall make recommendations to the City Council for expenditures from the Fund. No expenditure may be made
35 Draft Affordable Housing Linkage Fee Ordinance CPC CA Page 7-2/23/17 from the Fund without the prior approval of the Mayor and City Council, unless otherwise authorized by the Guidelines.
36 EXHIBIT B: Environmental Clearance B1: Statutory Exemption B2: Negative Declaration CPC CA February 23, 2017
37 CPC CA Exhibit B.1 Statutory Exemption 02/23/17 Affordable Housing Linkage Fee Ordinance CPC CA CEQA Compliance Statutory Exemption Project Description An ordinance amending Section of the Los Angeles Municipal Code, establishing an Affordable Housing Linkage Fee, and directing Linkage Fees derived from Development Projects to the Affordable Housing Trust Fund. Summary The proposed ordinance is not a project under CEQA pursuant to CEQA Guidelines section (b)(4), which provides that CEQA does not apply to the creation of governmental funding mechanisms that do not involve a commitment to a particular project which may result in a significant impact to the environment. The ordinance does not identify any specific future project or projects which can be singled out as resulting in an environmental impact. Therefore, the Affordable Housing Linkage Fee is not considered a project, and thus not subject to CEQA. Further, the proposed ordinance qualifies under the common sense CEQA exemption pursuant to CEQA Guidelines Section 15061(b)(3), which provides that, where it can be seen with certainty that there is no possibility that a project may have a significant effect on the environment, the project is not subject to CEQA. CEQA only applies to projects that have the potential to cause a significant effect on the environment either through a direct impact or reasonably foreseeable indirect impact. The proposed ordinance does not have that possibility. As stated, because the ordinance does not commit funds directly to any specific future development project, it will not cause any direct impact on the environment. At this point in time it would be speculative to evaluate the impacts of any such project which would be subject to payment of the linkage fee, or which would receive project funding as a result of this ordinance. Further, any potential indirect impact of the ordinance on the environment will be minor as the proposed Linkage Fee is not anticipated to alter existing development patterns. As supported by the Nexus Study provided in Exhibit C, the City reasonably expects that implementation of the ordinance will not affect the number, type, size or location of development projects built in the City, due to the fact that the fee has been designed to be feasible across all market conditions and product types throughout Los Angeles. As such, the ordinance is unlikely to create any foreseeable direct or indirect physical impact on the environment. Current Environment For the purpose of CEQA, the analysis of potential environmental impacts from a project is based upon a comparison of the potential impacts of a project within the baseline. The baseline is generally the existing conditions at the time the City commences the environmental review of the project (CEQA Guidelines, Section 15125(a)).
38 CPC CA Exhibit B.1 Statutory Exemption 02/23/17 The City collected data on current market conditions and development patterns throughout Los Angeles as part of the Nexus Study analysis. The purpose of this study was to identify the need for affordable housing created by baseline levels of commercial and residential development. The Affordable Housing Linkage Fee is intended precisely to mitigate these impacts. Data on building permits issued between the years 2011 to 2015 across a variety of land use types and geographies were collected to document existing development patterns. These data show that during this time, on average, the City permitted approximately 5.7 million square feet of commercial space and 14.0 million square feet of residential space per year. Of this, a total of 2.78 million square feet per year of commercial square footage was dedicated to employmentgenerating commercial uses, of which the three most common uses were commercial office, retail, and warehouse/light industrial. The most significant portion of permitted residential square footage was in multifamily rental, averaging 8,268 units in 9.8 million square feet annually. The graphs shown in Figures 1 and 2 display the annual average for residential and commercial development permitted during the period. Figure 1. Average Annual Permitted Sq. Ft., Employment-Generating Uses, LA , , , ,037 17,331 34, , , ,000 1,000,000 1,500,000 2,000,000 2,500,000 3,000,000 Commercial Office Retail Warehouse/Light Ind Institutional Hotel/Motel Medical & Soc Services Industrial Creative Office Source: LA Permit Data, BAE, 2016.
39 CPC CA Exhibit B.1 Statutory Exemption 02/23/17 Figure 2. Average Annual Residential Units Permitted, City of LA, , Multifamily Rental Single Family Detached Single Family Attchd/Townhouse Multifamily Condominium 0 2,000 4,000 6,000 8,000 10,000 Sources: LA Permit Data, BAE, Current market conditions across a range of submarkets were evaluated in order to conduct a financial feasibility analysis. To conduct this analysis, the City was divided into 114 subgeographies, enabling fine-grained analysis of market differentiation by neighborhood. Each neighborhood was classified by market condition into Low, Medium, or High. For commercial uses, a composite index of office and retail rents were analyzed for each neighborhood, based on the standard deviation from the mean office and retail rents throughout the City. For residential uses, a similar methodology was used based on rent and sale price data for units built in 2006 or later. Additional details on the methodology and results of this analysis are available in the full text of the Nexus Study included in Exhibit C. The intent of this feasibility analysis was to ensure that the Housing Impact Fee does not significantly alter development patterns, as it is designed to be responsive to local market conditions. Proposed fee levels are derived from this feasibility study, in order to sure that the fee is supported by market conditions and developer expectations throughout the City. As such, the City reasonably expects that development patterns will not be substantially altered from the baseline as a result of this ordinance. Proposed Ordinance The proposed ordinance introduces new regulations to establish the Affordable Housing Linkage Fee, a fee levied on new development meeting specific criteria to mitigate that development s impact on the demand for affordable housing. Any residential or commercial development that requires a building permit and creates additional demand for affordable housing through the creation of additional housing units or nonresidential floor area is subject to the Affordable Housing Linkage Fee. Specifically, this ordinance applies to any multifamily residential building with more than five units, any new construction of a single-family detached home resulting in an increase of 2,000 square feet or more from the prior home, any addition to an existing single-
40 CPC CA Exhibit B.1 Statutory Exemption 02/23/17 family detached home of 2,000 square feet or more, and any nonresidential development with 25,000 square feet or more of new floor area. Exemptions would apply to residential developments which include a specified minimum percentage of affordable housing units (40% moderate income, 20% low-income or 11% very low-income), second dwelling units (accessory dwelling units), projects located within the Central City West Specific Plan Area, projects subject to greater affordable housing requirements, or adaptive reuse of any Historic Cultural Monument. Additionally, for mixed-use projects, the first 25,000 square feet of nonresidential use would be excluded from the fee calculation. Common areas such as gyms or community rooms in multifamily buildings would also be excluded. The amount of the Linkage Fee will differ based on building use. The fee amount will be calculated for each development project as the amount of floor area dedicated to each use type, multiplied by the fee level for that use. The proposed initial fee schedule is $5 per square foot for nonresidential uses, including hotels, and $12 per square foot for residential uses. An annual adjustment would be made to the fees based on the change in Consumer Price Index (CPI-U). Fees generated as a result of this ordinance may be used to fund the construction of new units, or for the rehabilitation and preservation of existing affordable units. Fee revenue will be directed to a new Housing Impact Trust Fund, which would be managed by the Housing and Community Investment Department (HCID). Analysis Not a Project Under CEQA CEQA Guidelines Section 15378(b)(4) The proposed Affordable Housing Linkage Fee ordinance is precisely intended to create a City of Los Angeles funding mechanism for affordable housing, but the Linkage Fee does not include any specific commitment to an individual project or any specific collection of individually identified projects. Rather, the Affordable Housing Linkage Fee ordinance is intended to enable the City to enhance and improve the availability of affordable housing opportunities in general, based on the increased need for such housing attributable to new residential and commercial development within the City. The Linkage Fee ordinance does not commit the City to use this investment to fund any specific, readily identifiable future project or projects that can be singled out as resulting in a potentially significant environmental impact. As such, the Affordable Housing Linkage Fee ordinance is not considered a project under CEQA Guidelines section (b)(4), and thus is not subject to CEQA. Common Sense Exemption - CEQA Guidelines Section 15061(b)(3) A reasonable argument could be made that the imposition of the Affordable Housing Linkage Fee may have the potential to indirectly impact the physical environment by affecting development patterns. Placing a fee on new development may indirectly influence development and investment decisions, leading to some perceivable change in how development occurs. This would be possible if the imposed fee were high enough to impact overall financial feasibility of a given development project. If such an argument were shown to be valid, it is possible that the ordinance
41 CPC CA Exhibit B.1 Statutory Exemption 02/23/17 would potentially require analysis under CEQA. However, the City s analysis, as substantiated by the Nexus Study, shows that the Affordable Housing Linkage Fee ordinance is not anticipated to significantly alter development patterns, and thus has no discernable direct or indirect environmental impact. The proposed fees were selected based on a conservative financial analysis provided in the Nexus Study. A detailed analysis was performed on several prototypical residential and commercial product types across the City to determine the maximum feasible fee which could be placed on new development without impacting the project s expected financial returns. This analysis was stratified across three geographies categorized as Low Market Area, Medium Market Area, and High Market Area which were determined based on a detailed assessment of median residential and commercial rental and sales prices in 114 neighborhoods. Additional details on the methodology and results of this analysis are available in the full text of the Nexus Study, provided in Exhibit C. As a result of the analysis contained in the Nexus Study, the City developed a range of feasible linkage fees which could be placed on new development in each market area. Any fee amount which is equal to or less than these feasible fee amounts can be expected to have minimal to no impact on development patterns. These fees are shown in Figure 3 below. Figure 3. Maximum Feasible Fees and Proposed Fees, $ per square foot Use Feasible Fee (High) Feasible Fee (Medium) Proposed Fee COMMERCIAL Office $33 $15 $5 Retail $28 $7 $5 Hotel $25 $5 $5 Industrial $20 $14 $5 Warehouse $25 $5 $5 Medical $35 $35 $5 RESIDENTIAL Multi-Family Rental $24 $18 $12 Multi-Family Condo $45 $22 $12 Single-Family Attached $32 $26 $12 Single-Family Detached $49 $31 $12 The proposed Linkage Fee is designed to be feasible in all market areas, simplifying the various feasible fee amounts to a single fee for commercial ($5 per square foot) and residential ($12 per square foot) development that would apply citywide. Because the fees would apply citywide, including Low Market Areas, the draft fee levels are generally lower than what is considered to be supportable in Medium and High Market Areas. The draft fees were also lowered below the levels supported by the study's feasibility analysis because these calculations were made during a period of relatively high rents and sale prices, and the fee should be supportable during all market cycles. As a result of this analysis, it can reasonably be concluded that the proposed fee levels are low enough so as to have no discernable impact on development patterns. While the results of the
42 CPC CA Exhibit B.1 Statutory Exemption 02/23/17 Nexus Study imply that new development projects in Low Market Areas would be the most highly impacted by the Linkage Fee, data on building permits in this area show that this may not be a significant concern. Analysis of building permit data in this region between 2011 and 2015 reveals that 60% of all development in Low Market Areas would be exempt from the Affordable Housing Linkage Fee based on the recommended exemptions described above (compared to 44% citywide). Only 22% of all building activity takes place in Low Market Areas, yet this area accounts for nearly a third of all projects in the City that would be exempt from the fee. This analysis reveals that if baseline conditions continue, only a portion of new development in these market areas would be subject to the Linkage Fee. As a result, any potential impact on development patterns in this area are expected to be minimal. Figure 4. Building Permits, New Construction, 2011 to 2015 Building Type Total Citywide Total Low Market Area % in Low Market Area Accessory Living Quarters % Second Dwelling Units~ % Apartment, 5 units or less~ 1, % Apartment, >5 units % Apartment, Affordable~ % Condominium % Senior Independent Housing % Single - family Attached % Single-family Detached, New or Replacement <2,000 sq. ft.~ Single - family Detached, New or Replacement 2,000+ sq. ft. 1, % 2, % Mixed use, <25,000 sq. ft.~ % Mixed use, 25,000+ sq. ft.~ % Commercial, <25,000 sq. ft.~ %
43 CPC CA Exhibit B.1 Statutory Exemption 02/23/17 Commercial, 25,000 sq. ft % Commercial, non-profit or governmental~ % Total Buildings 7,886 1, % Total Exempt Buildings 3,485 1, % Source: LA Permit Data. ~ Exempt from AHLF or deduction applies. Subsequent Environmental Review All future affordable housing projects that receive financial assistance through the Affordable Housing Linkage Fee program will be subject to environmental review at such time as approvals for those projects are considered. Individual projects may, or may not be found to be individually exempt from CEQA on the basis of their unique characteristics. That decision can only be made at a later date, when the investment in a specific project is identified. The exemptions from CEQA that apply to the establishment of the Affordable Housing Linkage Fee program do not apply to the individual projects funded by the Linkage Fee program. Furthermore, the Affordable Housing Linkage Fee program is not intended to provide a means for exempting any future development projects of any sort from the requirements of CEQA, simply by payment of established fees. Instead, all future development projects will undergo CEQA review as appropriate and applicable to their unique characteristics, and payment of fees pursuant to the Affordable Housing Linkage Fee ordinance may satisfy certain mitigation measures otherwise currently exacted by the City through ad hoc negotiations.
44 ENV ND Exhibit B.2 Negative Declaration 2/23/17 Affordable Housing Linkage Fee Ordinance CPC CA EVALUATION CEQA Compliance Negative Declaration Summary Below is a discussion of the potential impacts in each environmental topic area. In most cases, topic areas are not impacted at all, or only tangentially. In cases where there may be a potential effect, the net result would be minor. As a result, the preliminary study finds no potential impacts. This evaluation is a review of the impact of the Affordable Housing Linkage Fee on development patterns and behavior throughout the City of Los Angeles. Aesthetics The Affordable Housing Linkage Fee ordinance would have no impact on the physical size, shape or aesthetics of new residential and commercial development. The fee is designed to be feasible given current construction costs and development conditions in a variety of market conditions, and as such should have no impact on the aesthetics of future projects. Furthermore, as no new construction is specifically proposed in this ordinance, there will be no impact to scenic vistas, scenic resources, visual character or quality, or light quality. Any future development and resulting structures would be subject to the same building and environmental review process that currently exists and impacts to aesthetics would be subject to subsequent environmental review and analyzed during the application process. Mitigation Measures: None. Conclusion: No impact to aesthetics. Agriculture and Forestry Resources The amendment will not directly or indirectly result in the loss or conversion of any Prime Farmland, Unique Farmland, or Farmland of Statewide Importance. No loss of forest land or conversion of forest land to non-forest land will occur. Mitigation Measures: None. Conclusion: No impact to agricultural resources. Air Quality The proposed amendment will not obstruct the implementation of South Coast Air Quality Management District plans, nor will it violate any air quality standard or contribute substantially to an existing or projected air quality violation. As no construction is proposed, it will not result in the cumulative net increase of any criteria pollutant for which the project is non-attainment, expose
45 ENV ND Exhibit B.2 Negative Declaration 2/23/17 sensitive receptors to pollutants, or create objectionable odors. Any future development and resulting structures would be subject to the same building and environmental review process that currently exists and impacts to sensitive receptors and the creation of objectionable odors would be subject to subsequent environmental review and analyzed during the application process. Mitigation Measures: None. Conclusion: No impact to air quality. Biological Resources The proposed text amendment will not impact state or federally listed species, riparian habitat, wetlands, sensitive natural communities, migratory fish or wildlife species, adopted Habitat Conservation Plan, Natural Community Plan, trees, or marine animals. No construction is proposed as part of this amendment. Future development projects will be subject to subsequent environmental review and will be evaluated for potential impacts to biological resources. Mitigation Measures: None. Conclusion: No impact to biological resources. Cultural Resources The proposed amendment does not commit funding to any specified development project, and as such will not bear any direct or indirect impact on historical, archeological, paleontological, or other cultural resources. Future development projects will be subject to subsequent environmental review and will be evaluated for potential impacts to cultural resources at that time. Mitigation Measures: None. Conclusion: No impact to cultural resources. Geology and Soils The proposed ordinance would not increase the potential to expose more people to strong seismic ground shaking, ground failure, soil erosion or landslides than under baseline conditions in the current environment. All future development would have required soils reports and foundation plans that respond to the regional soils and potential for ground shaking. Mitigation Measures: None. Conclusion: No impact to geology and soils. Greenhouse Gas Emissions The amendment will not cause an increase in cumulative greenhouse gas emissions nor will it conflict with an applicable plan, policy, or regulation adopted for the purposes of reducing
46 ENV ND Exhibit B.2 Negative Declaration 2/23/17 greenhouse gases. Any future structures and uses would be subject to environmental review and potential impacts to greenhouse gas emissions would be analyzed at that time. Mitigation Measures: None. Conclusion: No impact to greenhouse gas emissions. Hazards and Hazardous Materials The proposed amendment does not involve the commitment of funds to any specific project, and as such will not have any impact on the routine transport, use or disposal of hazardous materials. The ordinance will not create any significant hazards through the release of hazardous materials nor interfere with any adopted emergency response or emergency evacuation plans. Any future structures and uses would be subject to environmental review and potential impacts to hazards and hazardous materials would be analyzed at that time. Mitigation Measures: None. Conclusion: No impact to hazards or hazardous materials. Hydrology and Water Quality The Affordable Housing Linkage Fee ordinance does not commit funding to any specified development project, and as such will not bear any direct or indirect impact on run-off, surface water body, groundwater supplies, hydrology, or water quality. Future development projects will be subject to subsequent environmental review and will be evaluated for potential impacts to hydrology and water quality at that time. Mitigation Measures: None. Conclusion: No impact to hydrology and water quality. Land Use and Planning The Affordable Housing Linkage Fee ordinance does not conflict with any applicable land use plan, policy, or regulation of an agency with jurisdiction over the project. Any subsequent development projects will be subject to environmental review and will be evaluated for potential impacts to land use and planning at that time. Mitigation Measures: None. Conclusion: No impact to land use and planning. Mineral Resources The Affordable Housing Linkage Fee ordinance will have no effect on mineral resources locally or regionally, either in availability or future value. No loss or use of known mineral resources will
47 ENV ND Exhibit B.2 Negative Declaration 2/23/17 occur. Any future development projects will be subject to environmental review and will be evaluated for any potential impacts to mineral resources at that time. Mitigation Measures: None. Conclusion: No impact to mineral resources. Noise The Affordable Housing Linkage Fee ordinance does not expose additional persons to, or generate, excess noise levels, as it does not directly generate new development. As discussed in this report, the ordinance is not expected to have any impact on development patterns and as such it can reasonably be concluded that the ordinance will not result in any impacts to noise. Any future development projects will be subject to environmental review and will be evaluated for any potential impacts to noise at that time. Mitigation Measures: None. Conclusion: No impact to noise. Population and Housing The Affordable Housing Linkage Fee ordinance is designed to respond to existing demand for affordable housing, and will not induce substantial population growth in an area, either directly or indirectly. As explained in this report and substantiated by the Nexus Study, the ordinance will not directly result in any impacts to baseline development patterns. Additionally, the ordinance will not result in indirect significant impacts. The City s analysis shows that the ordinance is not likely to slow or reduce the development of housing or result in a net loss of existing housing units affordable to very low- or low-income households (as defined by federal and/or City standards), through demolition, conversion, or other means. Mitigation Measures: None. Conclusion: No impact to population or housing. Public Services The Affordable Housing Linkage Fee ordinance would not adversely impact response time or service ratios for fire protection, police protection, schools, parks, or other public facilities. No funds are committed to any specific project at this time, and as such the ordinance will not impact public services. Any future development projects will be subject to environmental review and will be evaluated for any potential impacts to public services at that time. Mitigation Measures: None. Conclusion: No impact to public services.
48 ENV ND Exhibit B.2 Negative Declaration 2/23/17 Recreation The proposed ordinance would not increase the use of existing neighborhood and regional parks or other recreational facilities such that substantial physical deterioration of the facility would occur or be accelerated. As the ordinance does not commit funds to any specific project, the project would not include any recreational facilities nor necessitate the construction or expansion of recreational facilities. Any future development project would be subject to environmental review and would be evaluated for any potential impacts to recreation at that time. Mitigation Measures: None. Conclusion: No impact to recreation. Transportation and Traffic The proposed ordinance would not substantially affect circulation, congestion, or traffic patterns, nor would it increase hazards, result in incompatible uses, or impact emergency access. As the ordinance does not commit funds to any specific project, nor will it alter baseline development patterns, there are no impacts on traffic and capacity of the street system. Any future development project would be subject to environmental review and would be evaluated for any potential impacts to transportation and traffic at that time. Mitigation Measures: None. Conclusion: No impact to Transportation and Traffic. Utilities and Service Systems The proposed ordinance will not violate any water or wastewater treatment requirements or contribute substantially to wastewater generation. As no construction is proposed, the ordinance will not result in a need for new water or wastewater treatment facilities. Any future development and resulting structures would be subject to the same building and environmental review process that currently exists, and any potential impacts to utilities and service systems would be analyzed at that time. Mitigation Measures: None. Conclusion: No impact to utilities and service systems. CONCLUSION Based upon results of the Nexus Study, as well as the other information set forth above, in the staff report related to this ordinance and the substantial evidence contained in the whole of the record of proceedings, the City has determined that it can be seen with certainty that there is no possibility the adoption and enforcement of this ordinance may have a significant effect on the environment.

49

50
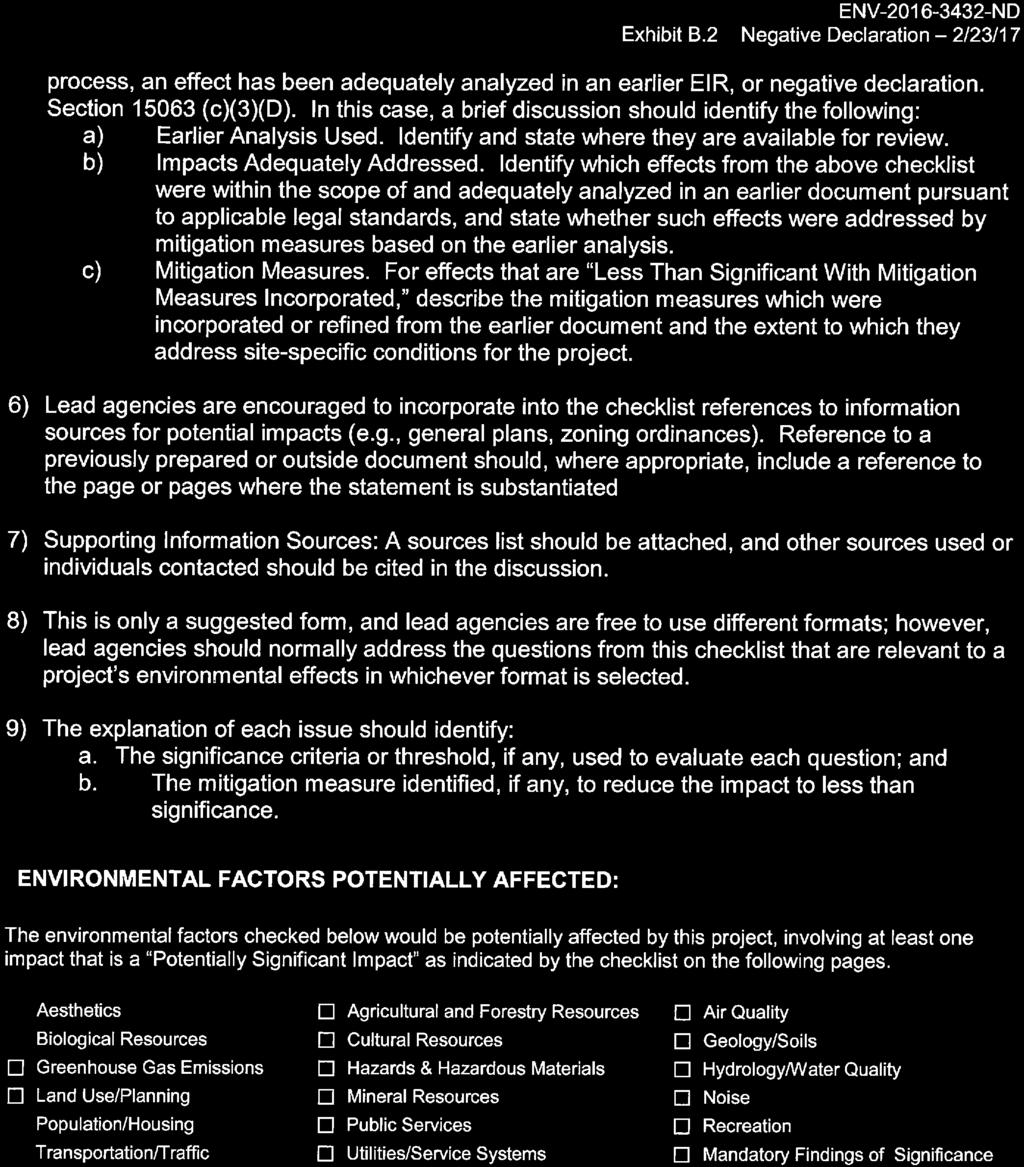
51

52

53

54

55
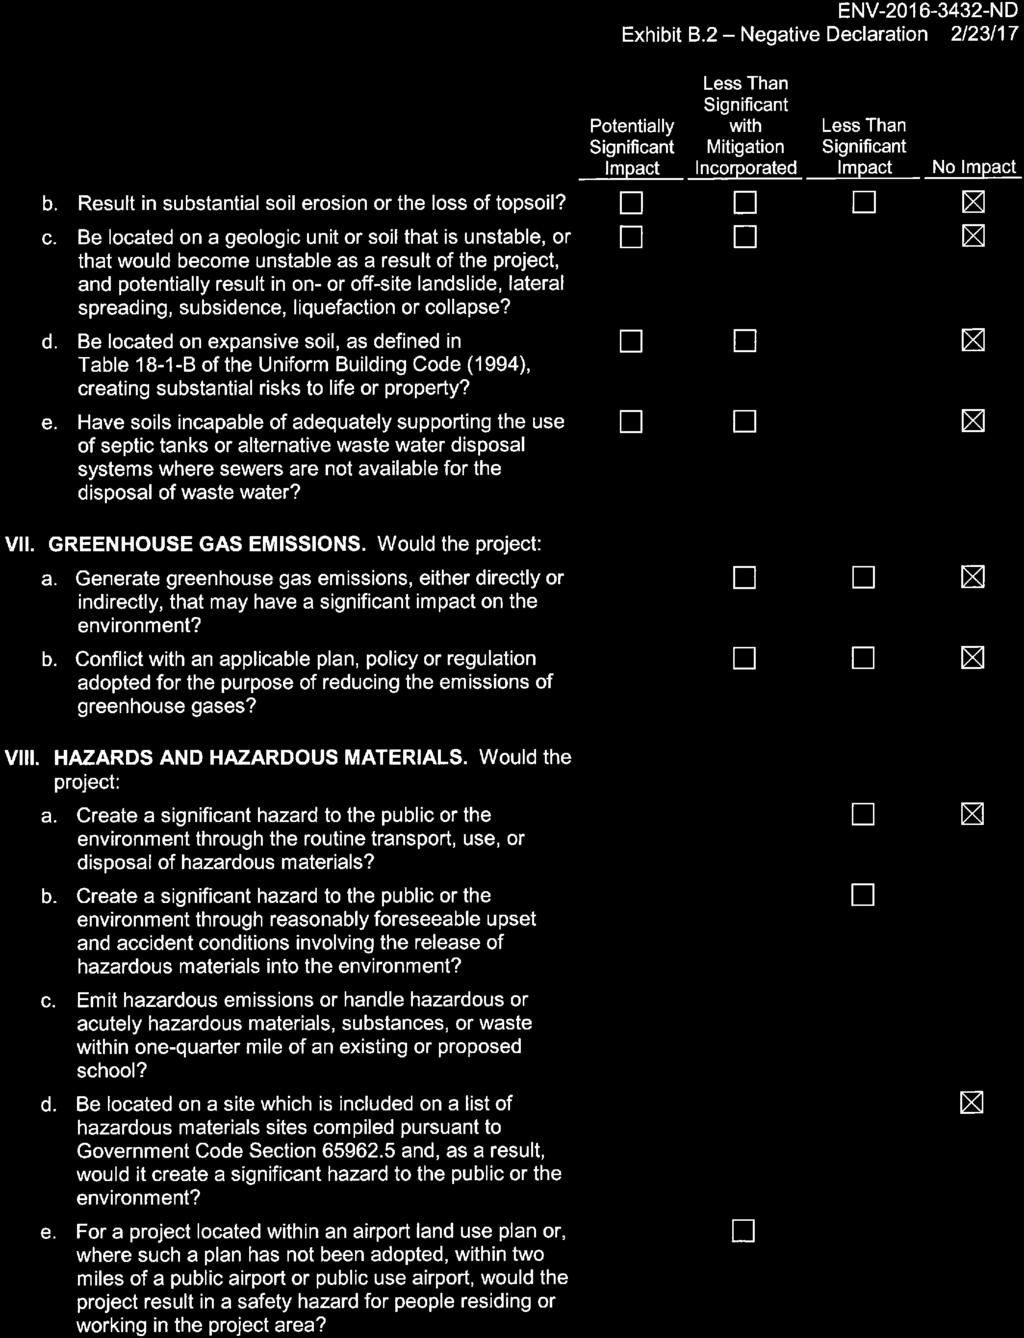
56

57
58
59
60
61

62
63 EXHIBIT C: Affordable Housing Linkage Fee Nexus Study CPC CA February 23, 2017
64 bae urban economics In association with PlaceWorks Los Angeles Affordable Housing Linkage Fee Nexus Study Prepared for City of Los Angeles September 21, 2016 Photo Credit: Steve Lacap, KSA Design Studio
65 bae urban economics September 21, 2016 Vincent P. Bertoni, Director of Planning 200 N. Spring Street, Room 525 Los Angeles, CA Rushmore D. Cervantes, General Manager Los Angeles Housing + Community Investment Department 1200 West 7th Street, 9th Floor Los Angeles, CA Dear Mr. Bertoni and Mr. Cervantes: We are pleased to submit the Los Angeles Affordable Housing Linkage Fee Nexus Study. The Study analyzes the relationship between new development and affordable housing impacts for two kinds of fees: those that could be charged to new commercial development, and those that could be charged to new market-rate residential development. We have also profiled how these fees are structured and implemented in numerous other case study cities, provided feasibility testing across common land uses in Los Angeles segmented by market condition, and suggested methods for structuring a fee program to implement both kinds of fees over the next few years in the City of Los Angeles. We have enjoyed working with your staff and members of the development and affordable housing communities. Please let us know if you have any comments or questions regarding this report. Sincerely, Janet Smith-Heimer, MBA President, BAE San Francisco Sacramento Los Angeles Washington DC New York City th St., Suite nd St., Suite A 706 S. Hill St., Suite I St. NW, Suite West 27 th St., Suite 10W Berkeley, CA Davis, CA Los Angeles, CA Washington, DC New York, NY
66 Table of Contents INTRODUCTION... 1 Purpose of Nexus Study... 2 Study Process and Approach... 2 Overview of Report... 3 ABOUT COMMERCIAL FEES... 4 Overview of Commercial Fees... 4 Summary of Case Studies... 4 LOS ANGELES COMMERCIAL FEE NEXUS ANALYSIS... 8 Overview of Methodology... 8 Commercial Land Uses New Worker Households and Affordable Housing Need Financing Gap Maximum Legal Fee Feasibility of Maximum Legal Fee Commercial Fee Program Options & Estimated Revenues Considerations for Implementation ABOUT RESIDENTIAL FEES Overview of Residential Fees Summary of Case Studies LOS ANGELES RESIDENTIAL FEE ANALYSIS Overview of Methodology Residential Land Uses New Worker Households and Affordable Housing Need Subsidy Gap Maximum Legal Fee Feasibility of Maximum Legal Fee Residential Fee Program Options & Estimated Revenues Considerations for Implementation ADDITIONAL CONSIDERATIONS Effect of Los Angeles Minimum Wage Phase-In Schedule Option to Provide On-Site Units Voluntary Density Bonus vs. Market-Rate Housing Fee APPENDIX A: COMMERCIAL FEE CASE STUDIES APPENDIX B: COMMERCIAL BUILDING PERMIT ANALYSIS APPENDIX C: PRO FORMA ANALYSIS FOR COMMERCIAL LAND USES APPENDIX D: RESIDENTIAL FEE CASE STUDIES APPENDIX E: RESIDENTIAL BUILDING PERMIT ANALYSIS APPENDIX F: LOS ANGELES PUMAS APPENDIX G: OVERVIEW OF IMPLAN APPENDIX H: DETAILED PRO FORMA ANALYSIS FOR RESIDENTIAL LAND USES APPENDIX I: MINIMUM WAGE ANALYSIS
67 Tables Table 1: Summary of Commercial Fees for Affordable Housing... 5 Table 2: Employees and Households per 100,000 Square Feet Table 3: Industries by Land Use Type and Total Employment, LA County, Table 4: Distribution of New Worker Households by Income Table 5: Worker Households by Household Income Generated by Commercial Land Uses Table 6: Development Costs for Affordable Housing Units, City of Los Angeles, Table 7: Financing Gap Analysis, City of Los Angeles, Table 8: Maximum Commercial Fees, Los Angeles Table 9: Summary of Commercial Fee Pro Formas Table 10: Fee Schedule Options & Estimated Annual Revenue Table 11: Estimated Annual Commercial Fee Revenue with TIA Adjustments Table 12: Summary of Residential Fee Case Studies Table 13: New Multifamily Rental Housing Market Overview, Los Angeles, Table 14: New For-Sale Housing Market Overview, Los Angeles, Table 15: Household Income Required to Rent New Multifamily Units, Los Angeles, Table 16: Household Income Required to Purchase New Units, LA, Table 17: Income Level by Industry, Persons by 2014 Income Limits Table 18: Employment by Income Level from New 100-Unit Market-Rate Rental Project Table 19: Employment by Income Level from New 100-Unit Condominium Project Table 20: Employment from New 100-Unit Single-Family Attached Residential Project Table 21: Employment from New 100-Unit Single-Family Detached Residential Project Table 22: Development Costs for Affordable Housing, City of Los Angeles, Table 23: Financing Gap Analysis, City of Los Angeles, Table 24: Maximum Affordable Housing Impact Fee Calculations Table 25: Summary of Residential Pro Formas Table 26: Comparison of Residential Max Legal Fees to Feasible Fees Table 27: Revenue Estimates of Fee Program Options, Annual Average Table 28: Residential Estimate Fee Revenues with TIA Adjustments Table 29: Maximum Legal Commercial Fee, Future Minimum Wage Table 30: Maximum Legal Housing Fee Under Future Minimum Wage Requirements Table 31: On-site Units Needed to Mitigate Market-Rate Units Impact Table 32: California State Density Bonus Provisions Table 33: Units in Density Bonus Projects, City of Los Angeles, Table 34: Comparison of Density Bonus Outcomes to Housing Fee Outcomes Table 35: Affordable Housing Yield from Units On Site... 92
68 Figures Figure 1: Summary of Commercial Fee Nexus Methodology Figure 2: Average Annual Permitted New Space in Employment-Generating Uses, Figure 3: Commercial Market Condition By Neighborhood Figure 4: Office and Retail Permit Activity by Market Condition, Figure 5: Comparison of Maximum Legal Commercial Fees to Feasible Fees Figure 6: Commercial Market Areas & TIAs Figure 7: Estimate of Potential Annual Commercial Fee Revenue Figure 8: Summary of Market-Rate Housing Fee Methodology Figure 9: Average Annual New Permitted Residential Units, City of LA, Figure 10: Residential Neighborhood Market Conditions Figure 11: Residential Permit Activity by Market Condition, Figure 12: Comparison of Max Residential Legal Fees to Feasible Fees Figure 13: Residential Market Areas and TIAs Figure 14: Estimate of Potential Annual Residential Fee Revenue... 81
69 Acknowledgements We grateful acknowledge the input received from the following attendees at three workshops convened to comment on this study s analysis and findings: Workshop Attendees Alan Greenlee, Executive Director Ann Sewill, Vice President Housing and Economic Opportunity Bea Hsu, Senior Vice President, Development Bradley Karvasek, 1st Vice President Development Christine Rangel, Director of Government Affairs Cynthia Strathmann, Executive Director Daniel Falcon, Senior Vice President & Director of Los Angeles Operations Jim Andersen, Senior Vice President Joan Ling, Lecturer in Urban Planning Kasey Burke, President Lisa Payne, Policy Director Marie Rumsey, Director of Legislative Affairs Nancy Lewis Oliver Baker, Development Associate Paul Keller, Founding Principal and CEO Robin Hughes, President and CEO Simon Kaplan, Associate Development Manager Sissy Trinh, Founder and Executive Director Stephanie Klasky-Gamer, President and CEO Steve Coulter, Policy Director Steven Oh, Vice President, Development Scott Oullette, Director of Land Acquisition Ellen Golla, Land Acquisition Manager Matt Modrzejewski Randy Johnson Southern California Association of Non-Profit Housing (SCANPH) California Community Foundation Brookfield Residential Equity Residential Building Industry Association (BIA) Strategic Actions for a Just Economy (SAJE) McCormack Baron Salazar Trammell Crow UCLA Meta Housing Southern California Association of Nonprofit Housing (SCANPH) Central City Association of Los Angeles Nancy Lewis Associates CIM Group Mack Urban Abode Communities Mack Urban Southeast Asian Community Alliance LA Family Housing Los Angeles Business Council Related California Williams Homes Daniel Bernstein & Associates, Inc. California Home Builders Brookfield Residential
70 City Staff This study was prepared under the guidance of the following: City of Los Angeles Department of City Planning Claire Bowin, Senior City Planner Matthew Glesne, Housing Planner Los Angeles Housing + Community Investment Department Claudia Monterrosa, Director, Public Policy & Research Marisol Romero, Housing, Planning & Economic Analyst Consultant Team This study was prepared by the following members of the consultant team: BAE Urban Economics Janet Smith-Heimer, President Sherry Okun-Rudnak, Principal Jessica Hitchcock, Vice President Stephanie Hagar, Vice President Josh Rohmer, Vice President Aaron Barker, Associate PlaceWorks Karen Gulley, Principal Brant Birkeland, Associate
71 Introduction The City of Los Angeles faces an extraordinary housing crisis. In recent years, economic growth and strong demand for housing in Los Angeles have created substantial price and rent increases, causing more and more middle and lower income households to be priced out of the marketplace. The result has been an ever-widening gap for many households, between the cost of their housing and their incomes. This cycle has led to the need to produce more affordable housing units, at the same time that funding to subsidize affordable housing, has fallen. A few key statistics tell the story: Over 61 percent of renter households in the City of Los Angeles pay more than 30 percent of their income on housing (rent and utilities), per the American Community Survey. These approximately 490,000 households are considered costburdened and in need of affordable housing to lower this cost to an affordable level. 1 Between 2006 and 2013, the median renter household income decreased by nearly four percent after adjusting for inflation. This means that on average, the median renter household in Los Angeles received a pay cut of nearly $200 every year between 2006 and At the same time, LA median rents went the opposite direction, rising by almost 11 percent for the period after inflation. This mismatch between incomes and rents in LA grew more rapidly than any other major US city in the period. 2 In 2014, the median LA household income ($54,440) could afford a $179,000 house, compared to the median home sale price in that same year of $560, The 2016 Homeless Count found 28,464 homeless persons in the City of Los Angeles, and increase of almost 11 percent over These statistics are exacerbated by the fact that the City of Los Angeles has also lost much of its affordable housing funding in recent years, shrinking from $100 million in 2010 to $26 million in The decline in funding was primarily due to the demise of redevelopment (CRA/LA), as well as a drop in federal housing funds. Notably, Los Angeles is also the only large California city without a permanent source of local funding for production of affordable housing, which means that funding declines and the growing housing crisis have impacted Los Angeles dramatically. 1 US Census, American Community Survey, Renting in America s Largest Cities: NYU Furman Center/Capital One National Affordable Rental Housing Landscape (NYU Furman Center, 2015) 3 Housing Element (City of Los Angeles, Adopted December 3, 2013) Greater Los Angeles Homeless County (Los Angeles Homeless Services Authority, 2016) 1
72 As part of addressing the affordable housing crisis, Mayor Garcetti proposed that this study be prepared so that both a commercial affordable housing fee and a residential affordable housing fee can be fully considered. Purpose of Nexus Study The purpose of the Nexus Study is to conduct a legally defensible analysis of the relationships between commercial and market-rate housing development projects, the new employment generated, the new worker households, their income distributions, and an estimate of those households that will need affordable housing. The analysis also evaluates the cost to provide this housing for households earning up to 120 percent of Area Median Income, and analyzes the maximum fee per square foot of new development necessary to provide this housing. The Study also evaluates the these maximum legal fees in terms of their feasibility by land use prototype across three market conditions to reflect the range and diversity of real estate economics in the City of Los Angeles. This analysis also accommodates current and proposed other impact fees and their effects on project feasibility. Finally, the Study estimates potential revenues if fees were adopted, and analyzes considerations for implementation. Three additional issues are also considered in this report: the effects of the planned increase in Los Angeles s minimum wage by 2021, the option to provide affordable units on-site within market rate projects instead of a fee payment, and how the affordable housing fee might interact with the provision of units on-site in the case of density bonus projects. Study Process and Approach Process This study was commissioned in late spring 2016 by the City of Los Angeles. The consultant team of BAE Urban Economics, specialists in urban economics, along with PlaceWorks, specialists in public engagement, were engaged to conduct a nexus study for both commercial and residential fees along with outreach to the development and advocacy communities in Los Angeles. For each step in the study process, BAE conducted extensive research and analysis, as cited and documented in this report. Wherever possible, BAE developed data to support assumptions, as identified herein. In addition, BAE used a blend of standard methodologies to analyze nexus for employment generating uses, culled from court-tested and related analysis conducted across California during the past 20 years. In addition, wherever possible, this study s methodologies have sought to expand and more comprehensively document many of the foundational variables utilized by other cities, to tailor this study specifically to the Los Angeles real estate, employment, and housing markets. 2
73 To obtain input and preview preliminary findings from the study, a series of three workshops were held. Over 60 development companies, industry representatives, and policy advocates were invited. A list if attendees is included in the preface to this report. Approach This study includes extensive analysis of real estate project feasibility, to ensure that fees are set at levels that do not unduly constrain market rate projects. The feasibility analysis was prepared in an intentionally conservative manner, to accommodate the wide variation in project economics across Los Angeles. Wherever possible, the lower end of the range of revenue-related variables, and the higher end of the range of cost-related variables, was used. This approach was taken for two reasons: arguably, Los Angels is at the peak of the real estate cycle in 2016, and also, deeming a fee amount as feasible without a conservative approach would mean the fee could create downward pressure on market rate development. It is also important to note that Los Angeles, a major city without a permanent mechanism to fund affordable housing, will be essentially starting from scratch. Real estate economic theory suggests that over the long term, external costs such as impact fees, are absorbed by lower-than-otherwise land values (i.e., land residual ), so imposing an affordable housing fee, over time, will likely have this effect. For many markets, this is experienced as a slower than otherwise land value appreciation trend, and is often offset by the land residual derived from rising rents/sale prices. Nevertheless, that change of moving from no fee to a fee, will strike some as an undue burden, especially in the short run. This report highlights how this situation has been addressed in other cities, including strategies such as exempting all projects already in the entitlement pipeline (which would have been organized and initiated without knowledge of the fee), phasing in the fee over several years so that the market can adjust, and providing for targeted waivers and exemptions to accommodate cases where the fee may have unintended negative consequences. Overview of Report The following report is divided into two halves: a commercial fee study and a residential fee study. For each development type, the report follows a similar outline. First, case studies of other California cities as well as selected major cities elsewhere in the US with these fees, are summarized. Next, the nexus or relationship between new development in employmentgenerating uses, the resulting affordable housing need, and the translation of these findings to a maximum legal fee, are presented. Maximum fees are then tested for financial feasibility across three levels of market conditions affecting Los Angeles. Several potential fee structures and corresponding estimates of potential annual fee revenues are provided. The report also analyzes several additional considerations for fee structuring and implementation. 3
74 About Commercial Fees Overview of Commercial Fees Commercial impact fees for affordable housing have a long, established history in major cities across the US. The concept of a commercial linkage fee, in general, is to charge a fee on new commercial development projects over a specific size, to mitigate the impacts of new jobs created by the project within high-cost local housing markets. For some types of commercial development, these impacts can be substantial: new workers who cannot find affordable housing must commute long distances, or pay more than 30 percent of their household s income for housing, or double up in overcrowded units, or even live with all of these conditions present at once. Fees collected in many cities with established programs provide a significant local funding source for new affordable housing production. Although it may not technically be required, given recent court cases, this study was structured to comply with the California Mitigation Fee Act. This means this study demonstrates the direct relationship ( nexus ) between the fees charged and the new workers impacts. In addition, fees can not make up deficiencies in the local housing market created by other factors. Summary of Case Studies Appendix A profiles commercial linkage fee programs established in cities throughout California, including larger cities (e.g., San Francisco, Sacramento, Oakland, and San Diego), as well as smaller cities such as West Hollywood and Palo Alto. In addition, outside of California, the cities of Boston and Seattle are profiled. It should be noted that these profiles are not exhaustive; numerous other smaller cities in California have adopted or are currently considering adopting commercial impact fees for affordable housing. However, given the large size of the City of Los Angeles, but with real estate markets specific to its economic base, the selected case studies seek to profile both large city experiences, along with smaller cities located nearby facing similar affordable housing challenges. The table on the next page summarizes the case studies, with detail provided in Appendix A. 4
75 TABLE 1: SUMMARY OF COMMERCIAL FEES FOR AFFORDABLE HOUSING Popoulation (a) Fee/ Sq.Ft. Threshold Fees Collected Annual Rev. Per Capita (b) Notes Large Cities in CA with Fee San Francisco (1996/2015) 829,072 25,000 sq. ft. $3.4 M/year $4.04 Original program established in 1981 Entertainment $22.42 (avg since 1988) Exempts certain projects with Hotel $17.99 $27 million pharmacy or grocery Integrated PDR $18.89 in FY 14/15 Institutional $0.00 Office $24.03 PDR $0.00 R&D $16.01 Retail $22.42 Small Enterprise Workspace $18.89 San Diego (1990/2016) 1,341,510 $1.6 M/year $1.16 New fee rates effective January 2017 Office $2.12 (avg ) Hotel $1.28 R&D $0.80 Retail $1.28 Oakland (2002) 402,339 25,000 sq. ft. $171,000/year $0.42 Fees became effective in 2005 Office $5.44 (avg since 2005) City anticipates approx. $2.5 M Warehouse $5.44 in the next months Sacramento (1989) 476,075 $1.0 M/year $2.19 Citywide (avg ) Office $2.50 Hotel $2.38 R&D $2.12 Commercial $2.00 Manufacturing $1.57 Warehouse/Office $0.91 Warehouse $0.68 North Natomas Highway Commercial $2.74 Community/Neighborhood Commercial $2.06 Office/Business $2.06 M-50 $1.74 M-20 $1.44 Light Industrial $1.12 Smaller CA Cities with Fee West Hollywood (1989/2014) 35,053 10,000 sq. ft. $214,000 / year $6.11 Commercial Development $8.00 (avg since 2002) Palo Alto (1984/2016) 65,998 1,500 sq. ft., $2.3 M/year $34.85 Updated nexus study in 2016 Office/R&D $35.00 (in FY ) Hotel $30.00 Retail/Restaurant/Other $19.85 Major Cities Outside of CA with Fee Boston (1986/2013) 639, ,000 sq. ft. $5.1 M/year $8.05 Commercial Development $8.34 (avg ) Seattle (2015) (c) 637,850 NA (new) Incentive zoning program structured Downtown Harborfront 1 $0.00 to generate units. Many exemptions Downtown Harborfront 2 $14.83 for desired projects. Downtown Mixed Commercial $9.78 Downtown Office Core $14.50 Downtown Retail Core $13.50 Downtown Mixed Residential $14.34 International District Mixed $8.00 International District Residential $9.30 Pike Market Mixed $0.00 Pioneer Square Mixed $11.08 Seattle Mixed $6.69 Industrial Commercial $8.00 Commercial 2 $0.00 Industrial Commercial (Low/Med/High) $10.00 All other zones (Low) $5.00 All other zones (Medium) $7.00 All other zones (High) $8.00 Notes: (a) All population figures from American Community Survey. (b) Per capita annual average revenue based on ACS population estimates. Revenues are not adjusted for inflation, changes in fee rates, or other factors. (c) Amounts shown are averages for each general zone type. The complete fee schedule is contained in Section 23.58B.040 of the Seattle Municipal Code. Source: BAE,
76 Key points which emerge from the case studies include: Fee Charges and Structure Commercial fees for affordable housing charged by larger cities with a diverse real estate market range from a low of $0.68 per square foot for warehouse space in the City of Sacramento, to a high of $24.03 per square foot for office space in San Francisco. Palo Alto, a smaller city with very strong market conditions, charges $35.00 per square foot for office space, and is considering raising this charge to $60.00 per square foot. Each city has tailored its commercial fees to match its typical commercial development project categories. The categories of land use subject to commercial fees are typically small in number (e.g., 4 or 5 categories). Some cities have a fee zone approach, with fees for the same land use category varying by location. Others have a single fee per land use category. Some cities avoid the challenges of land use categorization by charging a flat fee for all commercial uses. West Hollywood, the only city in the set of commercial fee case studies in the greater Los Angeles region, uses this approach (e.g., a flat fee, with a recent increase that was phased in over a two-year period). In general, cities collect these types of fees either prior to, or at the point of building permit issuance. Several cities allow partial payment at permit issuance, with the balance paid at Certificate of Occupancy. Many cities have built-in annual increases for commercial fees, tied to the CPI or the Construction Cost Index published by Engineering News Record. Staff generally report a preference for this approach, instead of relying on a city council s periodic review. Waivers, Exemptions, and Refunds Most cities waive the fee for 100 percent affordable housing projects. Most cities offer a units in lieu of fee and/or land donation in lieu of fee option. All cities waive publicly-owned projects. Some cities waive non-profit buildings, and/or churches, schools (public and private), universities and colleges, and other similar categories of land use. Some cities exempt smaller buildings. For example, San Francisco does not charge a fee on commercial buildings smaller than 25,000 square feet. Many cities have created lower fees or offer exemptions to decrease the potential dampening effects of fees on certain types of development that are strongly desired to meet other policy objectives. An example of this approach includes San Francisco s exemptions for local grocery stores and pharmacies that provide needed neighborhood services. Some cities have established clear refund processes if projects are subsequently not constructed, while others allow for refund requests decided on a case-by-case basis. 6
77 During economic downturns, cities have either created special deferral programs or lowered fees across the board. These approaches demonstrate that these kinds of fees can be customized to adapt to downturns in the economic cycle. All cities in California have a hardship exemption available per legal requirements. Some cities render a hardship decision administratively; others have a more formal process. Revenues and Reporting Estimates of revenues collected from commercial fees range from less than $1 million to over $5 million per year, depending on the city s fee structure, size, and amount of commercial development activity. When analyzed on a per-capita basis to normalize for a particular city s size, fee revenues range from a low of $0.42 per capita in Sacramento (which has a very low fee schedule), to a mid-range of $6.11 in West Hollywood, to a high of $34.85 per capita in Palo Alto (which has a very active commercial development market with high real estate values). Most cities do not specifically track the use of the fees to build affordable housing projects, because the funds go into a trust fund and are used in combination with other sources that may have varying AMI targets or restrictions. San Francisco last reported its sources and uses of commercial linkage fees along with other revenue sources comprising its Affordable Housing Fund as part of a larger annual report for FY Its reporting does clearly show both source and use of each funding stream within its Affordable Housing Fund, along with remaining balances at year end. Sacramento has the clearest public information source of the cities profiled. Sacramento produces an online map showing commercial linkage fees resulting funded project locations. Most cities have general guidelines for use of commercial fee funds such as maximum AMI levels that can be served in new affordable units, rather than targeting the funds specifically to serve households with the greatest need (e.g., at-risk of homelessness/extremely low income/very low income). The City of Los Angeles, with great need for new affordable units serving extremely low and very low income households, may wish to develop policies to target commercial fee funds. 7
78 Los Angeles Commercial Fee Nexus Analysis Overview of Methodology The commercial fee analysis conducted for this report is based on the premise that new commercial land uses generate new employment for workers that will have a range of household incomes. Due to high housing costs in Los Angeles, new workers with extremely low, very low, low, or moderate household incomes will be unable to afford most market-rate housing in the City without incurring substantial cost burdens. This situation the increment of growth in new worker households facing the lack of affordable housing options - is considered the impact of new commercial development. The commercial fee would mitigate these impacts by generating revenue to support the construction of housing affordable to the new lower-income worker households. This section provides an overview of the steps used to determine the maximum legal commercial fee, based on the relationship ( nexus ) between new commercial space and the worker households generated by it who face affordable housing challenges in the City of Los Angeles. Each step is summarized below and discussed in more detail in the following sections. Step 1: Define Land Uses Based on City of Los Angeles building permit data and data from the California Employment Development Department, the Nexus Analysis identifies eight commercial land uses that comprise the vast majority of probable future employment-generating commercial land uses in the City, each of which are analyzed in the subsequent steps. Step 2: Determine Employment Densities For each land use identified in Step 1, the Nexus Analysis determines the average employment density and resulting number of workers per 100,000 square feet of each land use type. Step 3: Estimate Worker Households Since most households in Los Angeles include more than more worker, the Nexus Analysis grouped the employees generated by each land use into households to determine the total number of worker households generated by each land use type. Step 4: Identify Industry Sectors by Land Use The Nexus Analysis identifies the industry sectors that would occupy each of the eight commercial land uses covered in the analysis. 8
79 Step 5: Estimate Income Distribution for Worker Households Based on the industry sectors identified in Step 4, the analysis uses a data set published by the US Census (the Public Use Microdata Sample or PUMS) to construct the likely household income distribution for each land use. Step 6: Estimate New Worker Households by Household Income This step estimates the number of new worker households by income level by applying the worker household income distribution for each land use from Step 5 to the total number of worker households from Step 3. Step 7: Calculate Financing Gap per Affordable Unit This step determines the per unit financing gap that affordable housing developers encounter when securing a permanent loan for their projects. Step 7 of the Nexus Study calculates the net operating income (NOI) generated by units affordable to extremely low-, very low-, low-, and moderate-income households. Using conventional financing assumptions, the analysis determines the supportable permanent loan amount based on the NOI from units at each income level. The cost to house a lower-income household is the difference between the cost to develop an affordable unit and the amount the of the permanent loan that the developer can borrow to finance the unit. Using data on recent affordable housing developments in the City of Los Angeles, the Nexus Analysis determines the average cost to build an affordable rental unit in the City. The supportable permanent loan amounts (by AMI income band) as identified in Step 7 are deducted from the average per-unit development cost to determine the financing gap for units serving households at each income level up to 120 percent of AMI. Step 8: Calculate the Maximum Legal Fee The final step in calculating the impact fee is to apply the financing gap per unit for each income level (from Step 7) to the total housing need by income level (from Step 6). The resulting sum constitutes the maximum legal commercial fee. Step 9 Test Feasibility of Maximum Legal Fee Under Different Market Conditions The City of Los Angeles has a wide range of neighborhoods and corresponding market conditions. In order to ensure that market-rate commercial development is not effected by any fee that may be adopted, this step identifies three general levels of market condition throughout the City, and analyzes the financial return from a development project, in order to identify feasible levels of fee by land use. 10: Formulate Feasible Fee Schedule This step involves a summary fee schedule tested for feasibility, along with policy recommendations for phasing it in, administration, and other options for consideration. 9
80 FIGURE 1: SUMMARY OF COMMERCIAL FEE NEXUS METHODOLOGY 1. Define Land Uses 8 categories based on building permit database analysis 2. Estimate Employment Density By land use Yields total number of workers 3. Estimate Worker Households By land use Yields total number of worker households 4. Identify Industries Expected industries in each land use 5. Estimate Worker Household Income Distribution By land use and its group of industry sectors 6. Estimate Worker Households by AMI Bands Distribution of worker household incomes applied to number of worker households 7. Calculate Financing Gap for Aff Units Needed Gap between cost to build affordable rental unit & HH s ability to pay 8. Calculate Maximum Linkage Fee to Mitigate Aff Housing Need By land use per square foot of building 9. Conduct Feasibility Test Max fee to maintain feasibility Test by Low/Med/High Market Conditions 10. Formulate Fee Schedule By Land Use Type By Market Condition or Geographic Zone 10
81 Commercial Land Uses Step 1: Define Land Uses In order to formulate commercial land use categories that reflect actual development in Los Angeles, the City s building permit data was analyzed for the 2011 to 2015 period (see Appendix B for summary data). The City permitted an average of approximately 5.7 million square feet of commercial space per year, including an average pf 2.8 million square feet per year in employment-generating commercial uses. The balance of 2.9 million square feet was permitted for public and private garage space, which is not generally considered an employment-generating use, and thus excluded from the following analysis. Based on a review of employment by industry sector for Los Angeles County, the categories of commercial fees used by other cities in California (see Case Studies chapter), and permit trends for Los Angeles, commercial employment-generating land uses were classified into eight categories including. Office Retail Hotel/Motel Industrial Warehouse/Utility/Light Industrial Medical &Social Services (including hospitals) Institutional (churches and schools) The graph below shows annual average of new construction, employment-generating space permitted by the categories of land use within the past five years, in order of amount of space. FIGURE 2: AVERAGE ANNUAL PERMITTED NEW SPACE IN EMPLOYMENT-GENERATING USES, ,174 34, , ,453 Commercial Office Retail 368,037 Warehouse/Light Ind Institutional Hotel/Motel 430, ,331 Medical & Soc Services Industrial Source: LA Building Permits; BAE, Excludes ~ 2.9 M sq. ft. of garage & misc. space 11
82 Step 2: Determine Employment Densities For the purposes of the following analysis leading to the maximum fee calculations, the Nexus Study assumes a building totaling 100,000 square feet for each commercial land use. This is not intended to portray a typical building permitted or developed in the City of Los Angeles; it is a method to allow for per square foot comparisons across commercial land uses. For each land use identified in Step 1, the Nexus Study determined the average employment density (i.e., square feet of building area per employee), in order to determine the number of workers per 100,000 square feet of each land use type. BAE reviewed several studies to estimate average employment densities for each land use type, including the City of Los Angeles Affordable Housing Benefit Study (2011), the Southern California Association of Governments Employment Density Study (2001), Environmental Impact Reports for several recent projects in the City of Los Angeles, and the commercial linkage fee nexus studies for each of the commercial linkage fees discussed in the best practices section of this report. These studies demonstrated wide variation in the assumed employment density for each land use type. The employment densities assumed in this study are generally based on either the median value or most common value for each land use type, with some outlier values omitted. In some cases, the employment densities used in this study may be slightly lower than would typically be expected for new construction in order to avoid overstating the number of workers that would be generated by new development, thereby maintaining a more conservative analysis. In particular, many office tenants are demonstrating a preference for more open floor plans with fewer square feet per employee than is typical of more traditional office space, some occupying 150 square feet per employee or less. However, while employment densities in some new office space in Los Angeles will be in line with this trend, other new developments will be configured with a more traditional layout with lower employment densities. The Nexus Study assumes 350 square feet per office employee, as is common in more traditional office space, in order to reflect the higher end of the range of potential configurations among new office developments and avoid overestimating the number of employees per 100,000 square feet of office development. As shown below, the assumed average employment density for each of the eight commercial land uses ranges from 350 square feet per employee for office uses to 1,100 square feet per employee for construction, warehousing, and wholesale trade land uses. 12
83 New Worker Households and Affordable Housing Need Step 3: Estimate Worker Households Since most households in Los Angeles include more than one worker, the Nexus Study groups the employees generated by each land use into households to determine the total number of worker households generated by each land use type. According to the US Census American Community Survey, as of 2014 the City of Los Angeles had 1,849,845 workers living in households and 1,047,928 households with at least one worker, averaging approximately 1.77 workers per household with workers. Therefore, the Nexus Study estimates the number of employee households that each land use generates by dividing the total number of workers by As shown below, the estimated number of households per 100,000 square feet ranges from 51.5 for construction, warehousing, and wholesale trade uses to for office uses. TABLE 2: EMPLOYEES AND HOUSEHOLDS PER 100,000 SQUARE FEET Hotel/ Office Retail Industrial Motel Warehouse Hospital Institutional Average Sq. Ft./employee ,000 1, Total Employees Total Employee Households Assumptions Building Size 100,000 Employees per Household (a) 1.77 Note: (a) Employees per household from 2014 ACS reported average number of workers per household in the City of Los Angeles. Sources: ACS, 2014; BAE, Step 4: Identify Industry Sectors by Land Use Worker occupations, salaries, and associated household incomes tend to vary between industries, and therefore the Nexus Study identifies the industry sectors that would occupy each of the eight commercial land uses as a first step in identifying affordable housing need among worker households. Federal, State, and local governmental agencies typically categorize business establishments based on the North American Industry Classification System (NAICS), which assigns numerical codes to each industry sector. NAICS codes group all industries into 20 major industry categories, each identified with a two-digit code. Within each two-digit NAICS sector, more detailed sub-categories of industries are identified by three-digit NAICS codes, which are themselves comprised of more detailed subcategories of industries, up to the six-digit NAICS code level, with more digits associated with more detailed subcategories. For example, NAICS sector 72, Accommodation and Food Services, is comprised of NAICS code sectors 721 (Accommodation) and 722 (Food Services and Drinking Places). NAICS codes 721 and
84 are comprised of more detailed industries, identified by NAICS codes with four to six digits, depending on the level of specificity of the subcategories. BAE analyzed each two-digit NAICS code and each subcategory to determine the industry sectors most likely to occupy each of the eight commercial land uses. To the extent possible, the Nexus Study places each two-digit NAICS code into one of the eight land uses. However, some two-digit NAICS codes are too broad to fall into one of the eight uses, and were split at the three-digit level to between two land uses. The industry sectors that are expected to occupy each commercial land use type are shown in Table 3. In addition, the analysis excludes several industry sectors that were not grouped into any of the eight land uses, as shown in Table 3. These uses include sectors that are not expected to generate a significant amount of future new development in Los Angeles (i.e., Agriculture, Forestry, Fishing, and Hunting; Mining, Quarrying, and Oil and Gas Extraction; and Utilities), and do not fit within any of the eight land uses. In addition, the analysis excludes the Public Administration industry on the basis that the City will not charge a fee for space that it will occupy. The Other Services industry was excluded because it includes a large range of industries that vary widely in types of employment and likely incomes of workers. However, to the extent that the industries within the Other Services sector may occupy any of the eight analyzed commercial land uses, the employment and income profile of workers in these industries is assumed to be similar to the employment and income profile of workers in other industries within each land use type. 14
85 TABLE 3: INDUSTRIES BY LAND USE TYPE AND TOTAL EMPLOYMENT, LA COUNTY, 2014 NAICS 2014 LA County % of Employees in Number NAICS Industry Name Employment Land Use Type Office 51 Information 200, % 52 Finance and Insurance 132, % 53 Real Estate and Rental and Leasing 75, % 54 Professional, Scientific, and Technical Services 276, % 55 Management of Companies and Enterprises 58, % 561 Administrative and Support Services 255, % Total 999, % Retail Retail Trade (not including industry 454, non-store retailers) 399, % 722 Food Services and Drinking Places 341, % Total 740, % Industrial Manufacturing 361, % 562 Waste Management and Remediation Services 9, % Total 371, % Hotel/Motel 721 Accommodation 44, % Total 44, % Warehouse 23 Construction 120, % 42 Wholesale Trade 220, % Transportation and Warehousing 177, % Total 518, % Hospital 62 Health Care and Social Assistance 657, % Total 657, % Institutional 61 Educational Services 355, % 71 Arts, Entertainment, and Recreation 88, % Total 444, % SUBTOTAL - ALL CLASSIFIED INDUSTRIES 3,775,933 Industries Not Classified 11 Agriculture, Forestry, Fishing and Hunting 5, Mining, Quarrying, and Oil and Gas Extraction 4, Utilities 28, Other Services (except Public Administration) 147, Public Administration 163,290 Total 349,318 TOTAL - ALL INDUSTRIES 4,125,251 Sources: California Employment Development Department, Quarterly Census of Employment and Wages, 2014; BAE,
86 Step 5: Estimate Household Income Distribution of New Worker Households As discussed above, worker households 5 in Los Angeles often have more than one employed person. In some instances, economists estimate household income for workers by simply multiplying worker earnings by industry by the average number of workers per worker household. This methodology relies on the unsatisfactory assumption that on average workers make the same amount of money as other workers in their household. Given the diversity of household composition, this assumption is not appropriate. For example, a household may have a teacher and a doctor, with significantly different individual earnings. To address this issue, this analysis makes use of a detailed and rich data set published by the U.S. Census known as the Public Use Microdata Sample (PUMS). Derived from a five percent sample of all households per the American Community Survey, and available for certain defined areas of 100,000 or more of population, this data allows one to cross tabulate variables such as industry of employment and household income. The analysis here uses the most recent available data, from the 2010 through 2014 five-year period. The PUMS data set was queried to identify the number of households by income category for the groups of industries assumed to be associated with the different non-residential building types (controlling for household size) to construct a household income distribution for each of these industry groupings. The distribution was constructed based on the income categories defined by the California Department of Housing and Community Development (HCD). These HCD income categories are defined by a formula based largely on the percentage of the Area Median Income (AMI), adjusted for household size and income levels relative to housing costs. Table 4 below presents the distribution of households by HCD income level for each of the eight commercial land uses. 5 A worker household is defined as a household with one or more employed persons. They may be wage and salary workers, or self-employed/sole proprietors. 16
87 TABLE 4: DISTRIBUTION OF NEW WORKER HOUSEHOLDS BY INCOME Estimated Household Income as a Percent of AMI (a) 50% to NAICS Code Land Use Up to 30% AMI 30% to 50% AMI 80% AMI 80% - 120% AMI Above 120% AMI Total Private Sector Only 51, 52, 53, 54, 55, 561 Office 10.7% 10.2% 15.0% 5.5% 58.6% 100.0% 44-45, except 454, 722 Retail 18.2% 18.5% 22.1% 6.4% 34.8% 100.0% 31-33, 562 Industrial 12.9% 16.2% 20.6% 6.3% 44.0% 100.0% 721 Hotel/Motel 15.2% 18.3% 22.1% 7.4% 37.0% 100.0% 23, 42, Warehouse 16.6% 16.6% 21.3% 6.4% 39.1% 100.0% 62 Hospital 11.4% 11.6% 17.8% 6.2% 53.1% 100.0% 61, 71 Institutional 13.2% 11.1% 16.3% 6.0% 53.5% 100.0% Notes: (a) Based on a cross tabulation of Public Use Microdata Samples (PUMS) from the American Community Survey. These incomes were compared to household income limits published by the California Department of Housing and Community Development, to determine the percentage of households falling into each income category. The analysis controlled for household size, to address the varying HCD income limits for each household size. Sources: Census, American Community Survey Public-Use Microdata Sample (PUMS) ; CA Dept. of Housing and Community Development, 2014; BAE, Step 6: Estimate New Worker Households by Household Income This analysis estimates the number of new worker households by income level by applying the worker household income distribution for each land use from Step 5 to the total number of worker households from Step 3. As shown in Table 5 below, the number of extremely low-, very low-, low-, and moderate-income households per 100,000 square feet of commercial space ranges from 31.4 households for construction, warehousing, and wholesale trade to 82.0 households for retail space. The number of lower-income households that each land use type generates is a product of both the total number of worker households that 100,000 square feet of each use supports and the income distribution among those workers. As a result, hotel/motel and construction, warehousing, and wholesale trade land uses are among the uses that generate the smallest number of lower-income households, despite having relatively low worker household incomes, due to the low employment densities associated with these uses. Conversely, office uses generate a large number of lower-income households despite relatively high worker household incomes due to the high employment densities in office uses. Retail uses are associated with both relatively low worker household incomes and high employment densities, resulting in the highest number of lower-income worker households per 100,000 square feet out of all eight land uses. 17
88 TABLE 5: WORKER HOUSEHOLDS BY HOUSEHOLD INCOME GENERATED BY COMMERCIAL LAND USES Hotel/ Employee Households by Income Level Office Retail Industrial Motel Warehouse Hospital Institutional Extremely Low Income (up to 30% AMI) Very Low Income (31-50% AMI) Low Income (51-80% AMI) Moderate Income (81-120% AMI) Subtotal - Affordable Housing Need (Units) Above Moderate Income (over 120% AMI) Total Housing Need Assumptions Building Size 100,000 Sources: Census, American Community Survey Public-Use Microdata Sample (PUMS) ; CA Dept. of Housing and Community Development, 2014; BAE, Financing Gap Step 7: Calculate the Financing Gap per Affordable Unit The next step in the nexus analysis is to calculate the cost to house the extremely low-, very low-, low-, and moderate-income households calculated in Step 6 by determining the per unit financing gap that affordable housing developers encounter when securing a permanent loan for their projects. In other words, the cost to house a lower-income household is the difference between the cost to develop an affordable unit and the amount of the permanent loan that the developer can borrow to finance the unit. According to cost data provided between 2013 and 2015 on applications for low-income housing tax credit projects in the City of Los Angeles, the average development cost for affordable housing in the City averages approximately $448,500 per unit, as shown in Table This weighted average cost is based on data from 25 developments serving homeless, special needs, large-family, and senior households in the City of Los Angeles with a total of 1,503 units. All cost data inflated to 2016 dollars using the Turner Building Cost Index. 7 This study uses the average development cost across all affordable housing types despite that most of the new workers living in affordable units will be housed in large family developments, which in practice accommodate a range of household sizes and mostly serve lower-income worker households. Among units in the large family developments analyzed in this study, three percent were studios, 35 percent were one-bedroom units, 28 percent were two-bedroom units, 32 percent were three-bedroom units, and on percent were units with four or more bedrooms. In contrast, homeless, special needs, and senior developments, typically have a large number of occupants living on social security. However, by using the average across all affordable unit types, the Nexus Study is conservative in estimating the financing gap associated with constructing new units because the average development costs for homeless, special needs and senior units tend to be lower than the development costs for large family units. 18
89 TABLE 6: DEVELOPMENT COSTS FOR AFFORDABLE HOUSING UNITS, CITY OF LOS ANGELES, Avg. Development Number of Housing Type Cost (per unit) (a) Units Homeless & Special Needs $410, Large Family $502, Senior $382, Weighted Average - All Housing Types $448,479 1,503 Note: (a) Weighted average cost as reported on tax credit applications between 2013 and All costs adjusted to 2016 costs based on the Turner Building Cost Index. Sources: City of Los Angeles, 2016; BAE, Affordable housing developers are able to secure a permanent loan based on their net operating income (NOI) per unit. NOI is equal to rental income less operating expenses and vacancy. As shown in Table 7, households can afford monthly rents ranging from $544 for extremely low-income households to $1,708 for moderate-income households. These rents are based on household income limits for three-person households and assuming households spend 30 percent of their income on rent and utilities. 8 Standard deductions are taken for operating expenses and vacancies to determine NOI. BAE used conventional financing assumptions to determine the supportable loan amount per unit for each income level. As shown in Table 7, the loan amount ranges from $0 per unit for extremely low-income units (i.e., operating expenses exceed NOI, leaving no NOI to support debt payments) to $152,301 for units serving moderate-income households. The financing gap per affordable unit is equal to the total development cost less the supportable loan amount per unit. Based on the supportable loan amount calculated above, the financing gap per affordable unit ranges from $448,500 for extremely low-income units to $296,199 for moderate-income units, as shown in Table 7. It should be noted that no other affordable housing subsidy was assumed in this analysis, because this calculation is intended to serve as the actual impact of the new employmentgenerating commercial land uses; it is not necessarily the way funds generated by a commercial fee would be spent on new affordable housing. Instead, in may affordable housing projects, multiple funding sources would be utilized in combination, enabling limited public resources from federal, state, and local sources to be combined most effectively. For some affordable housing projects serving low income households, non-cash subsidies such as Low Income Housing Tax Credits (LIHTCs) would also be used. 8 The analysis assumes a three-person household for consistency with the 2016 Los Angeles County average household size of 2.88 persons per household, per California Department of Finance estimates. 19
90 TABLE 7: FINANCING GAP ANALYSIS, CITY OF LOS ANGELES, 2016 Income Group Extremely Low Very Low Low Moderate Household Income Limit (a) $23,450 $39,100 $62,550 $70,000 Maximum Affordable Monthly Rent per Unit (b) $544 $936 $1,522 $1,708 Monthly Operating Expenses (c) $542 $542 $542 $542 Vacancy (d) 5% 5% 5% 5% Net Operating Income per Unit (e) -$25 $347 $904 $1,081 Operating Subsidy from Other Sources (f) $25 $0 $0 $0 Monthly Supportable Debt Service per Unit (g) $0 $278 $723 $865 Loan Amount (h) $0 $48,900 $127,371 $152,301 Financing Gap per Affordable Unit (i) $448,500 $399,600 $321,129 $296,199 Assumptions Total Affordable Unit Development Costs (j) $448,500 Financing Terms Debt Coverage Ratio 1.25 Interest Rate 5.50% Term of Loan (years) 30 Notes: (a) Based on a 3-person household, CA Department of Housing & Community Development, (b) 30% of income to rent and utilities. (c) Data from funding applications for recent affordable housing projects in California. (d) Standard required assumption for financing applications. (e) Affordable Monthly Rent less Operating Expenses & Vacancy. (f) Operating subsidy is necessary for units with negative NOI. (g) Net Operating Income plus Operating Subsidy, divided by Debt Coverage Ratio. (h) Based on financing terms assumptions. (i) Total Development Costs less Loan Amount. (j) Average development costs among units in tax credit projects developed in the City of Los Angeles between 2013 and All figures adjusted to 2016 values based on the Turner Construction Cost Index. Sources: California HCD, 2016; City of Los Angeles, 2016; Turner Construction Cost Index, ; BAE,
91 Maximum Legal Fee Step 8: Calculate the Maximum Legal Fee The final step in calculating the impact fee is to apply the financing gap per affordable unit for each income level (from Step 7) to the total housing need by income level (from Step 6) per commercial land use. This is expressed as the maximum legal fee because it is directly derived from the nexus analysis described above (i.e., new commercial development generating new jobs combined into new worker households distributed by income band, and the cost to provide new affordable rental housing units to these same households). As shown in greater detail on the next page, the maximum legal fees are as follows: Office: $ per square foot Retail: $ per square foot Industrial: $ per square foot Hotel/Motel: $ per square foot Warehouse: $ per square foot Med & Social Services: $ per square foot Institutional: $ per square foot It is important to note that due to the high cost of providing affordable housing, these maximum fee levels are not feasible to charge to development projects. Thus, the lower feasible fee by land use tested under a range of current market conditions, is analyzed in the following chapter. 21
92 TABLE 8: MAXIMUM COMMERCIAL FEES, LOS ANGELES Hotel/ Affordable Housing Need Office Retail Industrial Motel Warehouse Hospital Institutional Extremely Low Income (up to 30% AM Very Low Income (31-50% AMI) Low Income (51-80% AMI) Moderate Income (81-120% AMI) Total Affordable Housing Need Financing Gap (a) Extremely Low Income Units $7,747,508 $10,269,897 $3,646,292 $3,867,376 $3,824,996 $5,781,706 $6,699,669 Very Low Income Units $6,613,935 $9,295,516 $4,079,489 $4,147,164 $3,418,720 $5,267,000 $5,024,260 Low Income Units $7,785,398 $8,923,624 $4,166,664 $4,012,822 $3,524,464 $6,462,566 $5,914,130 Moderate Income Units $2,637,145 $2,392,525 $1,167,458 $1,240,985 $983,651 $2,067,181 $2,017,919 Total Financing Gap $24,783,986 $30,881,562 $13,059,903 $13,268,346 $11,751,832 $19,578,452 $19,655,978 Maximum Impact Fee per Sq. Ft. $ $ $ $ $ $ $ Assumptions Building Size 100,000 Financing Gap Extremely Low Income Units $448,500 Very Low Income Units $399,600 Low Income Units $321,129 Moderate Income Units $296,199 Note: (a) The financing gap is calculated by multiplying the number of employee housesholds at each income level by the financing gap per unit (from Step 7) at each affordability level. Source: BAE, As noted earlier, this set of findings will shift slightly with the implementation of the City s minimum wage regulations, to be completed in The Additional Considerations chapter at the end of this report discusses the effects of the minimum wage increases on the above findings. 22
93 Feasibility of Maximum Legal Fee As shown in the preceding section, meeting the affordable housing costs generated by each land use category of commercial use per the nexus analysis results in expensive maximum legal fee levels. In order to evaluate these maximum legal fees in the context of maintaining feasible market rate commercial projects, this report involved extensive analysis of the Los Angeles real estate marketplace by three levels of current market condition, and then financial feasibility testing of each of the eight land use categories by each of the market conditions economic factors. As an overview, the analytical process included the following steps (each step is explained more fully in the following pages): Step A: Identification of Los Angeles neighborhoods Step B: Analysis of market rents to categorize each neighborhood by market condition Step C: Formulation of basic static pro formas for each land use type to analyze the maximum feasible fee by land use and by the three market conditions Step D: Comparison of feasible fees to legal maximum fee Step A: Identification of Los Angeles Neighborhoods For this step, several geographic subarea classifications were considered, including Community Plan Areas (37 areas), City Council Districts (15 areas), and neighborhoods defined by the Los Angeles Times (114 neighborhoods). The Los Angeles Times neighborhoods were considered the most refined, enabling fine-grained differentiation by neighborhood, without being too small to obscure larger market trends. These neighborhoods along with their Step B market categorization are shown in Figure 3. Step B: Classification of LA Neighborhoods by Market Condition This step involved compiling data for commercial market rents based on 439 office projects rents and 711 retail projects rents reported by CoStar, a private data vendor (other commercial land uses showed fewer records in CoStar and were thus considered not reliable for purposes of this analysis). Both office and retail rents were analyzed based on the standard deviation from mean (average) rent, and combined into a composite index by neighborhood. The map on the next page displays the results of this analysis. To illustrate how the development community has responded to market conditions, the maps on the next pages show permit activity of the past five years for office and retail projects throughout the city. 23

94 FIGURE 3: COMMERCIAL MARKET CONDITION BY NEIGHBORHOOD 24


95 FIGURE 4: OFFICE AND RETAIL PERMIT ACTIVITY BY MARKET CONDITION, Office Permits Retail Permits / 25
96 Step C: Pro Forma Analysis to Determine Maximum Feasible Fee by Land Use for Each Market Condition This step involved the formulation of basis static pro forma models for each land use, with rent assumptions varied by market condition. For all assumptions, a conservative approach was taken to ensure that feasible findings would be developed. A summary of the research informing each key assumption is described below. Development Prototype For each land use, a median sized project was identified from actual projects permitted by the City of Los Angeles, as described previously in this report. The project s actual number of stories and parking method were researched, and the project s floor area ratio (FAR) and parking ratios were estimated based on review of applicable zoning codes, resulting in a development program for each prototype. Land Costs For each land use and market condition, BAE reviewed available appraisals conducted for various city agencies (see Appendix C-8 for summary of land sales by market category), and also interviewed leading developers of commercial and residential projects currently active in Los Angeles. Construction Costs (Hard, Soft, and Financing) For each prototype, per square foot hard costs was estimated based on review of R.S. Means, a cost manual. Soft costs and financing costs were estimated based on industry standards and current interest rates. Rent Rent assumptions were developed based on an analysis of project rents from CoStar for just newer buildings (e.g., built in past 10 years or less), and further refined to estimated the 25 th, 50 th, and 75 th percent quartile breakpoints in order to generate conservative rent assumptions. This approach means that, for example, the high market areas rents do not represent very top end, but rather the 75 th percent of top end rents. Cap Rates For each prototype, both national and regional cap rates were compiled, with variations by market area based on developer interviews. 9 Two metrics were used to evaluate feasibility for this analysis: Return on Cost (ROC) for all properties, and also Yield on Cost (YOC) on income-generating (e.g., rental) property. Both metrics were used and projects needed to meet both thresholds, to ensure that these two commonly used measures could be met across land uses and markets. The following describes each feasibility metric in more detail: Return on Total Development Cost (ROC) This metric divides total profit by total development cost, to judge overall project feasibility. It can be considered as a simple profit margin, irrespective of how a project is financed between debt and equity. In 9 BAE consulted with a variety of developers active in the Los Angeles market to benchmark pro forma variables including development, financing, and operational costs, development types and thresholds for feasibility. Developers who participated in interviews and workshops included Greenland USA, CIM Group, Mack Urban, and Related California. 26
97 other words, ROC is useful because it allows comparison across all real estate project types (whether income-producing or for-sale units), irrespective of individual choices to leverage equity through use of debt. It is also useful because, as a simple calculation, it can be easily compared to other non-leveraged non-real estate short-term investments such as one-year corporate bonds (which are generally paying 6 to 10 percent at present). Real estate development has higher risk inherent to the investment activity, so the ROC on real estate projects should be higher than these other investment options. To test feasibility for this study, this metric had to achieve at least a 15 percent return on cost, with cost including the new affordable housing fee and the applicable school fee. This conservative threshold was selected based on developer interviews that indicated a 10 to 12+ % ROC would be desired, depending on their individual circumstances. In addition, several participants in the workshop process provided example project pro formas which indicated feasible thresholds below this same 15% ROC. Therefore, the highest end of the range, 15% ROC, was selected to be the most conservative, allowing for a range of debt/equity combinations, while also encompassing the alternative investments comparisons cited above. Yield on Cost (YOC) This metric, which only applies to income properties (i.e., commercial rental or residential rental properties), evaluates the annual stabilized Net Operating Income (NOI) compared to total development cost. It is useful to evaluate income-producing projects. For the feasibility testing, per the request of several workshop participants who judged their investment decisions based on this metric, this metric was added to the analysis to further ensure feasibility. The actual YOC thresholds used in this report vary by land use, and were selected based on developer interviews. These are noted in the in the following summary pages. Both ROC and YOC thresholds had to be achieved to deem a project feasible with the total fees (e.g., new housing fee + school fee). A summary of the pro forma findings is shown on the following page. Detailed pro formas are shown in Appendix C. It should be noted that new development projects in Low Market Areas, while occurring on the ground in selected locations, do not generally show feasible returns sufficient to support a fee when estimated very conservatively per the approach followed for this report (see Appendix C for these pro formas). Since many of these neighborhoods seek to encourage new development and investment, but additional fees may not pencil under today s market conditions, a market-based fee should be carefully considered in these areas. Some cities have created exemptions for these types of projects, or created Incentive Areas with lower or no fees charged, as a means to incentivize new development at slightly lower costs (assuming fees are charged in other Medium and High market areas). 27
98 TABLE 9: SUMMARY OF COMMERCIAL FEE PRO FORMAS Low Market scenarios not shown here due to lack of general feasibility under conservative assumptions. Detailed pro formas including Low Market are shown in Appendix. 28
99 Two land use categories were treated differently than the above methodology. For the Medical & Social Services category (including hospitals), land uses will include both for-profit developments intended to generate financial returns such as medical office buildings, and non-profit developments intended to house social services, health clinics, of hospitals. For each of these sub-categories, the real estate economics situation often deviates varies from the standard income-generating investment property financial returns: non-profit facilities such as hospitals are often built by and for the occupant s use. Medical office buildings, while they may be developed as income-generating property, are also often built as part of hospital campuses or health clinics, and may have high construction costs. At the other end of the spectrum, social service agencies are often owned by a governmental entity (and would be exempt). For these reasons, this category was analyzed on a Percent of Cost basis to develop the fee, as detailed in Appendix C. Institutional land uses, defined here as primarily schools and churches, are also often exempt from affordable housing fees. Thus, this category is not assigned a feasible fee rate, and would likely not generate any fee revenue, despite the housing market impacts identified through the legal fee (nexus) analysis. 29
100 Step D: Comparison of Feasible Fee to Maximum Legal Fee The table below compares the feasible fees estimated above, to the maximum legal fees described in the previous chapter (based on nexus analysis of new worker households). As in most other cities in California, the gap between the dollars needed to fund affordable housing for new workers (e.g., maximum legal fee) and the feasible level of fee that can be absorbed by real estate market conditions, is substantial. In other words, charging a fee that would not constrain private sector development does not usually meet all subsidy needed to mitigate the costs of the affordable housing impacts generated by the new development. FIGURE 5: COMPARISON OF MAXIMUM LEGAL COMMERCIAL FEES TO FEASIBLE FEES $ $ $ $ $ $50.00 $- $ $14.50 $33.00 $ $7.00 $28.00 $ $5.00 $25.00 $ $14.00 $19.50 $ $5.00 $25.00 Office Retail Hotel Indl Warehouse $ $35.00 $35.00 Medl & Soc Srvcs (a) Institutional (exempt) Legal Fee $ $ $ $ $ $ $ Feasible - Med $14.50 $7.00 $5.00 $14.00 $5.00 $35.00 Feasible - High $33.00 $28.00 $25.00 $19.50 $25.00 $35.00 Legal Fee Feasible - Med Feasible - High a) Medical & Social Services includes hospitals. Fee formulated based on % of total cost, rather than on for-profit financial returns, due to this category representing primarily non-income properties. See Appendix C for % of Cost detail to formulate the example shown for hospitals. $
101 Commercial Fee Program Options & Estimated Revenues The preceding analysis underscores the complexity of formulating a fee schedule for commercial projects that balances the need for affordable housing funds with market conditions. The City could choose to structure this type of fee in several different ways to accommodate other policy options and limit effects on overall commercial development. The following presents four fee program options as examples. These options are then analyzed in order to estimate total annual fee revenues, along with two kinds of potential further adjustments to exempt certain projects. Option A: Match Fee to Market Conditions This option would create a fee schedule which charges feasible fees based on conservativelyestimated Medium Market Area conditions to new and rehabilitated projects in those areas, and feasible fees estimated for High Market Area conditions to those areas. Project fees in Low Market Areas would likely be waived since these fees would generally not be feasible. This option would create the most finely-tuned fee structure, but may create challenges to administer and would necessitate periodic updating to identify changing neighborhood market conditions and feasible fee levels. Option B: Charge Medium Market Fees to Both Medium and High Market Areas This would be a conservative option, charging the level of feasible fee derived from a Medium market area feasibility test, to all projects located in both Medium and High Market Areas. This approach would limit debate about whether an individual project is in a medium or high market area, charging the same fee per land use to all projects regardless of location. Again, due to the economics of Low Market areas, fees would likely not be charged in these exempt zones. This option would simplify fee administration, but may create an uneven burden on projects due to their location and subsequent economics. Option C: Charge Only High Market Areas This option would limit fees to only those projects located in premium, High Market Areas, where feasibility is most assured and development is least likely to be affected. Fees charged would be at the corresponding High Market levels. Projects in Medium and Low Market Areas would be waived based on their location. As market conditions change and are re-evaluated, neighborhoods may change from medium to high market conditions and become eligible for the fee schedule. This option would further simplify fee program administration, but may create debate over specific projects which have High Market characteristics and economics but be technically located in a Medium Market neighborhood (or vice-versa). 31
102 Option D: Charge Lowest Feasible Commercial Fee Citywide (Flat Fee) In this option, the lowest feasible fee for the lowest commercial land use in a Medium Market Area would be charged across all commercial uses in all markets. This is a more straightforward approach than any of the options cited above. For example, the feasibility testing for commercial land uses found that warehouse and hotel projects in Medium Market Areas can support an approximately $5.00 fee; as such, this would become the flat fee charged to all land use categories for commercial projects anywhere in the city (including in Low Market Areas). The benefits of this option are that it establishes clarity, minimizes confusion and minimizes administrative functions. For example, a developer would not need to worry about how a flexible space for creative industry occupancy would be classified and charged. Also, this approach would remove debates about which market area a project falls into. While this option would apply the fee to all projects, including those located in market conditions that the pro formas concluded may be infeasible, most new development projects occurring in the Low market conditions likely reflect improving submarket conditions not reflected in the broader three market segments used for the analysis in this report. The estimated annual revenues that could potentially be generated by the application of these fee program options are shown on the next page. Adjustment for Project Size Many cities exempt fees for smaller projects in order to encourage infill and accommodate small businesses. For this study, the distribution of new commercial projects by square foot size was analyzed (see data in Appendix B-3). This distribution suggests that projects less than 10,000 square feet in gross size is a logical threshold to waive the fee; approximately 40 percent of retail projects and 29 percent of office projects fall below this size, but on a square foot basis, most square footage built for office and retail occur in projects above this threshold. 32
103 TABLE 10: FEE SCHEDULE OPTIONS & ESTIMATED ANNUAL REVENUE Estimates do not include possible exemptions and waivers under consideration other than minimum project size. Low Market Use Low Feasible Fee per Sq. Ft. Annual Avg. Sq. Ft. (a)(b) Med Feasible Fee per Sq. Ft. Annual Avg. Sq. Ft. (a)(b) High Feasible Fee per Sq. Ft. Annual Avg. Sq. Ft. (a)(b) Annual Avg. Sq. Ft. Potential Max Annual Revenue Potential Max Annual Rev Adjusted for Minimum Project Size (c) Office $ - 121,143 $ ,169 $ , ,453 $ 19,853,099 $ 18,955,132 Retail $ - 114,363 $ ,224 $ , ,331 $ 7,302,417 $ 6,306,653 Industrial $ - 2,911 $ ,049 $ ,960 $ 448,683 $ 371,205 Hotel $ - 0 $ ,953 $ , ,174 $ 2,805,294 $ 2,790,928 Warehouse $ - 80,002 $ ,961 $ , ,582 $ 2,065,290 $ 1,938,052 Medical (Hospital) $ ,644 $ ,644 $ ,644 55,932 $ 1,957,620 $ 1,957,620 Total 337,063 1,263, ,370 2,352,432 $ 34,432,403 $ 32,319,591 Option B - Medium Market Fees Applied to Both Med & High Zones Low Market Medium Market High Market Total Total Low Feasible Med Feasible Med Feasible Potential Max Potential Max Annual Rev Adjusted for Use Fee per Sq. Ft. Annual Avg. Sq. Ft. (a)(b) Fee per Sq. Ft. Annual Avg. Sq. Ft. (a)(b) Fee per Sq. Ft. Annual Avg. Sq. Ft. (a)(b) Annual Avg. Sq. Ft. Annual Revenue Minimum Project Size (c) Office $ - 121,143 $ ,169 $ , ,453 $ 10,951,995 $ 10,456,630 Retail $ - 114,363 $ ,224 $ , ,331 $ 3,443,781 $ 2,974,184 Industrial $ - 2,911 $ ,049 $ ,960 $ 448,683 $ 371,205 Hotel $ - 0 $ ,953 $ , ,174 $ 1,740,870 $ 1,731,955 Warehouse $ - 80,002 $ ,961 $ , ,582 $ 1,752,901 $ 1,644,909 Medical (Hospital) $ - 18,644 $ ,644 $ ,644 55,932 $ 1,305,080 $ 1,305,080 Total 337,063 1,263, ,370 2,352,432 $ 19,643,310 $ 18,483,963 Low Market Use Low Feasible Fee per Sq. Ft. Annual Avg. Sq. Ft. (a)(b) Med Feasible Fee per Sq. Ft. Annual Avg. Sq. Ft. (a)(b) High Feasible Fee per Sq. Ft. Annual Avg. Sq. Ft. (a)(b) Annual Avg. Sq. Ft. Potential Max Annual Revenue Potential Max Annual Rev Adjusted for Minimum Project Size (c) Office $ - 121,143 $ - 274,169 $ , ,453 $ 15,877,646 $ 15,159,491 Retail $ - 114,363 $ - 308,224 $ , ,331 $ 5,144,849 $ 4,443,293 Industrial $ - 2,911 $ - 32,049 $ ,960 $ - $ - Hotel $ - 0 $ - 294,953 $ , ,174 $ 1,330,530 $ 1,323,716 Warehouse $ - 80,002 $ - 334,961 $ , ,582 $ 390,485 $ 366,428 Medical (Hospital) $ - 18,644 $ - 18,644 $ ,644 55,932 $ 652,540 $ 652,540 Total 337,063 1,263, ,370 2,352,432 $ 23,396,050 $ 21,945,468 Use Low Feasible Fee per Sq. Ft. Annual Avg. Sq. Ft. (a)(b) Med Feasible Fee per Sq. Ft. Annual Avg. Sq. Ft. (a)(b) High Feasible Fee per Sq. Ft. Annual Avg. Sq. Ft. (a)(b) Annual Avg. Sq. Ft. Potential Max Annual Revenue Potential Max Annual Rev Adjusted for Minimum Project Size (c) Office $ ,143 $ ,169 $ , ,453 $ 4,382,264 $ 4,184,052 Retail $ ,363 $ ,224 $ , ,331 $ 3,031,657 $ 2,618,258 Industrial $ ,911 $ ,049 $ ,960 $ 174,799 $ 144,615 Hotel $ $ ,953 $ , ,174 $ 1,740,870 $ 1,731,955 Warehouse $ ,002 $ ,961 $ , ,582 $ 2,152,912 $ 2,020,276 Medical (Hospital) $ ,644 $ ,644 $ ,644 55,932 $ 279,660 $ 279,660 Total 337,063 1,263, ,370 2,352,432 $ 11,762,162 $ 10,978,815 Footnotes on next page Option A - Match Fee to Market Conditions Medium Market High Market Option C - Fee in High Market Zones Only Medium Market High Market Option D - Lowest Commercial Feasible Fee Charged Citywide Low Market Medium Market High Market Total Total Total Total Total Total 33
104 Notes: a) Sq. Ft. of each land use based on avg. annual permit data, as follows: Office 876,453 Retail 606,331 Industrial 34,960 Hotel/Motel 348,174 Warehouse 430,582 Hospital 55,932 Total 2,352,432 b) Allocation of Sq. Ft. per Market Area category- based on geocoding of all permits: % Sq.Ft. in Low Markets % Sq.Ft. in Med Markets % Sq.Ft. in High Markets Office 13.8% 31.3% 54.9% Retail 18.9% 50.8% 30.3% Industrial 8.3% 91.7% 0.0% Hotel/Motel 0.0% 84.7% 15.3% Warehouse 18.6% 77.8% 3.6% Hospital* 33.3% 33.3% 33.3% *The hospital square footage was allocated equally among low, medium, and high markets because only one new hospital was built between 2011 and c) Adjusted for proposed minimum project size (10,000+ Sq. Ft.) Below Min Project Size Above Min Project Size Office 4.5% 95.5% Retail 13.6% 86.4% Industrial 17.3% 82.7% Hotel/Motel 0.5% 99.5% Warehouse 6.2% 93.8% Hospital 0.0% 100.0% 34
 fees.")

105 In addition to adjustments for potential exempted small projects, the City of Los Angeles could also create a partial fee waiver in its new fee program for those projects located in the two Specific Plan areas which currently charge Transportation Impact Assessment (TIA) fees. These two areas West Los Angeles Specific Plan and the Coastal Transportation Corridor Specific Plan (CTCSP) currently each have similar fee schedules to fund local transportation improvements, varied by land use and in some cases, size of project. As of August 2016, both of these TIA fee programs have also been proposed for fee increases and refined fee schedules. If the City were to adopt a commercial affordable housing fee, and also accommodate overall project feasibility in these TIA areas, partial fee waivers or adjustments could be considered for relevant projects in these areas. A map of the TIA overlay on commercial market areas is shown below, and the adjustment to the potential fee revenue estimate for each option net of the proposed applicable TIA fee is shown on the next page. It should be noted that a fee revenue estimate for each option which combines waivers for both small projects and partial TIA waivers has not been conducted for this study. FIGURE 6: COMMERCIAL MARKET AREAS & TIAS 35
106 TABLE 11: ESTIMATED ANNUAL COMMERCIAL FEE REVENUE WITH TIA ADJUSTMENTS Estimates do not include possible exemptions and waivers under consideration. Option A - Citywide Fee with Market Area Zones Low Market Medium Market High Market Total Low Feasible Fee Annual Avg. Sq. Med Feasible Fee Annual Avg. Sq. High Feasible Fee Annual Avg. Annual Avg. Potential Max Use per Sq. Ft. Ft. (a)(b) per Sq. Ft. Ft. (a)(b) per Sq. Ft. Sq. Ft. (a)(b) Sq. Ft. Annual Revenue Office outside TIAs $ - 121,143 $ ,169 $ , ,206 $ 17,864,950 Office in TIAs $ - 0 $ - 0 $ - 60,247 60,247 $ - Retail outside TIAs $ - 114,363 $ ,523 $ , ,198 $ 7,089,421 Retail in TIAs $ - 0 $ $ ,432 8,133 $ 66,937 Industrial outside TIAs $ - 2,911 $ ,049 $ ,960 $ 448,683 Industrial in TIAs $ - 0 $ $ $ - Hotel outside TIAs $ - 0 $ ,953 $ , ,174 $ 2,805,294 Hotel in TIAs $ - 0 $ - 0 $ $ - Warehouse outside TIAs $ - 80,002 $ ,076 $ , ,325 $ 1,841,560 Warehouse in TIAs $ - 0 $ ,885 $ ,257 $ 22,844 Hospital outside TIAs $ ,644 $ ,644 $ ,644 55,932 $ 1,957,620 Hospital in TIAs 0 $ $ $ - Total 337,063 1,263, ,370 2,352,432 $ 32,097,310 Option B - Low Market Incentive Zone + Med Fee Applied to Both Med & High Zones Low Market Medium Market High Market Total Low Feasible Fee Annual Avg. Sq. Med Feasible Fee Annual Avg. Sq. Med Feasible Fee Annual Avg. Annual Avg. Potential Max Use per Sq. Ft. Ft. (a)(b) per Sq. Ft. Ft. (a)(b) per Sq. Ft. Sq. Ft. (a)(b) Sq. Ft. Annual Revenue Office outside TIAs $ - 121,143 $ ,169 $ , ,206 $ 10,078,414 Office in TIAs $ - 0 $ - 0 $ - 60,247 60,247 $ - Retail outside TIAs $ - 114,363 $ ,523 $ , ,198 $ 3,386,849 Retail in TIAs $ - 0 $ $ - 7,432 8,133 $ - Industrial outside TIAs $ - 2,911 $ ,049 $ ,960 $ 448,683 Industrial in TIAs $ - 0 $ $ $ - Hotel outside TIAs $ - 0 $ ,953 $ , ,174 $ 1,740,870 Hotel in TIAs $ - 0 $ - 0 $ $ - Warehouse outside TIAs $ - 80,002 $ ,076 $ , ,325 $ 1,536,617 Warehouse in TIAs $ - 0 $ ,885 $ ,257 $ 15,399 Hospital outside TIAs $ - 18,644 $ ,644 $ ,644 55,932 $ 1,305,080 Hospital in TIAs $ - 0 $ $ $ - Total 337,063 1,263, ,370 2,352,432 $ 18,511,913 Option C - High Market Zone Only Low Market Medium Market High Market Total Low Feasible Fee Annual Avg. Sq. Med Feasible Fee Annual Avg. Sq. High Feasible Fee Annual Avg. Annual Avg. Potential Max Use per Sq. Ft. Ft. (a)(b) per Sq. Ft. Ft. (a)(b) per Sq. Ft. Sq. Ft. (a)(b) Sq. Ft. Annual Revenue Office outside TIAs $ - 121,143 $ - 274,169 $ , ,206 $ 13,889,497 Office in TIAs $ - 0 $ - 0 $ - 60,247 60,247 $ - Retail outside TIAs $ - 114,363 $ - 307,523 $ , ,198 $ 4,936,762 Retail in TIAs $ - 0 $ $ ,432 8,133 $ 66,937 Industrial outside TIAs $ - 2,911 $ - 32,049 $ ,960 $ - Industrial in TIAs $ - 0 $ - 0 $ $ - Hotel outside TIAs $ - 0 $ - 294,953 $ , ,174 $ 1,330,530 Hotel in TIAs $ - 0 $ - 0 $ $ - Warehouse outside TIAs $ - 80,002 $ - 292,076 $ , ,325 $ 381,179 Warehouse in TIAs $ - 0 $ - 42,885 $ ,257 $ 7,577 Hospital outside TIAs $ - 18,644 $ - 18,644 $ ,644 55,932 $ 652,540 Hospital in TIAs $ - 0 $ - 0 $ $ - Total 337,063 1,263, ,370 2,352,432 $ 21,265,023 Option D would be same as without TIA adjustment due to low flat fee structure These estimates are not adjusted for project size threshold. Footnotes on following page. 36
107 Notes: a) Sq. Ft. of each land use based on avg. annual permit data, as follows: Office 876,453 Retail 606,331 Industrial 34,960 Hotel/Motel 348,174 Warehouse 430,582 Hospital 55,932 Total 2,352,432 b) Allocation of Sq. Ft. per Market Area category- based on geocoding of all permits: % Sq.Ft. in Low Markets % Sq.Ft. in Med Markets % Sq.Ft. in High Markets Office 13.8% 31.3% 54.9% Retail 18.9% 50.8% 30.3% Industrial 8.3% 91.7% 0.0% Hotel/Motel 0.0% 84.7% 15.3% Warehouse 18.6% 77.8% 3.6% Hospital* 33.3% 33.3% 33.3% *The hospital square footage was allocated equally among low, medium, and high markets because only one new hospital was built between 2011 and c) Adjusted for proposed minimum project size (10,000+ Sq. Ft.) Below Min Project Size Above Min Project Size Office 4.5% 95.5% Retail 13.6% 86.4% Industrial 17.3% 82.7% Hotel/Motel 0.5% 99.5% Warehouse 6.2% 93.8% Hospital 0.0% 100.0% d) Figures overestimate revenue if TIA fees are accounted for in two specific plan aras where TIA fees are charged. The highlighted figures represent the maximum fee for each prototype, which are used in the above calculation. The proposed TIA fees are: Proposed TIA Fees Max Supportabe Fee - Medium Max Supportabe Fee - High West LA CTCSP West LA CTCSP West LA CTCSP Office $ $ $ - $ - $ - $ 1.48 Retail $ $ $ - $ - $ 9.01 $ Industrial $ $ $ 1.66 $ 3.03 $ 7.16 $ 8.53 Hotel $ 8.17 $ 7.27 $ - $ - $ $ Warehouse $ 4.64 $ 4.13 $ 0.36 $ 0.87 $ $ Medical (Hospital) $ $ $ $ $ $ Allocation of Sq. Ft. per Market Area category within TIAs % Units in Low % of Units in Med % of Units in High Total Activity in TIAs Office 0.0% 0.0% 12.5% 12.5% Retail 0.0% 0.2% 4.0% 4.3% Industrial 0.0% 0.0% 0.0% 0.0% Hotel 0.0% 0.0% 0.0% 0.0% Warehouse 0.0% 12.8% 2.4% 15.2% Medical (Hospital) 0.0% 0.0% 0.0% 0.0% 37
108 In summary, the estimated range of potential fee revenue for an average development year (based on the past five years of permit data), would be as follows. FIGURE 7: ESTIMATE OF POTENTIAL ANNUAL COMMERCIAL FEE REVENUE Potential Max Rev Before Adjustments $34,432,403 $32,319,591 $32,097,310 Max Annual Revenue Ajdusted for Min Project Size (10K+) Max Annual Revenue Adjusted for TIA Fees $19,643,310 $18,483,963 $18,511,913 $23,396,050 $21,945,468 $21,265,023 $11,762,162 $10,978,815 0 OPTION A: MATCH FEE TO MARKET CONDITIONS OPTION B: MEDIUM FEE APPLIED TO BOTH MED & HIGH ZONES OPTION C: FEE IN HIGH MARKET ZONES ONLY OPTION D: LOWEST FEASIBLE FEE CITYWIDE (FLAT FEE) It should be noted that these are estimates, and actual fee collections will vary depending on the specific regulations in the to-be-determined adopted ordinance. Furthermore, these estimates rely on data for the past five years of permitted development activity ( ), which reflects a time period at the end of the Great Recession plus the surge after economic recovery. Actual economic cycles in any given year may strongly influence the revenue stream. Considerations for Implementation Fees by Geographic Area As described above, the City of Los Angeles could adopt a commercial fee schedule which varies the required fee by geographic area, as related to market condition. Further variations of this approach, which would match the feasible fee to the geographic area, are then possible to structure. The advantage of this framework is that fees can be calibrated to achieve meaningful revenues to produce affordable housing, while still balancing the diversity of Los Angeles development conditions to achieve ongoing feasibility. However, this framework, whether accomplished through Option A, B, or C, would require ongoing or periodic analysis to recalibrate market areas. Furthermore, the 114 LA Times neighborhoods used for this study, while representing a good way to determine subareas, could be further improved in terms of both the accuracy of the geo-spatial files, and possibly the actual division of geographies. For 38
109 example, a more fine-grained approach than taken in this study, could utilize Census Tracts to determine market condition by location. Phase-In of Fee Schedule A key component of adopting a commercial fee in Los Angeles will be the phase-in schedule. Most notably, most cities when first adopting a fee like this, set a future date for its implementation, and also define and waive current pipeline projects which would have been started without knowledge of this fee. Moreover, because Los Angeles has relatively few other impact fees for most areas, with the exception of the TIAs in 2 specific plan areas, and the proposed park fees, adoption of a new commercial fee may have the undesirable short-term perceived effect of a shock to the economic system for some projects with smaller profit margins. For these reasons, it is recommended that if Los Angeles adopts a commercial fee program, it should consider a phased-in schedule when initially implemented. Some cities have phased fees like this in over a two-year period; for Los Angels, it is recommended that this two-year period be considered. The fee schedule, for example, could be set at half of the full fee for the first year of applicability, rising to the full 100 percent of the fee on projects seeking building permits 12 months later and beyond. Fee Exemptions and Waivers As profiled in the case studies of commercial fees, other cities in California have variable approaches to making categories of land use either exempt from commercial fees, or waiving fees under certain conditions. Fee Exemptions This study was conducted assuming that certain categories of land use would be exempted from commercial fees, due to the nature of these land uses (e.g., built and owned primarily by non-profit or public-purpose organizations). These include all institutional uses (churches, public schools, private schools, and public and private higher educational institutions), as well as child care facilities, and public agency owned buildings (including city, state and federal as required by the California Constitution). Most cities also exempt 100 percent affordable housing projects. Some cities also exempt buildings smaller than a certain size threshold as discussed earlier in this study, and a few cities earmark other exemptions to achieve policy goals such as the example of San Francisco exempting neighborhood grocery stores and pharmacies. Fee Waivers Some cities profiled in the case studies also waive commercial fees in exchange for other mechanisms to provide for affordable housing impacts, including building the affordable housing (although few cities report that this option is used), and/or allow land donation at an equivalent value. Because most of Los Angeles is relatively built-out and land constrained, 39
110 especially in the stronger market areas, the option to dedicate land instead of pay a fee, should be further explored. The revenue estimates for the commercial fee included an example adjustment that can also be built into the regulations for Transportation Impact Assessment (TIA) areas, which are currently applicable only to the Specific Plans for West Los Angeles and the Coastal Transportation Corridor. In the event other areas of Los Angeles were to adopt area transportation impact fees, the commercial linkage fee could be partially waived (reduced) to accommodate those other fees. Finally, most cities allow for a waiver request if a) economic hardship can be demonstrated or b) if lesser affordable housing job impacts can be demonstrated. Excluding the issue of the planned increase in minimum wage (explored later in this report), it is recommended that these two options be narrowly allowed per legal requirements, but not more broadly offered, to minimize administrative burden on staff. Timing of Fee Calculation and Payment As profiled in the case studies, most cities charge the commercial fee prior to or at the time of building permit issuance. Several cities split up the payments, allowing for partial payment later (at Certificate of Occupancy), while a few cities spread payments even farther apart over time, allowing for essentially a payment plan or the choice of an upfront net present value payment of the entire amount. In Los Angeles, the desire to not encumber a low-margin project has to be balanced with a desire by the City to obtain housing funding as soon as possible. There are also administrative challenges for a city as large and active as Los Angeles, to collect payments over time, once the Certificate of Occupancy has been issued. 40
111 About Residential Fees Overview of Residential Fees Residential fees for affordable housing apply to market rate units, and are based on the nexus or relationship between the occupants of a market-rate unit s spending in the economy, and the portion of this spending that generates workers low income households needing affordable units. One of the complexities around this kind of fee is that for most cities in California with a residential fee, the fee is rooted in an existing inclusionary housing program, which requires generally 10 to 15 percent of units in market rate projects be affordable to low and sometimes moderate income households. There are more than 170 inclusionary programs in cities and counties throughout California, many of which have been operating for decades. 10 Although these programs were structured to achieve production of affordable units within a market-rate development, creating a mixed-income project, most of these programs also offer an in-lieu fee option instead of providing on-site affordable units. With the Palmer/Sixth Street Properties L.P. v. City of Los Angeles court decision in 2009, these inclusionary programs were found to violate California s Costa Hawkins Act regarding rent control, and thus prohibited from requiring on-site mandatory unit requirements. The in-lieu fee for market rate rental projects, however, remained legal. Many cities and counties then determined that the fee should be based on a nexus study (which many in-lieu fees had previously not been based on), and many jurisdictions proceeded to update and/or amend their inclusionary ordinances, supporting inlieu fee requirements with nexus studies. Some legal questions remain regarding the relationship of different aspects of linkage fee policies to the California Mitigation Fee Act, but the nexus studies have nonetheless become common practice. Because the City of Los Angeles does not have an operative inclusionary housing program, a pre-existing in-lieu fee is not a factor. Instead, and similar to a few cities which have never adopted an inclusionary program, the City of Los Angeles is considering a new residential fee for affordable housing. Some other cities term this fee as an impact fee or development fee; for simplicity s sake, this report calls the fee under consideration a residential fee for affordable housing ( residential fee ). It should be noted that the process of establishing a nexus for the City of Los Angeles s residential fee is virtually the same as the nexus studies undertaken to support inclusionary housing in-lieu fees after Palmer. This analytical process is described in the following chapter. 10 Affordable by Choice: Trends in California Inclusionary Housing Programs (Non-Profit Housing Association of Northern California, 2006). 41
112 Summary of Case Studies This report profiles 11 cities with market-rate housing fees to produce affordable housing. The profiles include all large California cities with fee programs (e.g., San Francisco, Oakland, San Jose, and Sacramento), selected smaller southern California cities with economies similar to portions of Los Angeles (e.g., Santa Monica, West Hollywood, Pasadena, Santa Ana), along with a high-fee case in Palo Alto and two large cities elsewhere in the U.S. (e.g., Boston and Chicago). Appendix D provides a detailed discussion). The California cities selected for case studies in this report are not exhaustive; over 170 jurisdictions in California have mandatory inclusionary housing programs, and almost all require a fee payment for market rate rental projects (after the Palmer decision, fees are the only requirement legally available related to impose on market-rate rental projects). 11. Among the California cities profiled here, all except Oakland and San Jose had pre-existing mandatory inclusionary programs established prior to the Palmer decision, and as such, already had ongoing in-lieu fee program options. Therefore, the City of Los Angeles falls somewhere in the middle of this spectrum between long-established mandatory inclusionary programs with procedures and real estate markets that have adjusted to the concept, and new programs post-palmer that do not relate directly to this practice. The following table summarizes the case study cities, with key findings on the next page. 11 It should be noted that the state legislature has twice passed legislative fixes to Palmer for rental projects, both of which were vetoed by the Governor. However, the Governor has recently proposed a legislative fix as part of proposed legislation to waive CEQA review for certain by right housing projects with at least 5 percent affordable housing included within the project. As of July 2016, this most recent legislative proposal has again been dropped and is considered dead. These events are cited here to illustrate that the Palmer decision is reversible, and may be reversed by future California legislative action. 42
113 TABLE 12: SUMMARY OF RESIDENTIAL FEE CASE STUDIES Popoulation (a) 43 Fees Collected Annual Rev. Per Capita (c) Fee per Unit/Square Foot (b) Threshold Notes Large Cities in CA with Fee San Francisco (2002/2016) 829, units (d) 25+ Units (e) 10 units $10.1 M/year $ ,157 between Fees shown became effective June 1, 2016 SRO/Group Housing Unit (per $29,701 $49,007 (avg since 1992 & Q June 2016 ballot mesaure increased Studio (per unit) $39,602 $65,343 FY 2011/12) (program inclusionary % above level yielding the 1 Bedroom (per unit) $53,792 $88,757 structured to fees shown 2 Bedroom (per unit) $73,274 $120,902 generate units) 3 Bedroom (per unit) $83,560 $137,874 4 Bedroom (per unit) $104,286 $172,072 San Jose (2014) 986,320 Citywide Rental Downtown Core High Rise Rental 3 units NA (new) Fees effective July Downtown highrises (per sq. ft.) $17.00 $17.00 w/ CoO on or before 6/30/2021 are exempt. Oakland (2016) 402,339 Zone 1 Zone 2 Zone 3 N/A (new) Some zones phased in, all apply as of Multi-family (per unit) $22,000 $17,750 $12,000 7/1/2018 Townhome (per unit) $20,000 $14,250 $8,000 Single-Family (per unit) $23,000 $16,500 $8,000 Sacramento (2015) 476,075 <20 DU/acre 20 DU/acre $30,000 in $0.06 Single Units and Duplexes (per sq. ft.) $2.58 $0.00 first year Multi-Unit Dwellings (per sq. ft.) $2.58 $0.00 Non-Resl to Res Conversion (per sq. ft.) $0.00 $0.00 Units in a Housing Incentive Zone (per sq. ft.) $1.11 $1.11 Smaller Cities with Fee Santa Monica (2006/2015) 91,619 Rental Condominium 2 units $992,000/year $10.83 (per sq. ft.) $31.25 $36.51 (avg ) West Hollywood (2001/2007) 35,053 All Residential 2 units $1.3 M in $37.09 Updated nexus study in to 10 units (per sq. ft.) $ $27.13 FY Units (per sq. ft.) $27.13 Pasadena (2001) 139,065 Zone A Zone B Zone C Zone D 10 units $1.3 M/year $9.40 Update pending 2016 nexus study Rental Units (per sq. ft.) $35.37 $19.97 $32.89 $35.37 (avg) 50+ Rental Units (per sq. ft.) $49.12 $27.74 $45.68 $ Ownership Units (per sq. ft.) $47.01 $19.01 $29.66 $ Ownership Units (per sq. ft.) $65.30 $26.40 $41.20 $65.30 Santa Ana (2011) 331, Units 20+ Units 5 units $860,000/year $ Fees only apply to excess density above (per sq. ft.) $5.00 $15.00 (avg) zoning Palo Alto (2008/2016) 65,998 5 units Single Family Detached (per sq. ft.) $95.00 Single Family Attached (per sq. ft.) $50.00 Condominium (per sq. ft.) $50.00 Rental Housing $50.00 Major Cities Outside of CA with Fee Boston (2000/2015) 639,594 Zone A Zone B Zone C 10 units $8 M/year (avg) $ ,597 units Rental (per unit) $68,400 $54,000 $30,000 between Ownership (f) (f) (f) Chicago (2003/2015) 2,712,608 Citywide Low-Mod Inc Citywide Higher Inc Downtown Rental Downtown Ownership 10 units $5.6 M/year $2.05 (per unit) $12,500 $31,250 $28,750 to $28,750 to (avg.) $43,750 $56,250 Notes: (a) All population figures from American Community Survey. (b) Each jurisdiction charges fees either on a per square foot or per unit basis. (c) Per capita annual average revenue based on ACS population estimates. Revenues are not adjusted for inflation, changes in fee rates, or other factors. (d) Reflects an off-site inclusionary requirement of 20 percent of units n the principal project. (e) Reflets an off-site inclusionary requirement of 33 percent of units in the principal project. (f) For ownership projects, fee is greater of rental fee, or 50% of price difference between market rate and affordable unit. Sources: ACS, ; BAE, Aff. Units Produced
114 Review of the case studies indicates the following key points: Fee Charges and Structure Direct comparisons among cities is difficult due to the variation of fee structures; some cities charge per square foot, while others charge per unit by density variations or size of project. Residential fees for affordable housing charged by larger cities with a diverse real estate market range from a low of $1.11 per square foot in Sacramento (e.g., $1,100 per unit for 1,000 square feet), to over $172,000 per unit in San Francisco (for a 4- bedroom unit). Some cities, notably Santa Ana, Boston, and Chicago, only charge this kind of fee (and only apply their inclusionary ordinances) to projects with public financial assistance or those seeking a zoning change. Sacramento, Pasadena, Oakland, Boston, and Chicago take a zone approach to their fee schedules, seeking to incentivize housing production through lower fees in areas with more modest market conditions or for other policy reasons. San Jose also takes a zone/product type approach, exempting downtown high rise housing projects from the fee until This is an interesting product type/time frame targeting approach to foster the city s goal of increased production of dense downtown market-rate housing. Several cities (e.g., San Francisco, West Hollywood, and Pasadena) have developed fee schedules based on project size (e.g., number of units), with lower fees for smaller projects. San Francisco is the only city profiled which has a differentiated on- and off-site policy, originally designed to foster on-site unit production, although it should be noted that other California cities not profiled in this report have taken a similar approach. Waivers, Exemptions, and Refunds All cities waive the fee for 100 percent affordable housing projects. All cities exempt publicly-owned projects. Some cities waive non-profit buildings, and/or churches, schools (public and private), universities and colleges, and other similar categories of land use. Most cities offer a units in lieu of fee and/or land donation in lieu of fee option. For individual newly-constructed single family units, some cities charge a fee, while others do not. Some cities have established clear refund processes if projects are subsequently not constructed, while others allow for refund requests decided on a case-by-case basis. During economic downturns, cities have either created special deferral programs or lowered fees across the board. These approaches demonstrate that these kinds of fees can be customized to adapt to downturns in the economic cycle. 44
115 All cities in California have a hardship exemption available per legal requirements. Some cities render a hardship decision administratively; others have a more formal process. Revenues and Reporting Estimates of revenues collected from residential fees range from less than $1 million to over $10 million per year, depending on the city s fee structure, size, and amount of residential development activity. It is import to note that with the exception of Oakland and San Jose, these fees have long been part of inclusionary programs which were structured to produce units within new projects, so instead of fees, cities obtained affordable units (not tracked in this report). If Los Angeles were to adopt a residential fee, it would be more akin to Oakland and San Jose, both of which are essentially starting from scratch, not able to require units in rental projects (just fees). Since both Oakland s and San Jose s fee programs are new, neither can be relied on to inform fee collection patterns at this time. Most cities do not specifically track the use of these fees to build affordable housing projects, because the funds go into a trust fund and are used in combination with other sources per project. San Francisco last reported its sources and uses of commercial linkage fees along with other revenue sources comprising its Affordable Housing Fund as part of a larger annual report for FY Its reporting does clearly show both source and use of each funding stream within its Affordable Housing Fund, along with remaining balances at year end. Most cities have general guidelines for use of commercial fee funds such as maximum AMI levels that can be served in new affordable units, rather than targeting the funds specifically to serve households with the greatest need (e.g., at-risk of homelessness/extremely low income/very low income). The City of Los Angeles, with great need for new affordable units serving extremely low and very low income households, may wish to develop policies to target commercial fee funds. 45
116 Los Angeles Residential Fee Analysis Overview of Methodology The maximum residential fee calculation is based on the premise that new households in Los Angeles spend money within the local economy, thereby supporting employment for new workers, a portion of which will be in need of affordable housing. The intent of the market-rate residential fee is to generate revenue that will support the construction of affordable housing affordable to these new lower-income worker households. This section provides an overview of the steps used to determine the maximum legal fee for market-rate residential units. Each step is discussed in more detail in the following sections. Step 1: Define Housing Types The Nexus Study identified four residential land uses to determine the maximum legal fee for each residential product type. The residential product types analyzed in this study consist of multifamily rental units, condominium units, single-family attached units, and single-family detached units. Step 2: Identify Housing Prices for New Market-Rate Units The Nexus Study estimated sale prices for new market rate units based on rent and sale price data for recently-constructed properties in Los Angeles. The analysis used rent and sale price data for units built in 2006 or later to approximate typical housing costs for the new units that would be subject to the impact fee. Step 3: Estimate the Incomes of Households in New Market Rate Housing Based on the rent and sale prices identified in Step 2, the Nexus Study estimated the household incomes of occupants in new residential units in Los Angeles, assuming that households spend 30 percent of gross household income on housing costs. Step 4: Analyze Projected Spending Patterns for Households in New Market-Rate Units Based on the household income figures from Step 3, the Nexus Study uses IMPLAN to estimate spending patterns among households that would occupy new units in the City and the number of new jobs that this spending would support. The IMPLAN output includes the number of new workers by industry from new household spending. Step 5: Estimate New Worker Households by Household Income The analysis uses a data set published by the U.S. Census (the Public Use Microdata Sample or PUMS) to estimate the household income distribution among the worker households derived from Step 4. 46
117 Step 6: Calculate Financing Gap per Affordable Unit The next step in the nexus analysis is to determine the per unit financing gap that affordable housing developers encounter when securing a permanent loan for their projects. Step 6 of the Nexus Study calculates the net operating income (NOI) generated by units affordable to extremely low-, very low-, low-, and moderate-income households. Using conventional financing assumptions, the analysis determines the supportable loan amount based on the NOI from units at each income level. The cost to house a lower-income household is the difference between the cost to develop an affordable unit and the amount the developer can borrow to build the unit. Using data on recent affordable housing developments in the City of Los Angeles, the Nexus Study determined the average cost to build an affordable rental unit in the City. The supportable permanent loan amounts identified in Step 6 were deducted from the average per-unit development cost to determine the financing gap for units serving households at each income level up to 120 percent of AMI. Step 7: Calculate the Maximum Legal Fee The final step in calculating the impact fee is to apply the financing gap per unit for each income level (from Step 6) to the total housing need by income level from new market-rate units (from Step 5). Step 8 Test Feasibility of Maximum Legal Fee Under Different Market Conditions The City of Los Angeles has a wide range of neighborhoods and corresponding market conditions. In order to ensure that market-rate commercial development is not effected by any fee that may be adopted, this step identifies three general levels of market condition throughout the City, and analyzes the financial return from a development project, in order to identify feasible levels of fee by land use. Step 9: Formulate Feasible Fee Schedule This step involves a summary fee schedule tested for feasibility, along with policy recommendations for phasing it in, administration, and other options for consideration. 47
118 FIGURE 8: SUMMARY OF MARKET-RATE HOUSING FEE METHODOLOGY 1. Define Housing Types 4 Categories Based on building permit database analysis 2. Identify Costs of NewMarket Rate Housing Rental or sale prices for all 4 residential product types 3. Estimate HH Incomes of Renters & Buyers Incomes needed to rent or buy market rate housing 4. Estimate Spending by Market Rate Households & New Jobs Created Use IMPLAN to generate this information 5. Estimate Worker Household Incomes Distribution of household incomes for new workers 6. Calculate Financing Gap Gap between cost to build affordable rental unit & HHs ability to pay 7. Calculate Maximum Fee By housing type per unit 8. Conduct Feasibility Test Max fee to maintain feasibility Test by Low/Med/High Market Conditions 9. Formulate Feasible Fee Schedule By Building Type By Market Condition or Geographic Zone 48
119 Residential Land Uses Step 1: Define Housing Types In order to formulate commercial land use categories that reflect actual development in Los Angeles, the City s building permit data was analyzed for the 2011 to 2015 period (see Appendix E for summary data). The City issued building permits for an average of approximately 14.0 million square feet of new residential space per year for the period, including an average of 990 single family detached units with 3.7 million square feet 12. Just under 70 percent of permitted square feet was in multifamily rental, averaging 8,268 units in 9.8 million square feet annually for the period. The graph below shows the annual average for residential units permitted for the time period analyzed. It is important to note that this average over the past five years may not be predictive; longer look-back time periods may yield a lower annual average number of permits, but would be based on changing circumstances and include cycles of growth and recession that may not be repeated in future decades. FIGURE 9: AVERAGE ANNUAL NEW PERMITTED RESIDENTIAL UNITS, CITY OF LA, Multifamily Rental Single Family Detached Single Family Attached Multifamily Condominium 8,268 Source: LA Building Permit data, Note that the building permit database codes projects by single family detached and single family attached. The City s zoning related to small lot subdivisions has resulted in several projects on small lots (minimum lot size of 2,000 square feet). The permit data contains these small lot subdivisions coded to the single family detached permit category. 49
120 The Nexus Study analyzed four residential land uses to determine the maximum legal fee for each residential product type. As shown in the following tables, the residential product types analyzed in this study consist of: Single Family Detached Units Single Family Attached Units Condominium Units Multifamily Rental Units New Worker Households and Affordable Housing Need The Nexus Study estimates the affordable housing need generated by new market-rate units based on the projected spending patterns among the households that would occupy new market-rate units, the jobs that these spending patterns would support, and the affordable housing need among the workers employed in these jobs. This section details the methodology and findings from each of these steps to estimate the need for affordable housing generated by new market-rate units. Step 2: Identify Housing Prices for New Market-Rate Units The first step in estimating the new worker affordable housing need that would be generated by new market-rate residential units is to determine the rental rates and home sale prices for new residential units. Multifamily Rental Units: BAE obtained data from Reis, a private data vendor that provides property-level information on multifamily rental properties, in order to estimate rental rates for new multifamily rental properties in Los Angeles. This analysis used 2016 rental rate data for all 149 multifamily rental properties (24,495 total units) built in 2006 or later that Reis tracks in the City. Since the units included in this analysis are among the newer rental units in Los Angeles, the rental rates for these properties are likely to be similar to rental rates for new multifamily rental properties in the City. As of the second quarter of 2016, the average rental rate among multifamily rental units in Los Angeles was $2,923 per month, as shown in Table
121 TABLE 13: NEW MULTIFAMILY RENTAL HOUSING MARKET OVERVIEW, LOS ANGELES, 2016 Average Rent $2,923 Studio $2,087 1-Bedroom $2,536 2-Bedroom $3,435 3-Bedroom $4,014 Vacancy Rate (a) 4.6% Notes: (a) Vacancy rate for developments completed between 2006 and 2014 in order to capture new properties that have passed the initial lease-up period. Sources: Reis, 2016; BAE, For Sale Units: BAE obtained data from CoreLogic, a private data vendor that provides data on home sales from county assessors, in order to estimate sale prices for new for-sale units in Los Angeles. This analysis used data on sales of recently-constructed (i.e., built in 2006 or later) for sale units that occurred between July 2015 and July BAE conducted a detailed analysis of the data from CoreLogic in order to code each sale record as one of the three for-sale product types (i.e., condominium, single-family attached, or single-family detached). The data from CoreLogic include a code for each home sale record that identifies the unit as either a condominium or single-family residential unit, but does not code single-family attached units in a way that differentiates these units from either condominiums or single-family detached units. BAE cross-checked the data from CoreLogic with data from Redfin.com, which identifies residential units as either condominiums, townhomes, or single-family units, in order to re-categorize the unit types from the CoreLogic sale records as appropriate. In addition, BAE performed a thorough review of hundreds of the CoreLogic sale records to ensure that each was property categorized into one of the three for-sale residential product types, and re-coded records as necessary. The analysis of recent home sales in Los Angeles indicates that the median sale price for recently-constructed for-sale properties sold between July 2015 and July 2016 was $659,000 for condominiums, $540,000 for single-family attached units, and $1.17 million for singlefamily detached units, as shown in Table
122 TABLE 14: NEW FOR-SALE HOUSING MARKET OVERVIEW, LOS ANGELES, 2016 Percent of Recent Income Max. Affordable Sales of New Units Income Level Limit (a) Sale Price (b) in Price Range (c) Single-Family Detached Extremely Low-Income (Up to 30% AMI) $23,450 $118, % Very Low-Income (Up to 50% AMI) $39,100 $196, % Low-Income (Up to 80% AMI) $62,550 $315, % Moderate-Income (Up to 120% AMI) $70,000 $352, % Median Sale Price $1,170,000 Number of Units Sold 322 Single-Family Attached/Townhomes Extremely Low-Income (Up to 30% AMI) $23,450 $39, % Very Low-Income (Up to 50% AMI) $39,100 $118, % Low-Income (Up to 80% AMI) $62,550 $236, % Moderate-Income (Up to 120% AMI) $70,000 $274, % Median Sale Price $540,000 Number of Units Sold 123 Condominiums Extremely Low-Income (Up to 30% AMI) $23,450 $39, % Very Low-Income (Up to 50% AMI) $39,100 $118, % Low-Income (Up to 80% AMI) $62,550 $236, % Moderate-Income (Up to 120% AMI) $70,000 $274, % Median Sale Price $659,000 Number of Units Sold 923 Notes: Annual Interest Rate (fixed) 3.60% Term of mortgage (years) 30 Percent of sale price as down payment 20% Initial property tax (annual) 1.19% Mortgage Insurance as percent of loan amount 0.0% Annual homeowner's insurance rate as percent of sale price 0.40% Monthly homeowners' association fee (condos & townhomes only) $390 Percent of household income available for housing costs 30% (a) Income limits published by the CA Department of Housing and Community Development for a three-person household in Los Angeles County, (b) See Appendix A for affordability calculations. (c) Includes of all sales of homes built in 2006 or later and sold between 03/15/2016 and 06/15/2016 in the City of Los Angeles. Sources: California Department of Housing and Community Development, 2016; Freddie Mac, 2016; Los Angeles County Auditor-Controller's Office, 2016; CA Dept. of Insurance, 2016; BAE,
123 Step 3: Estimate the Incomes of Households in New Market Rate Housing The Nexus Study uses the rent and sale prices for new units in Los Angeles, as identified in Step 2, to estimate the household incomes of households that occupy new rental and for sale units in Los Angeles. Multifamily Rental Units: Table 15 presents the annual household income required to rent new multifamily rental units in Los Angeles, assuming households spend 30 percent of their gross income on rent and utilities. Based on the weighted average monthly rent of $2,923 for new multifamily rental units (as shown in Step 2) the annual household income required to afford these market rents is $118,400. Table 15 also presents the estimated aggregate income for all households in new multifamily rental developments, calculated by multiplying the estimated household income by the 100 units in the development. This results in an aggregate income in the development of $11.8 million. The IMPLAN analysis discussed in the following section uses this aggregate income from the development to project spending patterns among new residents in multifamily rental units. TABLE 15: HOUSEHOLD INCOME REQUIRED TO RENT NEW MULTIFAMILY UNITS, LOS ANGELES, 2016 Average Monthly Rent (a) $2,923 Plus Utilities (b) $38 Total Monthly Housing Costs $2,961 Annual Housing Costs $35,528 Household Income Required (c) $118,400 Number of Households in Development 100 Aggregate Income in Development $11,840,000 Notes: (a) Data are for multifamily properties constructed in the City of Los Angeles that were constructed in 2006 or later and consist of more than 20 units. (b) Utility costs based on utility allowance for multifamily dwellings established by the Los Angeles Housing Authority in Utility cost estimates assume that water, sewer, and trash collection costs are included in monthly rental amount. (c) 30 percent of gross income spent on housing costs. Sources: Reis, 2016; Los Angeles Housing Authority, 2016; BAE, For-Sale Units: Table 16 shows the annual household income required to afford a new for-sale home in Low Angeles. Based on the sale prices for new for sale units (as shown in Step 2), the annual household income needed to afford new for-sale units in Los Angeles is $146,300 for condominiums, $107,100 for single-family attached units, and $232,100 for single-family detached units. The resulting estimated aggregate income is approximately $14.6 million for a 100-unit condominium development, $10.7 million for a 100-unit single-family attached 53
124 development, and $23.2 million for a 100-unit single-family detached development. The IMPLAN analysis discussed in the following section uses these aggregate incomes to project spending patterns among new residents in for-sale units, which in turn determines the estimated new worker households that may need affordable housing. TABLE 16: HOUSEHOLD INCOME REQUIRED TO PURCHASE NEW UNITS, LA, 2016 Single-Family Single-Family Detached Attached Condominium Estimated Sale Price for New Residential Unit (a) $1,170,000 $540,000 $659,000 Monthly Housing Costs for a New Residential Unit (b) $5,803 $2,678 $3,659 Annual Housing Costs $69,640 $32,141 $43,904 Household Income Required (c) $232,100 $107,100 $146,300 Number of Households in Development Aggregate Income in Development $23,210,000 $10,710,000 $14,630,000 Notes: (a) Median sale price among homes built in 2006 or later and sold between 03/15/2016 and 06/15/2016 in the City of Los Angeles. (b) Monthly homeownership costs are based on the following assumptions: Annual Interest Rate 3.60% Term of Mortgage (years) 30 Percent of sales price as down payment 20% Initial property tax (annual) 1.19% Mortgage Insurance as a percent of sale price 0.0% Annual homeowner's insurance rate as a percent of sale price 0.40% Monthly homeowners' association fee (condominiums only) $390 (c) Percent of household income available for housing costs: 30% Sources: CoreLogic, 2016; Freddie Mac, 2016; California Department of Insurance, 2016; Los Angeles County Auditor-Controller, 2016; Condos.com, 2016; BAE, Step 4: Analyze Projected Spending Patterns for Households in New Market-Rate Units New household spending within an economy supports jobs. As households spend money on retail goods, food, and health, personal, professional, and educational services, they support job growth in these and other sectors. To estimate the effect of new household spending on employment generation, this nexus study uses IMPLAN ( Impact analysis for Planning ), a widely-accepted and utilized software model. At the heart of the model is an input-output dollar flow table. For a specified region, the inputoutput table accounts for all dollar flows between different sectors of the economy. Using this information, IMPLAN models the way income injected into one sector is spent and re-spent in other sectors of the economy, generating waves of economic activity, or so-called economic multiplier effects. Appendix G contains a more detailed overview of IMPLAN. 54
125 The IMPLAN model is also able to estimate the number of direct, indirect, and induced jobs generated by a given economic event. Once the economic events have been entered into the model, IMPLAN reports the following types of impacts: Direct Impacts. Direct impacts refer to the set of producer or consumer expenditures applied to the predictive model for impact analysis. It is the amount of spending available to flow through the local economy. IMPLAN then displays how the local economy will then respond to these initial changes. The direct impacts may equal the amount of spending input into the model, depending on a variety of factors. Indirect Impacts. The indirect impacts refer to the impact of local industries buying goods and services from other local industries. The cycle of spending works its way backward through the supply chain until all money leaks from the local economy, either through imports or by payments to income and taxes. For capital projects this would include payments for construction inputs such as wood, steel, office supplies, and any other non-labor payments that a construction firm would purchase in the building process. Since IMPLAN is only used for the housing analysis for this report to assess the impacts of new resident household expenditures, there are no indirect impacts to assess as there are no industry expenditures as inputs to the model. Induced Impacts. The induced impacts refer to an economy s response to an initial change (direct impact) that occurs through re-spending of income according to household spending patterns. When households earn income, they spend part of that income on goods and services, such as food and healthcare. IMPLAN models households disposable income spending patterns and distributes them through the local economy. For the purpose of this analysis, the economic event is the household spending by occupants of new residential units in Los Angeles. By IMPLAN definition these expenditures are direct impacts, and the resulting spending results in induced impacts. For instance, the household expenditures generate jobs for cashiers and baggers at grocery stores patronized by the households. The process initiated by household expenditures continues as these workers and the businesses they work for spend money in subsequent transactions, supporting employment at places other than the initial point of sale, such as wholesalers supplying retail stores, or truck drivers delivering goods to those stores. In turn, these businesses and workers spend money to generate additional activity in the local economy. These are all part of the induced impacts linked to the household expenditures. The IMPLAN model is customized to reflect the economic characteristics of the specified region in this case Los Angeles County. The nexus analysis considers regional employment generation, rather than jobs generated in the City of Los Angeles exclusively, because household spending in the City creates jobs throughout the region. Some of these workers cannot afford to live in Los Angeles precisely because of the City s high housing costs. If the 55
126 analysis solely considered workers living in Los Angeles, it would in effect discount the needs of households who currently cannot afford to live in Los Angeles, and propagate the need for affordable housing in the City. In essence, this analysis considers employment effects beyond the City s borders in order to address the City s fair share of regional housing need. Step 5: Estimate New Worker Households by Household Income Worker households 13 in Los Angeles often have more than one employed person. In some instances, economists estimate household income for workers by simply multiplying worker earnings by industry by the average number of workers per worker household. This methodology relies on the unsatisfactory assumption that on average workers make the same amount of money as other workers in their household. Given the diversity of household composition, this assumption is not appropriate. For example, a household may have a teacher and a doctor, with significantly different individual earnings. To address this issue, this analysis makes use of a detailed and rich data set published by the U.S. Census known as the Public Use Microdata Sample (PUMS). Derived from a five percent sample of all households per the American Community Survey, and available for certain defined areas with 100,000 population or more called PUMAs, this data allows one to cross tabulate variables such as industry of employment and household income. The analysis here uses the most recent available data, from the 2010 through 2014 five-year period. A map of the PUMAs comprising Los Angeles County is provided in Appendix F. The PUMS data set was queried to identify the number of households by income category by industry (controlling for household size) to construct a household income distribution by industry. The distribution was constructed based on the income categories defined by the California Department of Housing and Community Development (HCD). These HCD income categories are defined as a percentage of the Area Median Income (AMI), adjusted for household size. The household income distribution by industry is shown in Table A worker household is defined as a household with one or more employed persons. They may be wage and salary workers, or self-employed/sole proprietors. 56
127 TABLE 17: INCOME LEVEL BY INDUSTRY, PERSONS BY 2014 INCOME LIMITS Estimated Household Income as a Percent of AMI (a) 50% to NAICS Code Industry Up to 30% AMI 30% to 50% AMI 80% AMI 80% - 120% AMI Above 120% AMI Total Private Sector 11, 21 Agriculture & Natural Resources 20.1% 21.6% 21.7% 6.6% 30.0% 100.0% 23 Construction 21.3% 18.2% 21.2% 6.0% 33.2% 100.0% Manufacturing 12.9% 16.1% 20.6% 6.2% 44.2% 100.0% 42 Wholesale Trade 12.4% 14.2% 21.1% 6.8% 45.6% 100.0% Retail Trade 16.8% 16.6% 20.7% 6.7% 39.1% 100.0% 48-49, 22 Transportation, Warehousing, & Utilities 12.5% 15.4% 20.6% 6.6% 44.9% 100.0% 51 Information 7.4% 6.7% 13.3% 5.0% 67.5% 100.0% Finance, Insurance, & Real Estate 7.8% 8.9% 15.3% 6.3% 61.8% 100.0% Professional, Scientific, & Technical 7.1% 6.7% 11.7% 4.6% 69.9% 100.0% Services, & Mgmt of Companies 56 Admin, Support, & Waste Mgmt Srvcs 21.5% 19.8% 20.7% 6.4% 31.6% 100.0% 61 Educational Services 12.8% 10.6% 15.6% 5.9% 55.1% 100.0% 62 Health Care & Social Assistance 11.4% 11.6% 17.8% 6.2% 53.1% 100.0% Leisure & Hospitality 18.2% 18.3% 21.7% 6.1% 35.6% 100.0% 81 Other Services Except Public Admin 21.8% 18.9% 21.2% 5.9% 32.2% 100.0% All Government Employment 9.2% 9.3% 14.4% 5.9% 61.2% 100.0% Notes: (a) Based on a cross tabulation of Public Use Microdata Samples (PUMS) from the American Community Survey. These incomes were compared to household income limits published by the California Department of Housing and Community Development, to determine the percentage of households falling into each income category. The analysis controlled for household size, to address the varying HCD income limits for each household size. Sources: Census, American Community Survey Public-Use Microdata Sample (PUMS) ; CA Dept. of Housing and Community Development, 2014; BAE, Housing need is based on the number of households rather than the number of jobs. As such, jobs are translated into households by dividing the number of jobs by the average number of workers per worker household in the City of Los Angeles. 14 Multifamily Rental Housing: Table 18 applies the income distribution by industry to the number of jobs generated in each industry as a result of spending by households in new rental units. As shown, a 100-unit apartment complex generates a total of 42 households across various income groups and 23 households earning up to 120 percent of AMI. Condominiums: Table 19 applies the income distribution by industry to the number of jobs generated in each industry as a result of spending by households in new condominiums. As shown, a 100-unit condominium development generates a total of 48 households across various income groups and 26 households earning up to 120 percent of AMI. Single-Family Attached: Table 20 applies the income distribution by industry to the number of jobs generated in each industry as a result of spending by households in new single-family 14 Average workers per worker household from American Community Survey,
128 attached units. As shown, 100 single-family attached units generate a total of 35 households across various income groups and 19 households earning up to 120 percent of AMI. Single-Family Detached: Table 21 applies the income distribution by industry to the number of jobs generated in each industry as a result of spending by households in new single-family detached units. As shown, 100 single-family detached units generate a total of 73 households across the various income groups and 39 households earning up to 120 percent of AMI. 58
129 TABLE 18: EMPLOYMENT BY INCOME LEVEL FROM NEW 100-UNIT MARKET-RATE RENTAL PROJECT Total Jobs (a) Up to 30% AMI Estimated Jobs by Percent of AMI (b) 30% to 50% to 80% to 50% AMI 80% AMI 120% AMI Above 120% AMI NAICS Code Industry Private Sector 11, 21 Agriculture and Natural Resources Construction Manufacturing Wholesale Trade Retail Trade , 22 Transportation, Warehousing, and Utilities Information Finance, Insurance, and Real Estate Professional, Scientific, & Technical Services, & Mgmt of Companies 56 Administrative and Support and Waste Management Services Educational Services Health Care and Social Assistance Leisure and Hospitality Other Services Except Public Administration All Government Employment Total Jobs Number of Households (c) Notes: (a) Total Jobs is output of IMPLAN model, and shows employment generated by household spending. Columns to right may not sum to Total Jobs due to independent rounding. (b) Based on 2014 HCD Income Limits. (c) Average number of workers per worker household calculated for Los Angeles County based on American Community Community Survey data, Total Workers 1,849,845 Total Households with Workers 1,047,928 Avg. Workers per Household Sources: American Community Survey, , including the Public User Microdata Sample; CA Department of Housing and Community Development, 2014; BAE,
130 TABLE 19: EMPLOYMENT BY INCOME LEVEL FROM NEW 100-UNIT CONDOMINIUM PROJECT Total Jobs (a) Estimated Jobs by Percent of AMI (b) Up to 30% 30% to 50% to 80% to AMI 50% AMI 80% AMI 120% AMI Above 120% AMI NAICS Code Industry Private Sector 11, 21 Agriculture and Natural Resources Construction Manufacturing Wholesale Trade Retail Trade , 22 Transportation, Warehousing, and Utilities Information Finance, Insurance, and Real Estate Professional, Scientific, & Technical Services, & Mgmt of Companies 56 Administrative and Support and Waste Management Services Educational Services Health Care and Social Assistance Leisure and Hospitality Other Services Except Public Administration All Government Employment Total Jobs Number of Households (a) Notes: (a) Total Jobs is output of IMPLAN model, and shows employment generated by household spending. Columns to right may not sum to Total Jobs due to independent rounding. (b) Based on 2014 HCD Income Limits. (c) Average number of workers per worker household calculated for Los Angeles County based on American Community Community Survey data, Total Workers 1,849,845 Total Households with Workers 1,047,928 Avg. Workers per Household Sources: American Community Survey, , including the Public User Microdata Sample; CA Department of Housing and Community Development, 2014; BAE,
131 TABLE 20: EMPLOYMENT FROM NEW 100-UNIT SINGLE-FAMILY ATTACHED RESIDENTIAL PROJECT Total Jobs (a) Estimated Jobs by Percent of AMI (b) Up to 30% 30% to 50% to 80% to AMI 50% AMI 80% AMI 120% AMI Above 120% AMI NAICS Code Industry Private Sector 11, 21 Agriculture and Natural Resources Construction Manufacturing Wholesale Trade Retail Trade , 22 Transportation, Warehousing, and Utilities Information Finance, Insurance, and Real Estate Professional, Scientific, & Technical Services, & Mgmt of Companies 56 Administrative and Support and Waste Management Services Educational Services Health Care and Social Assistance Leisure and Hospitality Other Services Except Public Administration All Government Employment Total Jobs Number of Households (a) Notes: (a) Total Jobs is output of IMPLAN model, and shows employment generated by household spending. Columns to right may not sum to Total Jobs due to independent rounding. (b) Based on 2014 HCD Income Limits. (c) Average number of workers per worker household calculated for Los Angeles County based on American Community Community Survey data, Total Workers 1,849,845 Total Households with Workers 1,047,928 Avg. Workers per Household Sources: American Community Survey, , including the Public User Microdata Sample; CA Department of Housing and Community Development, 2014; BAE,
132 TABLE 21: EMPLOYMENT FROM NEW 100-UNIT SINGLE-FAMILY DETACHED RESIDENTIAL PROJECT Total Jobs (a) Estimated Jobs by Percent of AMI (b) Up to 30% 30% to 50% to 80% to AMI 50% AMI 80% AMI 120% AMI Above 120% AMI NAICS Code Industry Private Sector 11, 21 Agriculture and Natural Resources Construction Manufacturing Wholesale Trade Retail Trade , 22 Transportation, Warehousing, and Utilities Information Finance, Insurance, and Real Estate Professional, Scientific, & Technical Services, & Mgmt of Companies 56 Administrative and Support and Waste Management Services Educational Services Health Care and Social Assistance Leisure and Hospitality Other Services Except Public Administration All Government Employment Total Jobs Number of Households (a) Notes: (a) Total Jobs is output of IMPLAN model, and shows employment generated by household spending. Columns to right may not sum to Total Jobs due to independent rounding. (b) Based on 2014 HCD Income Limits. (c) Average number of workers per worker household calculated for Los Angeles County based on American Community Community Survey data, Total Workers 1,849,845 Total Households with Workers 1,047,928 Avg. Workers per Household Sources: American Community Survey, , including the Public User Microdata Sample; CA Department of Housing and Community Development, 2014; BAE,
133 Subsidy Gap Step 6: Determine the Financing Gap for Affordable Units The next step in the nexus analysis is to calculate the cost to house the extremely low-, very low-, low-, and moderate-income households calculated in Step 6 by determining the per unit financing gap that affordable housing developers encounter when securing a permanent loan for their projects. In other words, the cost to house a lower-income household is the difference between the cost to develop an affordable unit and the amount the developer can borrow to build the unit. Affordable housing developers are able to secure a permanent loan based on their net operating income (NOI) per unit. NOI is equal to rental income less operating expenses and vacancy. As shown in Table 7 in Chapter 2, households can afford monthly rents ranging from $544 for extremely low-income households to $1,708 for moderate-income households. These rents are based on household income limits for three-person households and assuming households spend 30 percent of their income on rent and utilities. 15 Standard deductions are taken for operating expenses and vacancies to determine NOI. BAE used conventional financing assumptions to determine the supportable loan amount per unit for each income level. As shown in Table 7 in Chapter 2, the loan amount ranges from $0 per unit for extremely low-income units (i.e., operating expenses exceed NOI, leaving no NOI to support debt payments) to $152,301 for units serving moderate-income households. The financing gap per affordable unit is equal to the total development cost less the supportable loan amount per unit. According to cost data provided between 2013 and 2015 on applications for low-income housing tax credit projects in the City of Los Angeles, the average development cost for affordable housing in the City averages approximately $448,500 per unit, as shown in Table The analysis assumes a three-person household for consistency with the 2016 Los Angeles County average household size of 2.88 persons per household, per California Department of Finance estimates. 63
134 TABLE 22: DEVELOPMENT COSTS FOR AFFORDABLE HOUSING, CITY OF LOS ANGELES, Avg. Development Number of Housing Type Cost (per unit) (a) Units Homeless & Special Needs $410, Large Family $502, Senior $382, Weighted Average - All Housing Types $448,479 1,503 Note: (a) Weighted average cost as reported on tax credit applications between 2013 and All costs adjusted to 2016 costs based on the Turner Building Cost Index. Sources: City of Los Angeles, 2016; BAE, This study uses the average development cost across all affordable housing types despite the likelihood that most of the new worker households needing affordable units will be housed in large family developments, which in practice accommodate a range of household sizes and mostly serve lower-income worker households. Among units in the large family developments analyzed in this study, three percent were studios, 35 percent were one-bedroom units, 28 percent were two-bedroom units, 32 percent were three-bedroom units, and on percent were units with four or more bedrooms. In contrast, homeless, special needs, and senior developments, typically have a large number of occupants living on social security. However, by using the average across all affordable unit types, the Nexus Study is conservative in estimating the financing gap associated with constructing new units because the average development costs for homeless, special needs and senior units tend to be lower than the development costs for large family units. Based on the supportable loan amount calculated in Step 6, the financing gap per affordable unit ranges from $448,500 for extremely low-income units to $296,199 for moderate-income units, as shown in Table
135 TABLE 23: FINANCING GAP ANALYSIS, CITY OF LOS ANGELES, 2016 Income Group Extremely Low Very Low Low Moderate Household Income Limit (a) $23,450 $39,100 $62,550 $70,000 Maximum Affordable Monthly Rent per Unit (b) $544 $936 $1,522 $1,708 Monthly Operating Expenses (c) $542 $542 $542 $542 Vacancy (d) 5% 5% 5% 5% Net Operating Income per Unit (e) -$25 $347 $904 $1,081 Operating Subsidy from Other Sources (f) $25 $0 $0 $0 Monthly Supportable Debt Service per Unit (g) $0 $278 $723 $865 Loan Amount (h) $0 $48,900 $127,371 $152,301 Financing Gap per Affordable Unit (i) $448,500 $399,600 $321,129 $296,199 Assumptions Total Affordable Unit Development Costs (j) $448,500 Financing Terms Debt Coverage Ratio 1.25 Interest Rate 5.50% Term of Loan (years) 30 Notes: (a) Based on a 3-person household, CA Department of Housing & Community Development, (b) 30% of income to rent and utilities. (c) Data from funding applications for recent affordable housing projects in California. (d) Standard required assumption for financing applications. (e) Affordable Monthly Rent less Operating Expenses & Vacancy. (f) Operating subsidy is necessary for units with negative NOI. (g) Net Operating Income plus Operating Subsidy, divided by Debt Coverage Ratio. (h) Based on financing terms assumptions. (i) Total Development Costs less Loan Amount. (j) Average development costs among units in tax credit projects developed in the City of Los Angeles between 2013 and All figures adjusted to 2016 values based on the Turner Construction Cost Index. Sources: California HCD, 2016; City of Los Angeles, 2016; Turner Construction Cost Index, ; BAE,
136 Maximum Legal Fee Step 7: Calculate the Maximum Legal Fee The final step in calculating the impact fee is to apply the financing gap per unit for each income level (from Step 7) to the total housing need by income level from new market-rate units (from Step 5). As shown in Table 24, the maximum impact fees for each of the four residential product types are as follows: Multifamily Rental: $84,964 per unit Condominium: $95,484 per unit Single-Family Attached: $69,900 per unit Single-Family Detached: $145,901 per unit TABLE 24: MAXIMUM AFFORDABLE HOUSING IMPACT FEE CALCULATIONS Multifamily Single-Family Single-Family Employee Households in City by Income Level Rental Condominium Attached Detached Extremely Low Income (up to 30% AMI) Very Low Income (31-50% AMI) Low Income (51-80% AMI) Moderate Income (81-120% AMI) Subtotal - Affordable Housing Need (Units) Above Moderate Income (over 120% AMI) Total Housing Need Financing Gap (a) Extremely Low Income Units $2,743,807 $3,089,354 $2,261,584 $4,726,450 Very Low Income Units $2,411,132 $2,711,989 $1,985,332 $4,144,578 Low Income Units $2,566,479 $2,879,691 $2,108,099 $4,395,613 Moderate Income Units $774,962 $867,372 $634,966 $1,323,442 Total Financing Gap per 100 Units $8,496,380 $9,548,406 $6,989,981 $14,590,083 Maximum Impact Fee per Unit $84,964 $95,484 $69,900 $145,901 Assumptions Building Size (# of units) 100 Note: (a) The financing gap is calculated by multiplying the number of employee housesholds at each income level by the financing gap per unit (from Step 7) at each affordability level. Source: BAE,
137 Feasibility of Maximum Legal Fee As shown in the preceding section, meeting the affordable housing costs generated by each residential land use category per the nexus analysis results in expensive maximum legal fee levels. In order to evaluate these maximum legal fees in the context of maintaining feasible market rate residential projects, this report involved extensive analysis of the Los Angeles real estate marketplace by three levels of current market condition, and then financial feasibility testing of each of the eight land use categories by each of the market conditions economic factors. As an overview, the analytical process included the following steps (each step is explained more fully in the following pages): Step A: Identification of Los Angeles neighborhoods Step B: Analysis of market rents/sale prices to categorize each neighborhood by market condition Step C: Formulation of basic static pro formas for each land use type to analyze the maximum feasible fee by land use and by the three market conditions Step D: Comparison of feasible fees to legal maximum fee Step A: Identification of Los Angeles Neighborhoods As detailed in the commercial fee chapter, this study used the Los Angeles Times neighborhoods to segment Los Angeles into three levels of market condition, as shown on the following map for residential markets. 67
138 FIGURE 10: RESIDENTIAL NEIGHBORHOOD MARKET CONDITIONS 68


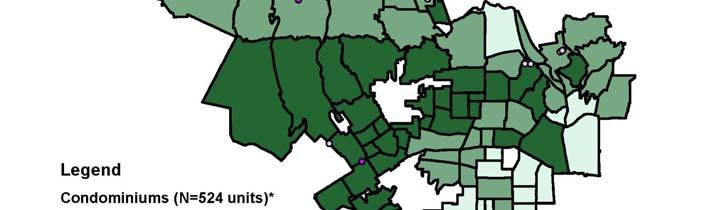
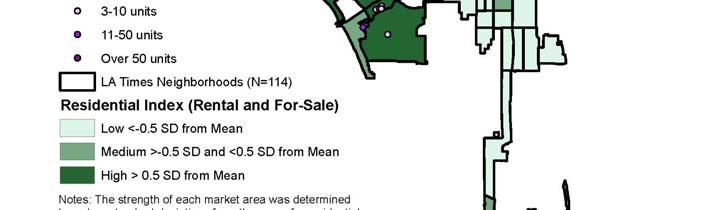
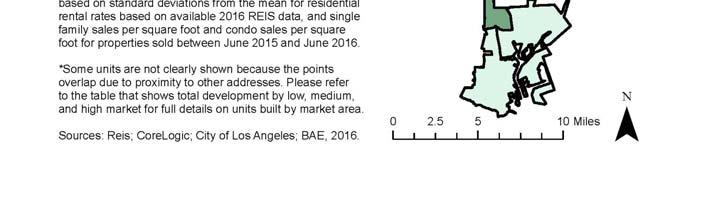
139 FIGURE 11: RESIDENTIAL PERMIT ACTIVITY BY MARKET CONDITION,


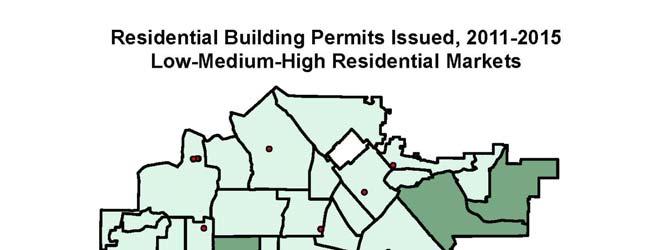


140 Single Family Detached Permit Activity New Construction,
141 Step C: Pro Forma Analysis to Determine Maximum Feasible Fee by Land Use for Each Market Condition This step involved the formulation of basis static pro forma models for each land use, with rent/sale revenue assumptions varied by market condition. A conservative approach was taken to ensure that feasible findings would be developed. A summary of the research informing each key assumption is described below: Development Prototype For each land use, a median sized project was identified from actual projects permitted, as tracked by the Los Angeles Building Permit database described previously in this report. The project s actual number of stories and parking method were researched, and the project s floor area ratio (FAR) and parking ratios were estimated based on review of applicable zoning codes, resulting in a building description of each prototype. Land Costs For each land use and market condition, BAE reviewed available public appraisals (see Appendix C-8), and also interviewed numerous leading developers of commercial and residential projects currently active in Los Angeles. Construction Costs (Hard, Soft, and Financing) for each prototype, per square foot hard costs was estimated based on review of R.S. Means, a cost manual. Soft costs and financing costs were estimated based on industry standards and current interest rates. Rents For multifamily rental, all rents for that land use in buildings built in 2006 or later were analyzed to develop a 25, 50, and 75 th percent quartile rent assumption. Cap Rates For multifamily rental, both national and regional cap rates were compiled and variations by market area were researched based on developer interviews. The following two metrics were utilized to judge feasibility: Return on Total Development Cost (ROC) This metric divides profit by total development cost, to judge overall project feasibility. As described in the Commercial Feasibility analysis, this metric is similar to overall return on investment in short-term investment mechanisms such as corporate bonds. To test feasibility, this metric had to achieve at least a 15 percent return on cost including for the new affordable housing fee and the applicable school fee. This metric does not account for leverage, but a separate analysis of several of the pro formas prepared for this study indicated that in the event of a typical equity/debt configuration, this metric and the 15% ROC threshold should still enable sufficient return in equity to investors. Yield on Cost (YOC) This metric evaluates the annual stabilized Net Operating Income (NOI) compared to total development costs for multifamily rental housing projects only (not relevant in for-sale unit projects because these do not generate ongoing operating investment income). For the feasibility testing, based on developer interviews, multifamily rental housing was also assigned a minimum YOC threshold. Both ROC 71
142 and YOC thresholds had to be achieved to deem a project feasible with the total fees (e.g., new affordable fee + school fee). A summary of the pro forma findings is shown on the following page. Detailed pro formas are shown in the Appendix H It should be noted that although the single family detached prototype analyzed in this report is for a conventionally-sized lot, the City also has a small lot single family ordinance, which is coded in the building permit data as single family detached. Because this analysis and the proposed ordinance contemplates charging the fee through the building permit process, it does not separately analyze small lot single family detached products. 72

143 TABLE 25: SUMMARY OF RESIDENTIAL PRO FORMAS Low Market scenarios not shown here, due to limited feasibility when analyzed conservatively. Low scenario pro formas shown in Appendix H. 73
144 Step D: Comparison of Feasible Fee to Maximum Legal Fee The table below compares the feasible fees estimated above, to the maximum legal fees described in the previous chapter (based on nexus analysis of new worker households). As in most other cities in California, the gap between the dollars needed to fund affordable housing for new workers (e.g., maximum legal fee) and the feasible level of fee that can be absorbed by real estate market conditions, is substantial. In other words, charging a fee that would not constrain private sector development does not usually meet all subsidy needed to mitigate the costs of the affordable housing impacts generated by the new development. TABLE 26: COMPARISON OF RESIDENTIAL MAX LEGAL FEES TO FEASIBLE FEES Multifamily Rental Multifamily Condo Single Family Attached Single Family Detached Med High Med High Med High Med High Legal Fee (Max per Unit) $ 84,964 $ 84,964 $ 95,484 $ 95,484 $ 69,900 $ 69,900 $ 145,901 $ 145,901 Legal Fee (Max per Sq. Ft.) (a) $ $ $ $ $ $ $ $ Capped at Legal Max Feasible Fee Per Unit (b) (c) $ 23,805 $ 31,740 $ 37,571 $ 76,849 $ 42,900 $ 52,800 $ 93,000 $ 145,890 Feasible Fee Per Sq. Ft. (b) $ $ $ $ $ $ $ $ Feasible Fee as % of Legal Max 24.4% 32.5% 34.2% 70.0% 61.4% 75.5% 63.7% 100.0% a) Legal Max calculated per unit in nexus analysis. Converted here to per sq.ft. based on pro forma assumptions based on sales analysis of sq. ft. of homes sold. b) Current school fee and proposed Park fee is applied to project. Feasible Res Fee is after accounting for those costs. c) The feasible fee per unit was derived by taking the feasible fee per square foot multiplied by the gross residential square footage divided by the number of units. As a result, while the fee is presented on a per unit basis, it accounts for area within units and common area space. FIGURE 12: COMPARISON OF MAX RESIDENTIAL LEGAL FEES TO FEASIBLE FEES $84,964 $31,740 $23,805 $69,900 $52,800 $42,900 $93,000 $95,484 $76,849 $37,571 $145,901 $145,890 MULTIFAMILY RENTAL SINGLE FAMILY ATTACHED SINGLE FAMILY DETACHED MULTIFAMILY CONDOMINIUM Max Legal Fee High Market Max Feasible Med Market Max Feasible 74
145 Residential Fee Program Options & Estimated Revenues Similar to the commercial fees, there are several options the City could select to structure a market-rate residential fee program. The following presents four program options as examples. These options are then analyzed in order to estimate total annual fee revenues, along with two kinds of potential further adjustments to exempt certain projects. Option A: Match Fee to Market Conditions This option would create a fee schedule which charges feasible fees based on conservativelyestimated Medium Market Area conditions to new and rehabilitated projects in those areas, and feasible fees estimated for High Market Area conditions to those areas. Project fees in Low Market Areas would likely be waived. This option would create the most finely-tuned fee structure, but may create challenges to administer and would necessitate periodic updating to identify changing neighborhood market conditions and feasible fee levels. Option B: Charge Medium Market Fees to Both Medium and High Market Areas This would be a conservative option, charging the level of feasible fee derived from a Medium market area feasibility test, to all projects located in both Medium and High Market Areas. This approach would limit debate about whether an individual project is in a medium or high market area, charging the same fee per land use to all projects regardless of location. Due to the economics of Low Market areas, fees would likely not be charged in these exempt zones. This option would simplify fee administration, but may create an uneven burden on projects due to their location and subsequent economics. Option C: Charge Only High Market Areas This option would limit fees to only those projects located in premium, High Market Areas, where feasibility is most assured and development is least likely to be affected. Fees charged would be at the corresponding High Market levels. Projects in Medium and Low Market Areas would be waived based on their location. As market conditions change and are re-evaluated, neighborhoods may change from medium to high market conditions and become eligible for the fee schedule. This option would further simplify fee program administration, but may create debate over specific projects which have High Market characteristics and economics but be technically located in a Medium Market neighborhood (or vice-versa). 75
146 Option D: Charge Lowest Feasible Residential Fee Citywide (Flat Fee) In this option, the lowest feasible fee for the lowest residential land use in a Medium Market Area (e.g., multi-family rental) would be charged across all residential uses in all markets. The benefits of this option are that it establishes clarity, minimizes confusion and minimizes administrative functions. While this option would apply the fee to all projects, including those located in market conditions that the pro formas concluded may be infeasible, most new development projects occurring in the Low market conditions likely reflect improving submarket conditions not reflected in the broader three market segments analyzed in this report. The estimated annual revenues that could potentially be generated by the application of these fee program options are shown on the next page. Adjustment for Density Bonus Programs and 100 Percent Affordable Projects Due to the anticipated different treatment for both density bonus programs and 100 percent affordable projects (e.g., credit for affordable units provided directly in these cases; see next chapter), the revenue estimates exclude the square feet for these projects. Adjustment for Minimum Project Size Many cities exempt fees for smaller projects in order to encourage infill and accommodate small businesses. For this study, multifamily rental, multifamily condo, and single family attached projects with less than five units are analyzed as a potential exempt minimum project size (see footnote c on following table for historic distribution of residential projects by number of units in project). Single family detached units were assumed to not be subject to this exemption for revenue-estimating purposes. 76
147 TABLE 27: REVENUE ESTIMATES OF FEE PROGRAM OPTIONS, ANNUAL AVERAGE Estimates do not include possible exemptions and waivers under consideration, other than for project size, density bonus projects, & 100% affordable projects Option A - Match Fee to Market Conditions Low Market Medium Market High Market Low Feasible Med Feasible High Potential Max Max Annual Rev Adjusted for Fee per Sq. Annual Avg. Fee per Sq. Annual Avg. Feasible Fee Annual Avg. Annual Avg. Annual Minimum Project Use Ft. Sq. Ft. (a)(b) Ft. Sq. Ft. (a)(b) per Sq. Ft. Sq. Ft. (a)(b) Sq. Ft. Revenue Size (c) Multifamily Rental* $ - 1,216,635 $ ,838,784 $ ,618,450 7,673,869 $ 143,940,909 $ 135,304,454 Single Family Detached $ - 459,831 $ ,035,134 $ ,182,417 3,677,381 $ 138,220,057 $ 138,220,057 Single Family Attatched $ - 167,954 $ ,783 $ , ,956 $ 3,875,358 $ 3,875,358 Multifamily Condominium $ - 31,942 $ ,758 $ , ,485 $ 9,092,010 $ 6,000,726 Total 1,876,362 2,979,458 7,070,871 11,926,691 $ 295,128,333 $ 283,400,595 * Multifamily Rental sq.ft. is net of density bonus & 100% aff projects. Total Option B - Medium Market Fees Applied to Both Med & High Zones Low Market Medium Market High Market Total Low Feasible Med Feasible Med Feasible Potential Max Max Annual Rev Adjusted for Fee per Sq. Annual Avg. Fee per Sq. Annual Avg. Fee per Sq. Annual Avg. Annual Avg. Annual Minimum Project Use Ft. Sq. Ft. (a)(b) Ft. Sq. Ft. (a)(b) Ft. Sq. Ft. (a)(b) Sq. Ft. Revenue Size (c) Multifamily Rental* $ - 1,216,635 $ ,838,784 $ ,618,450 7,673,869 $ 116,230,209 $ 109,256,396 Single Family Detached $ - 459,831 $ ,035,134 $ ,182,417 3,677,381 $ 99,744,053 $ 99,744,053 Single Family Attatched $ - 167,954 $ ,783 $ , ,956 $ 3,172,045 $ 3,172,045 Multifamily Condominium $ - 31,942 $ ,758 $ , ,485 $ 5,577,951 $ 3,681,448 Total 1,876,362 2,979,458 7,070,871 11,926,691 $ 224,724,258 $ 215,853,942 * Multifamily Rental sq.ft. is net of density bonus & 100% aff projects. Option C - Fee in High Market Zones Only Low Market Medium Market High Market Total Low Feasible Med Feasible High Potential Max Max Annual Rev Adjusted for Fee per Sq. Annual Avg. Fee per Sq. Annual Avg. Feasible Fee Annual Avg. Annual Avg. Annual Minimum Project Use Ft. Sq. Ft. (a)(b) Ft. Sq. Ft. (a)(b) per Sq. Ft. Sq. Ft. (a)(b) Sq. Ft. Revenue Size (c) Multifamily Rental* $ - 1,216,635 $ - 1,838,784 $ ,618,450 7,673,869 $ 110,842,800 $ 104,192,232 Single Family Detached $ - 459,831 $ - 1,035,134 $ ,182,417 3,677,381 $ 106,130,917 $ 106,130,917 Single Family Attatched $ - 167,954 $ - 4,783 $ , ,956 $ 3,751,005 $ 3,751,005 Multifamily Condominium $ - 31,942 $ - 100,758 $ , ,485 $ 6,875,331 $ 4,537,719 Total 1,876,362 2,979,458 7,070,871 11,926,691 $ 227,600,053 $ 218,611,873 * Multifamily Rental sq.ft. is net of density bonus & 100% aff projects. Option D - Lowest Residential Feasible Fee Charged Citywide Low Market Medium Market High Market Lowest Fee Annual Avg. Lowest Fee Annual Avg. Lowest Fee Annual Avg. Annual Avg. Use per Sq. Ft. Sq. Ft. (a)(b) per Sq. Ft. Sq. Ft. (a)(b) per Sq. Ft. Sq. Ft. (a)(b) Sq. Ft. Multifamily Rental* $ ,216,635 $ ,838,784 $ ,618,450 7,673,869 $ 138,129,638 $ 129,841,860 Single Family Detached $ ,831 $ ,035,134 $ ,182,417 3,677,381 $ 66,192,865 $ 66,192,865 Single Family Attatched $ ,954 $ ,783 $ , ,956 $ 5,219,208 $ 5,219,208 Multifamily Condominium $ ,942 $ ,758 $ , ,485 5,138,730 $ 3,391,562 Total 1,876,362 2,979,458 7,070,871 11,926,691 $ 214,680,442 $ 204,645,495 * Multifamily Rental sq.ft. is net of density bonus & 100% aff projects. Total Potential Max Annual Revenue Max Annual Rev Adjusted for Minimum Project Size (c) Notes: a) Sq.Ft. for each land use based on avg. annual permit data adjusted to waive density bonus & 100% aff projects, as follows: Annual Average Units in Density Bonus Projects 100% Affordable Projects Units Built Net of Density Bonus & Affordable All Units Total Sq. Ft. Net Sq. Ft. Built Built Built Multifamily Rental 8,268 9,791,525 1, ,480 7,673,869 Single Family Detached 990 3,677, ,677,381 Single Family Attached , ,956 Multifamily Condominium , ,485 Total 9,524 14,044,347 1, ,736 11,926,691 b) Allocation of Sq. Ft. per Market Area category- based on geocoding of all permits excluding density bonus and 100% affordable projects: % Sq.Ft. in % Sq.Ft. in % Sq.Ft. in Low Markets Med Markets High Multifamily Rental 15.9% 24.0% 60.2% Single Family Detached 12.5% 28.1% 59.3% Single Family Attached 57.9% 1.6% 40.4% Multifamily Condominium 11.2% 35.3% 53.5% c) Adjusted for minimum project size (5+ units) Below Min Above Min Project Size Project Size Multifamily Rental 6% 94% Single Family Detached NA NA Single Family Attached 0% 100% 77 Multifamily Condominium 34% 66%
 currently charge a range")


148 Also similar to the commercial fee revenue estimates, two Specific Plans (West Los Angeles and the Coastal Transportation Corridor) currently charge a range of TIA fees and both have been proposed for increases in these fees. The map below shows the location of the TIAs and following pages show the effect of incorporating these proposed fees and charging a net feasible fee for affordable housing in those two Specific Plan areas. FIGURE 13: RESIDENTIAL MARKET AREAS AND TIAS 78
149 TABLE 28: RESIDENTIAL ESTIMATE FEE REVENUES WITH TIA ADJUSTMENTS Estimates do not incorporate exemptions and waivers under consideration other than density bonus projects & 100% affordable projects. Option A - Citywide Fee Per Market Area Zones Low Market Medium Market High Market Total Med Feasible Low Feasible Annual Avg. Sq. Fee per Sq. Annual Avg. High Feasible Annual Avg. Annual Avg. Potential Max Use Fee per Sq. Ft. Ft. (a)(b) Ft. Sq. Ft. (a)(b) Fee per Sq. Ft. Sq. Ft. (a)(b) Sq. Ft. Annual Revenue Multifamily Rental* outside TIAs $ - 1,216,635 $ ,838,784 $ ,851,063 6,906,482 $ 125,523,623 Multifamily Rental* in TIAs $ - 0 $ $ , ,387 $ 14,932,681 Single Family Detached outside TIAs $ - 459,831 $ ,020,424 $ ,719,066 3,199,322 $ 115,231,348 Single Family Detached in TIAs $ - 0 $ ,710 $ , ,060 $ 20,425,440 Single Family Attatched outside TIAs $ - 167,954 $ ,783 $ , ,705 $ 2,075,311 Single Family Attatched in TIAs $ - 0 $ $ ,251 56,251 $ 1,560,620 Multifamily Condominium outside TIAs $ - 31,942 $ ,911 $ , ,688 $ 6,021,618 Multifamily Condominium in TIAs $ - 0 $ ,847 $ ,950 74,797 $ 2,716,654 Total 1,876,362 2,979,458 7,070,871 11,926, ,487,297 Option B - Citywide Fee with Med Fee Applied to Both Med & High Zones Low Market Medium Market High Market Total Med Feasible Low Feasible Annual Avg. Sq. Fee per Sq. Annual Avg. Med Feasible Annual Avg. Annual Avg. Potential Max Use Fee per Sq. Ft. Ft. (a)(b) Ft. Sq. Ft. (a)(b) Fee per Sq. Ft. Sq. Ft. (a)(b) Sq. Ft. Annual Revenue Multifamily Rental* outside TIAs $ - 1,216,635 $ ,838,784 $ ,851,063 6,906,482 $ 102,417,245 Multifamily Rental* in TIAs $ - 0 $ $ , ,387 $ 10,328,360 Single Family Detached outside TIAs $ - 459,831 $ ,020,424 $ ,719,066 3,199,322 $ 84,924,206 Single Family Detached in TIAs $ - 0 $ ,710 $ , ,060 $ 12,256,578 Single Family Attatched outside TIAs $ - 167,954 $ ,783 $ , ,705 $ 1,709,507 Single Family Attatched in TIAs $ - 0 $ $ ,251 56,251 $ 1,223,111 Multifamily Condominium outside TIAs $ - 31,942 $ ,911 $ , ,688 $ 3,932,416 Multifamily Condominium in TIAs $ - 0 $ ,847 $ ,950 74,797 $ 1,291,798 Total 1,876,362 2,979,458 7,070,871 11,926, ,083,221 Option C - Fee in High Market Zones Only Low Market Medium Market High Market Total Med Feasible Low Feasible Annual Avg. Sq. Fee per Sq. Annual Avg. High Feasible Annual Avg. Annual Avg. Potential Max Use Fee per Sq. Ft. Ft. (a)(b) Ft. Sq. Ft. (a)(b) Fee per Sq. Ft. Sq. Ft. (a)(b) Sq. Ft. Annual Revenue Multifamily Rental* outside TIAs $ - 1,216,635 $ - 1,838,784 $ ,851,063 6,906,482 $ 92,425,515 Multifamily Rental* in TIAs $ - 0 $ - 0 $ , ,387 $ 14,932,681 Single Family Detached outside TIAs $ - 459,831 $ - 1,020,424 $ ,719,066 3,199,322 $ 83,598,204 Single Family Detached in TIAs $ - 0 $ - 14,710 $ , ,060 $ 20,048,314 Single Family Attatched outside TIAs $ - 167,954 $ - 4,783 $ , ,705 $ 1,950,959 Single Family Attatched in TIAs $ - 0 $ - 0 $ ,251 56,251 $ 1,560,620 Multifamily Condominium outside TIAs $ - 31,942 $ - 87,911 $ , ,688 $ 4,087,570 Multifamily Condominium in TIAs $ - 0 $ - 12,847 $ ,950 74,797 $ 2,494,780 Total 1,876,362 2,979,458 7,070,871 11,926, ,098,643 * Multifamily Rental sq.ft. is net of density bonus & 100% aff projects. Option D would not be affected by the presence of TIAs. Footnotes shown on next page 79
150 Notes: a) Sq.Ft. for each land use based on avg. annual permit data adjusted to waive density bonus & 100% aff projects, as follows: Annual Average Units in Density Bonus Projects 100% Affordable Projects Units Built Net of Density Bonus & Affordable All Units Built Total Sq. Ft. Built Net Sq. Ft. Built Multifamily Rental 8,268 9,791,525 1, ,480 7,673,869 Single Family Detached 990 3,677, ,677,381 Single Family Attached , ,956 Multifamily Condominium , ,485 Total 9,524 14,044,347 1, ,736 11,926,691 b) Allocation of Sq. Ft. per Market Area category- based on geocoding of all permits excluding density bonus and 100% affordable projects: % Sq.Ft. in % Sq.Ft. in Med % Sq.Ft. in Low Markets Markets High Markets Multifamily Rental 15.9% 24.0% 60.2% Single Family Detached 12.5% 28.1% 59.3% Single Family Attached 57.9% 1.6% 40.4% Multifamily Condominium 11.2% 35.3% 53.5% c) Adjusted for minimum project size (5+ units) Below Min Project Size Above Min Project Size Multifamily Rental 6% 94% Single Family Detached 68% 32% Single Family Attached 0% 100% Multifamily Condominium 34% 66% d) Figures overestimate revenue if TIA fees are accounted for in two specific plan aras where TIA fees are charged. The highlighted figures represent the maximum fee for each prototype, which are used in the above calculation. The proposed TIA fees are (fees per unit converted to square foot fees based on unit sizes used for the pro forma analysis): Proposed TIA Fees Max Supportabe Fee - Medium Max Supportabe Fee - High West LA CTCSP West LA CTCSP West LA CTCSP Multifamily Rental $ 4.54 $ 4.04 $ $ $ $ Single Family Detached $ 3.31 $ 5.36 $ $ $ $ Single Family Attached $ 4.26 $ 3.79 $ $ $ $ Multifamily Condominium $ 4.73 $ 4.21 $ $ $ $ Allocation of Sq. Ft. per Market Area category within TIAs % Units in Low % of Units in Med % of Units in High Total Activity in TIAs Multifamily Rental 0.0% 0.0% 10.0% 10.0% Single Family Detached 0.0% 0.4% 12.6% 13.0% Single Family Attached 0.0% 0.0% 19.4% 19.4% Multifamily Condominium 0.0% 4.5% 21.7% 26.2% 80
151 In summary, the range of fee program options and their associated revenues for an average year are as follows: FIGURE 14: ESTIMATE OF POTENTIAL ANNUAL RESIDENTIAL FEE REVENUE Potential Max Rev Before Adjustments Max Annual Revenue Ajdusted for Min Project Size Max Annual Revenue Adjusted for TIA Fees 0 $295,128,333 $283,400,595 $288,487,297 $224,724,258 $215,853,942 $218,083,221 $227,600,053 $218,611,873 $221,098,643 $214,680,442 $204,645,495 OPTION A: MATCH FEE TO MARKET ZONE OPTION B: MEDIUM FEE APPLIED TO BOTH MED AND HIGH MARKET ZONES OPTION C: FEE IN HIGH ZONES ONLY OPTION D: LOWEST FEASIBLE FEE CITYWIDE (FLAT FEE) 81
152 Considerations for Implementation Fees by Geographic Area Similar to the commercial fee discussion of implementation earlier in this report, the City of Los Angeles could adopt a market-rate residential fee schedule which varies the required fee by geographic area, as related to market condition. Further variations of this approach, which would match the feasible fee to the geographic area, are then possible to structure. Phase-In of Fee Schedule A key component of adopting a commercial fee in Los Angeles will be the phase-in schedule. Most notably, most cities when first adopting a fee like this, set a future date for its implementation, and also define and waive current pipeline projects which would have been started without knowledge of this fee. Moreover, to mitigate the initial perceived shock to the system of a new residential fee, a phase-in schedule would help to mitigate this risk. For these reasons, it is recommended that if Los Angeles adopts a residential fee program, it should consider a two-year phased-in schedule when initially implemented. The fee schedule, for example, could be set at half of the full fee for the first year of applicability, rising to the full 100 percent of the fee on projects seeking building permits 12 months later and beyond. Fee Exemptions and Waivers As profiled in the case studies of commercial fees, other cities in California have variable approaches to making categories of land use either exempt from residential fees or waiving fees under certain conditions. Fee Exemptions This study was conducted assuming that 100 percent affordable housing projects residential projects would be exempt from residential fees since affordable housing is being provided. Los Angeles could also exempt projects smaller than a certain size threshold, as discussed earlier in this study. Fee Waivers The next chapter explores the Los Angeles Density Bonus Program, which involves market-rate residential projects incorporating affordable units in exchange for additional allowable floor area ratio (FAR) in conformance with state law. This program means that these projects are already providing affordable units within the same project, although the levels of required affordable units to achieve FAR increases are lower than the nexus study levels of affordable housing need identified as generated from current market rate projects. The revenue estimates for the residential fee included an example adjustment that can also be built into the regulations for Transportation Investment Areas (TIAs), which are currently applicable only to the Specific Plans for West Los Angeles and the Coastal Transportation 82
153 Corridor. In the even other areas of Los Angeles have the eventual need to adopt area transportation impact fees, the residential fee could be partially waived (reduced) to accommodate those other fees. Another kind of waiver could be considered in cases where developers are applying to build inexpensive market rate homes in Low or Medium market areas on small lots (can be attached or detached units); these units are typically built with inexpensive finishes and sold at relatively inexpensive sale prices. Analysis for this report, and discussions with builders of these products, indicated concern for the ability to absorb a linkage fee and still provide this type of unit. If such units were sold at prices that served a policy objective (such as ownership housing serving 110 percent AMI households), a reduction or waiver in the fee may help limit this type of potential overlap between policy objectives. Finally, most cities allow for a waiver request if a) economic hardship can be demonstrated or b) if lesser affordable housing job impacts can be demonstrated. Excluding the issue of the planned increase in minimum wage, it is recommended that these two options be narrowly allowed per legal requirements, but not more broadly offered, to minimize administrative burden on staff. Timing of Fee Calculation and Payment As profiled in the case studies, most cities charge the residential fee prior to or at the time of building permit issuance. Several cities split up the payments, allowing for partial payment later (at Certificate of Occupancy), while a few cities spread payments even farther apart over time, allowing for essentially a payment plan or the choice of an upfront net present value payment of the entire amount. For several reasons, it is recommended that for the City of Los Angeles, the fee payment be split only into at most, two equal installments at the time of building permit issuance and at the time of Certificate of Occupancy. This recommendation is made at this limited level, due to the overarching immediate need to create a permanent source of funding for affordable housing. 83
154 Additional Considerations Effect of Los Angeles Minimum Wage Phase-In Schedule In 2015, the Los Angeles City Council passed a City Minimum Wage Ordinance that will increase the minimum wage to $15 per hour for all employers in the City, with increases in the minimum wage phased in between 2016 and Employers with more than 25 employees will be required to reach the $15 minimum wage by 2020, while some nonprofit organizations and employers with 25 or fewer employees are eligible to receive an additional year to reach the $15 minimum wage. This section provides an analysis of the potential impact of the City s minimum wage ordinance on the legal maximum commercial linkage and affordable housing impact fee calculations presented in the preceding sections of this report. Methodology BAE analyzed the potential impacts of the increase in the minimum wage by determining the household AMI levels for workers that will earn the new minimum wage and adjusting the household income distribution among the workers generated by each residential or commercial land use type accordingly. BAE then re-calculated the maximum fee based on the adjusted household income distribution. This section provides an overview of the methodology used to analyze the potential impacts of the minimum wage ordinance on the maximum legal fee calculations. Calculation tables and additional detail about the methodology used in this analysis are shown in Appendix E. Step 1: Determine the AMI band for households at the new minimum wage. The $15 per hour minimum wage that will apply to most employers in 2020 is equivalent to an estimated wage of $13.33 per hour in 2016 dollars, translating to an annual income equal to approximately $27,700 for a full-time employee. Assuming 1.77 workers per worker household, the estimated annual household income for an employee working full time at minimum wage would be approximately $48,900. According to 2016 HCD income limits for a household in Los Angeles County, a household earning an income of $48,900 falls within the low-income AMI band for two- to five-person households. Step 2: Adjust the household income distribution for workers generated by new development. Based on the findings from Step 1, all worker households that fall into the extremely low- or very low-income AMI bands under current minimum wage requirements would fall into the lowincome AMI band following an increase in the minimum wage to $15 in For each residential product type and commercial land use analyzed in the preceding maximum fee calculations, the household income distribution among worker households was adjusted by moving all extremely low- and very low-income households into the low-income AMI band. 84
155 Step 3: Re-calculate the maximum legal fees using the adjusted AMI distributions. Step 2 results in an income distribution that shows a reduction in extremely low- and very low-income households (to zero) and a commensurate increase in low-income households. Since the subsidy gap for low-income units is smaller than the subsidy gap for extremely low- or very lowincome units, the cost associated with providing housing for households below the moderate income level decreases somewhat as extremely low- and very low-income households shift to become low-income households. The reduced cost of providing affordable housing translates directly to a lower maximum legal fee due to the increase in the minimum wage. Findings The increase in the City of Los Angeles minimum wage is not expected to impact the recommended fee rates, despite anticipated reductions in the maximum legal fees. Although the increase in the minimum wage will decrease the maximum legal commercial linkage fee, the maximum legal fee will still be higher than the anticipated fee rate. As shown in Error! Reference source not found., the planned increase in the minimum wage will decrease the maximum legal fee for each of the eight commercial land uses, resulting in maximum legal fees that range from approximately $100 per square foot to $261 per square foot, depending on the specific use. These lower maximum legal fees are nonetheless significantly higher than the feasible fee rates and the fees likely to be adopted by the City. In the event that the City adopts fee rates that are higher than those shown in the table below, it may necessary for the City to revisit the fee rates following implementation of the minimum wage increase. TABLE 29: MAXIMUM LEGAL COMMERCIAL FEE, FUTURE MINIMUM WAGE Hotel/ Office Retail Industrial Motel Warehouse Hospital Institutional Maximum Legal Fee (per sq. ft.) With Current (2016) Minimum Wage $248 $309 $131 $133 $118 $196 $197 With Increased Minimum Wage in 2020 $213 $261 $112 $114 $100 $169 $168 Note: See detailed calculations in Appendix I. Source: BAE, Similarly, the increase in the minimum wage will decrease the maximum legal affordable housing impact fee, though not below the anticipated fee rates. As shown in Error! Reference source not found., the planned increase in the minimum wage will decrease the maximum legal fee for each of the four residential product types, resulting in maximum legal fees that range from approximately $59,600 per unit to $124,300 per unit. However, the maximum legal fees will remain higher than the fee rates likely to be adopted by the City. In the event that the City adopts fee rates that are higher than those shown in the table below, it may necessary for the City to revisit the fee rates following implementation of the minimum wage increase. 85
156 TABLE 30: MAXIMUM LEGAL HOUSING FEE UNDER FUTURE MINIMUM WAGE REQUIREMENTS Multifamily Single-Family Single-Family Rental Condominium Attached Detached Maximum Legal Fee (per unit) With Current (2016) Minimum Wage $84,964 $95,484 $69,900 $145,901 With Increased Minimum Wage in 2020 $72,437 $81,385 $59,578 $124,339 Note: See detailed calculations in Appendix I. Source: BAE, Option to Provide On-Site Units Many cities with market-rate housing fees provide the option to developers to waive these fees if on-site affordable units are provided instead. This section calculates the proportion of affordable units that would need to be provided on-site for this option, and is based on the analysis of affordable housing need generated by new market-rate units in Los Angeles, as previously presented in shown in Table 24. Table 31 shows the proportion of units that would be required to fully address the need for affordable units generated by market-rate units on site in mixed-income developments. This analysis uses the base 100 market-rate units in each of the development prototypes that were identified in the maximum fee calculations shown in this report, and adds the affordable unit need generated by these market-rate units to the project in order to demonstrate the number of units and income mix needed to address this need on site. For example, the figures in Table 24 show that 100 units of market-rate multifamily rental housing generate a need for 22.8 affordable units. The figures in Table 31 therefore assume a hypothetical unit project comprised of 100 market-rate units and the 22.8 affordable units that are needed to address the affordable housing impacts of the market-rate units on site. The figures in Table 31 then calculate the numerical proportion of the total unit project that would be comprised of units at each affordability level. Table 31 also provides a weighting of the proportion of units at each affordability level to convert the entire need into units that serve each affordability level in order to estimate the number of units that would need to be provided on site at a single affordability level. As shown, the estimated proportions at single affordability levels are as follows: Multifamily Rental: 11 percent at extremely-low income, 18 percent at very-low income, 29 percent at low-income, or 44 percent at moderate income. Condominiums: 12 percent at extremely-low income, 20 percent at very-low income, 32 percent at low-income, or 48 percent at moderate income. Single-Family Attached: nine percent at extremely-low income, 15 percent at very-low income, 25 percent at low-income, or 37 percent at moderate income. 86
157 Single-Family Detached: 17 percent at extremely-low income, 28 percent at very-low income, 44 percent at low-income, or 66 percent at moderate income. TABLE 31: ON-SITE UNITS NEEDED TO MITIGATE MARKET-RATE UNITS IMPACT Affordable Units Market- Total Multifamily Rental ELI VLI LI Mod Total Rate Project (a) Number of Units (b) Percent of Total Project 5.0% 4.9% 6.5% 2.1% 18.5% 81.5% 100.0% Percent of Total - Weighted to ELI (c) 10.9% 0.0% 0.0% 0.0% 10.9% 89.1% 100.0% Percent of Total - Weighted to VLI (c) 0.0% 18.2% 0.0% 0.0% 18.2% 81.8% 100.0% Percent of Total - Weighted to LI (c) 0.0% 0.0% 29.1% 0.0% 29.1% 70.9% 100.0% Percent of Total - Weighted to Mod (c) 0.0% 0.0% 0.0% 43.6% 43.6% 56.4% 100.0% Condominiums Number of Units (b) Percent of Total Project 5.5% 5.4% 7.1% 2.3% 20.4% 79.6% 100.0% Percent of Total - Weighted to ELI (c) 12.0% 0.0% 0.0% 0.0% 12.0% 88.0% 100.0% Percent of Total - Weighted to VLI (c) 0.0% 20.0% 0.0% 0.0% 20.0% 80.0% 100.0% Percent of Total - Weighted to LI (c) 0.0% 0.0% 32.0% 0.0% 32.0% 68.0% 100.0% Percent of Total - Weighted to Mod (c) 0.0% 0.0% 0.0% 48.0% 48.0% 52.0% 100.0% Single-Family Attached Number of Units (b) Percent of Total Project 4.2% 4.2% 5.5% 1.8% 15.8% 84.2% 100.0% Percent of Total - Weighted to ELI (c) 9.3% 0.0% 0.0% 0.0% 9.3% 90.7% 100.0% Percent of Total - Weighted to VLI (c) 0.0% 15.5% 0.0% 0.0% 15.5% 84.5% 100.0% Percent of Total - Weighted to LI (c) 0.0% 0.0% 24.8% 0.0% 24.8% 75.2% 100.0% Percent of Total - Weighted to Mod (c) 0.0% 0.0% 0.0% 37.1% 37.1% 62.9% 100.0% Single-Family Detached Number of Units (b) Percent of Total Project 7.6% 7.5% 9.8% 3.2% 28.1% 71.9% 100.0% Percent of Total - Weighted to ELI (c) 16.5% 0.0% 0.0% 0.0% 16.5% 83.5% 100.0% Percent of Total - Weighted to VLI (c) 0.0% 27.6% 0.0% 0.0% 27.6% 72.4% 100.0% Percent of Total - Weighted to LI (c) 0.0% 0.0% 44.1% 0.0% 44.1% 55.9% 100.0% Percent of Total - Weighted to Mod (c) 0.0% 0.0% 0.0% 66.2% 66.2% 33.8% 100.0% Weighting Factors AMI Levels 30% 50% 80% 120% Weighting Factors - to ELI Units (d) Weighting Factors - to VLI Units (d) Weighting Factors - to LI Units (d) Weighting Factors - to Mod Units (d) Notes: (a) "Total Project" includes all 100 market-rate units in the sample project plus the affordable housing need generated by these 100 units. (b) From Table 24. (c) Weighting to income levels represents a conversion of the percent of affordable units by AMI level into a single AMI band, based on the weighting factors shown in the table and described in footnote (d). (d) Weighting factor = (%AMI threshold units are weighted to)/(% AMI threshold of weighted unit type). For example, the weighting factor to convert VLI units into LI units = 80%/50%, since 80% is the AMI level for LI units and 50% is the AMI level for VLI units. Source: BAE,
158 Voluntary Density Bonus vs. Market-Rate Housing Fee This section provides an overview of the use of the California State Bonus Law in the City of Los Angeles, compares the outcomes from the Density Bonus to the potential outcomes of the market-rate housing fee analyzed in this study, and provides a policy options for the implementation of the market-rate housing fee in combination with the State Density Bonus. California Density Bonus Overview The California State Density Bonus Law (California Government Code Sections through 65918) entitles developers to certain development incentives for projects that include a prescribed amount of affordable housing. For developers, the State Density Bonus Law is a voluntary, incentive-based program, which allows developers to opt in on a project-by-project basis in exchange for incentives. All cities in California are mandated by State Law to adopt the State Density Bonus. Depending on the share of affordable units provided, development incentives under the State Density Bonus Law include up to a 35 percent increase in density over the density otherwise allowed on the project site. Projects in which at least 10 percent of units are affordable to lowincome households or five percent of units are affordable to very low income households are eligible for a 20 percent density bonus, while projects with higher proportions of affordable units are eligible for larger density bonuses. In addition, condominium developments, planned developments, and stock cooperatives are eligible for a five percent density bonus if at least ten percent of units are moderate-income units, with density bonuses up to 35 percent for larger proportions of moderate-income units. 88
159 TABLE 32: CALIFORNIA STATE DENSITY BONUS PROVISIONS Density Bonus by Affordability Level Affordable Unit Very Low Low Income Moderate Percentage (a) Income Units Units Income Units 5% 20.0% N/A N/A 6% 22.5% N/A N/A 7% 25.0% N/A N/A 8% 27.5% N/A N/A 9% 30.0% N/A N/A 10% 32.5% 20.0% 5.0% 11% 35.0% 21.5% 6.0% 12% 35.0% 23.0% 7.0% 13% 35.0% 24.5% 8.0% 14% 35.0% 26.0% 9.0% 15% 35.0% 27.5% 10.0% 16% 35.0% 29.0% 11.0% 17% 35.0% 30.5% 12.0% 18% 35.0% 32.0% 13.0% 19% 35.0% 33.5% 14.0% 20% 35.0% 35.0% 15.0% 21% 35.0% 35.0% 16.0% 22% 35.0% 35.0% 17.0% 23% 35.0% 35.0% 18.0% 24% 35.0% 35.0% 19.0% 25% 35.0% 35.0% 20.0% 26% 35.0% 35.0% 21.0% 27% 35.0% 35.0% 22.0% 28% 35.0% 35.0% 23.0% 29% 35.0% 35.0% 24.0% 30% 35.0% 35.0% 25.0% 31% 35.0% 35.0% 26.0% 32% 35.0% 35.0% 27.0% 33% 35.0% 35.0% 28.0% 34% 35.0% 35.0% 29.0% 35% 35.0% 35.0% 30.0% 36% 35.0% 35.0% 31.0% 37% 35.0% 35.0% 32.0% 38% 35.0% 35.0% 33.0% 39% 35.0% 35.0% 34.0% 40% 35.0% 35.0% 35.0% Note: (a) Affordable unit percentage applies the base (i.e., without density bonus) density. Calculation of the share of affordable units is conducted before adding market-rate units added by the density bonus. Sources: CA Government Code Sections ; BAE, Use of State Density Bonus in Los Angeles Use of the density bonus is fairly common among recent residential developments in Los Angeles. Between 2011 and 2015, 7,915 market-rate and affordable units were developed in density bonus projects in Los Angeles, accounting for 17 percent of all units built in the City, as shown in Table 33, not including 100 percent affordable developments that received a density bonus. Of this total, 683 units in density bonus projects were very low-, low-, or moderateincome units, a number equal to nine percent of the total number of market-rate units in density bonus projects. 89
160 Among multifamily rental developments, 6,722 market-rate and affordable units were in projects that received a density bonus between 2011 and 2015, amounting to 16 percent of multifamily rental units permitted in Los Angeles during this period. Multifamily rental developments that received a density bonus generated 585 affordable units, a number equivalent to 10 percent of the number of market-rate units in density bonus projects. Condominium developments that received a density bonus between 2011 and 2015 included 1,193 market-rate and affordable units, comprising 19 percent of all units in the City during the same period. Density bonus projects produced 98 affordable for-sale units, a number equal to nine percent of all units in density bonus projects. TABLE 33: UNITS IN DENSITY BONUS PROJECTS, CITY OF LOS ANGELES, Multifamily Rental Condominium Total Very Low (AMI up to 50%) Low (AMI 50%-80%) Moderate (AMI 80%-120%) Affordable Unit Total Market-Rate Units in Density Bonus Projects 6,137 1,095 7,232 Total Units in Density Bonus Projects 6,722 1,193 7,915 Affordable Units as a % of Market-Rate Units in Density Bonus Projects 9.5% 8.9% 9.4% Total Units Permitted in City (Density Bonus Projects + Other Projects) 41,341 6,280 47,621 Units in Density Bonus Projects as a Share of All Units Permitted 16.3% 19.0% 16.6% Note: Figures exclude projects that are comprised only of affordable units. Sources: City of Los Angeles, ; BAE, Comparison of Density Bonus to Market-Rate Housing Fee On a project-by-project basis, the density bonus does not generate enough units to meet the affordable housing need generated by the market-rate units in density bonus projects. As detailed in the section of this report that shows the maximum market-rate housing fee calculations and shown in Table 34 below, 100 units of market-rate multifamily housing generates a need for 22.8 affordable units. Mixed-income (i.e., not 100 percent affordable) density bonus projects built in Los Angeles between 2011 and 2015 produced 9.5 affordable multifamily rental units for each 100 units of market-rate multifamily rental housing, falling 13.2 units short of the need. Similarly, 100 market-rate condominium units generate a need 90
161 for 25.6 affordable units, while condominium projects that receive a density bonus generated 8.9 affordable units per 100 market-rate units between 2011 and TABLE 34: COMPARISON OF DENSITY BONUS OUTCOMES TO HOUSING FEE OUTCOMES Multifamily Shortfall of Density Bonus Program in Mitigating Affordable Housing Impacts Rental Condominium Affordable Housing Need Generated by 100 Market-Rate Units (a) Affordable Units per 100 Market-Rate Units in Density Bonus Projects (b) Shortfall using Density Bonus Program Shortfall of Fee Program in Mitigating Affordable Housing Impacts Affordable Housing Need Generated by 100 Market-Rate Units (a) Maximum Legal Market-Rate Housing Fee (per unit) (c) $84,964 $95,484 Recommended Market-Rate Housing Fee (per unit) (d) Medium Market $23,805 $37,571 High Market $31,740 $76,849 Recommended Fee as a % of Maximum Legal Fee Medium Market 28.0% 39.3% High Market 37.4% 80.5% Affordable Units from Fees from 100 Market-Rate Units (e) Medium Market High Market Shortfall using Fee Program Medium Market High Market Notes: (a) Affordable housing need from maximum fee calculations presented in a preceding section of this report. (b) Based on the data in Table 29 above. (c) Maximum legal fee from the maximum fee calculations presented in a preceding section of this report. (d) Recommended fee from the analysis presented in a preceding section of this report. (e) Affordable Housing Need Generated by 100 Market-Rate Units x Recommended Fee as a % of Maximum Legal Fee. This represents the amount of affordable housing need that could be addressed by fees from 100 market-rate units. Source: BAE, Application of Fee Program to Density Bonus Projects The City of Los Angeles can elect to charge market-rate housing fees on the market-rate units in density bonus projects. As discussed above, the City may choose to waive market-rate housing fees on projects in which a defined proportion of units are affordable to lower-income households, which could include density bonus projects that meet the designated affordability threshold. Table 35 below compares the proportion of affordable units in density bonus projects to the proportions needed to fully address the need generated by market-rate units on site, as shown in Table 31 above. The figures in Table 35 demonstrate that, with the exception of singlefamily attached projects, density bonus projects providing the minimum number of units necessary to receive the maximum density bonus under State Law result in fewer affordable units than needed to fully address the need for affordable units within the development. 17 The historic yield of affordable units in density bonus projects is used here, because the state density bonus program allows a range of affordable units, starting at 5 percent. Thus, actual choices made and units produced, is the best indicator of expected future production of affordable housing using the bonus program. 91
162 These figures indicate that the City could provide market-rate housing fee waivers for residential developments that provide a larger share of affordable units than the State Density Bonus Law addresses. This could incentivize the provision of a larger number of affordable units on site and provide flexibility for developers that may elect to provide additional affordable units in exchange for a fee waiver. TABLE 35: AFFORDABLE HOUSING YIELD FROM UNITS ON SITE Affordable Units Market-Rate Units Total Very Low Income VLI LI Mod Total Base Bonus Total Project Number of Units in Density Bonus Project (a) Percent of Total in Density Bonus Project 8.1% 0.0% 0.0% 8.1% 65.9% 25.9% 91.9% 100.0% Percent of Total to Address Need (b) 18.2% 0.0% 0.0% 18.2% 81.8% 0.0% 81.8% 100.0% Low Income Number of Units in Density Bonus Project (a) Percent of Total in Density Bonus Project 0.0% 14.8% 0.0% 14.8% 59.3% 25.9% 85.2% 100.0% Percent of Total to Address Need (b) 0.0% 29.1% 0.0% 29.1% 70.9% 0.0% 70.9% 100.0% Moderate Income Number of Units in Density Bonus Project (a) Percent of Total in Density Bonus Project 0.0% 0.0% 29.6% 29.6% 44.4% 25.9% 70.4% 100.0% Percent of Total to Address Need - Condo (b) 0.0% 0.0% 48.0% 48.0% 52.0% 0.0% 52.0% 100.0% Percent of Total to Address Need - SFA (b) 0.0% 0.0% 37.1% 37.1% 62.9% 0.0% 62.9% 100.0% Percent of Total to Address Need - SFD (b) 0.0% 0.0% 66.2% 66.2% 33.8% 0.0% 33.8% 100.0% Notes: (a) Assumes the minimum proportion of affordable units necessary to receive the maximum density bonus under State law. (b) See Table 31 and accompnaying text. Percentages for multifamily rental units used for projects with very low income or low income units. Percentages for for-sale unit types used for projects with moderate income units. Source: BAE,
163 Appendix A: Commercial Fee Case Studies The following profiles commercial linkage fee programs established in cities throughout California. First, larger cities programs are summarized, including San Francisco, Sacramento, Oakland, and San Diego. Next, several smaller cities located near Los Angeles are profiled to provide context for more localized real estate economics and policy considerations. It should be noted that these profiles are not exhaustive; numerous other smaller cities in California have adopted or are currently considering adopting commercial impact fees for affordable housing. However, given the large size of the City of Los Angeles, but with real estate markets specific to its economic base, this chapter seeks to profile both large city experiences along with smaller cities nearby facing similar affordable housing challenges. It should also be noted that the names of some of the commercial fee programs can be confusing some cities name these fee programs in terms of their objective (to create affordable housing), while others link program names to earlier nomenclature regarding jobshousing balance goals, and still others carry names associated with their purpose (e.g., to mitigate commercial development impacts). SAN FRANCISCO JOBS-HOUSING LINKAGE FEE PROGRAM Background One of the earliest cities to adopt a commercial impact fee, San Francisco established a jobshousing linkage fee program to support affordable housing production in Early versions of the policy focused specifically on office development, but the law was expanded in 1996 to encompass retail and hotel uses. 18 In 2010, the Jobs-Housing Linkage Program (Program) was established in Section 413 of the San Francisco Municipal Code. The Program was founded on the acknowledgement that the supply of housing in the City had not kept pace with the demand created by workers employed in large-scale commercial developments, and that the lack of supply requires many employees to live elsewhere in the Bay Area, resulting in long commutes as well as negative impacts on quality of life, environmental resources, and social equity. The Program applies to development projects of at least 25,000 gross square feet of entertainment, hotel, production/distribution/repair (PDR), office, research and development, retail, and/or small enterprise workspace. Exemptions include grocery and pharmacy spaces 18 Keyser Marston Associates, Inc., Residential Nexus Analysis City and County of San Francisco PDF. Accessed 6/23/
164 of a certain size, as well as other standard exemptions such as developments on property owned or leased by the federal government, State of California used exclusively for governmental or educational purposes, and developments on property owned by the San Francisco Redevelopment Agency or Port of San Francisco where application is prohibited by State or local law. 19 Major phases and development projects that are part of the Mission Bay North and Mission Bay South Redevelopment Plans and Interagency Cooperation Agreements are also exempt. To fulfill the requirements of the Program, developers of commercial space have three options: 1. Payment of the impact fee, calculated based on use type and size. 2. Payment to a housing developer to construct a specified number of units based on use type (either monetary or by contributing land of equivalent value to the impact fee.) 3. A combination of the above options. Payments are imposed as conditions of project approval. If the project sponsor elects to provide a payment to housing developers instead of paying the impact fee, they must obtain written approval from the Director of the Mayor s Office of Housing and Community Development (MOHCD). Fee Structure Fees are charged on a per gross square foot basis, excluding accessory parking, and vary by commercial use type. The current fee schedule is shown below. SAN FRANCISCO FEES PER SQUARE FOOT OF COMMERCIAL DEVELOPMENT Use Fee per sq. ft. Entertainment $22.42 Hotel $17.99 Integrated PDR $18.89 Institutional $0.00 Office $24.03 PDR $0.00 Research & Development $16.01 Retail $22.42 Small Enterprise Workspace $18.89 Note: (a) Fees reflect those effective January 1, Sources: SF Planning Code, Sec. 413, 2016; BAE, Free standing pharmacies not exceeding 50,000 square feet, general grocery retail not exceeding more than 75,000 square feet, and mixed-use space consisting of residential space and pharmacy retail space not exceeding 50,000 square feet, or general grocery retail space not exceeding 75,000 square feet are exempt from the requirements of the Jobs-Housing Linkage Program (Section 413.3(8)(A-C)). 94
165 Fees also apply to the replacement or change of use from PDR space occupied prior to April, 2010 to another commercial use; however, the fee is significantly lower than that imposed for new construction. 20 In general, fees, payments, and/or transfer of land title(s) must be completed in full before issuance of the first construction document; however, the Board of Supervisors has adopted deferral mechanisms in the past. For example, during the Great Recession, development projects in the pipeline were permitted to defer payment of the jobs-housing linkage fee, in addition to all other impact fees, to the point in time just prior to issuance of the first certificate of occupancy. These deferrals were subject to a surcharge deposited into the Affordable Housing Fund. This option expired in July 2013, though the language still exists in the Planning Code, in the event that the Board of Supervisors decides to reactivate such provisions. In the event that a project does not ever receive its first building permit, the fee may be refunded by contacting the Planning and Building Inspection Departments and submitting a request. If a building permit has been issued and a developer has authorization to build but chooses not to proceed, the fee is nonrefundable. All monies generated by the impact fee and any lien proceedings are deposited into the Citywide Affordable Housing Fund, which is managed by the Mayor s Office of Housing and Community Development (MOHCD) and used exclusively to increase the supply of housing affordable to qualifying households. Unlike many other cities profiled in this report, funds may not be used for administrative or general overhead expenses. The Jobs-Housing Linkage Fee is updated periodically according to the annual percent change in the Construction Cost Index (CCI) for San Francisco. Payment to Housing Developer Should a commercial developer elect to fulfill Program requirements through payment or contribution of land to one or more housing developer(s), the housing developer(s) are required to construct a minimum of the number of housing units determined by the formula in the table below. All housing units constructed pursuant to this option must be affordable to qualifying households continuously for 50 years. 21 Similar to the fee, the magnitude of the payment to the housing developer depends on the use type. Regardless of use type, the payment or value of land contributed must be at least equivalent to the amount of the impact fee. Staff noted that this option is seldom, if ever, pursued. 20 To derive the fee for replacement or change of use from PDR occupied prior to April 2010 to another commercial use, $14.09 is subtracted from the applicable fee listed in Table 1 (depending on the new use). See Table 413.6B of Section of the Municipal Code. 21 San Francisco Municipal Code, Section (Compliance by Payment to Housing Developer.) 95
166 SAN FRANCISCO AFFORDABLE HOUSING REQUIREMENT, JOBS-HOUSING LINKAGE FEE Use Housing Unit Multiplier Entertainment Gross sq. ft. x Hotel Gross sq. ft. x Office Gross sq. ft. x R&D Gross sq. ft. x Retail Gross sq. ft. x Sources: SF Planning Code, Sec. 413, 2016; BAE, Outcomes A 2012 report published by the San Francisco Controller s Office notes, Since fiscal year , $56,791,248 in Jobs-Housing Linkage fees has been deposited into the Citywide Affordable Housing Fund, and $12,735,030 in interest has been earned on the Citywide Affordable Housing Fund, which also includes Inclusionary Housing Fees. 22 At the time of the report s publication, no commercial developers had opted to construct on- or off-site below market-rate units instead of paying the fee. In fiscal year , the Jobs-Housing Linkage Program contributed over $27 million to the Affordable Housing Fund s ending balance of approximately $103 million as of June 30, In the same year, revenues in the Affordable Housing Fund assisted the development of 609 housing units for families, developmentally disabled persons, transition-age youth, lowincome individuals, and seniors. 23 Lessons Learned Clearly defined use categories leads to easier administration. The specificity of San Francisco s commercial use categories and clarity of the definition of these uses in the City s land use classifications reduces the chance for misclassification of projects for which the jobshousing linkage fee is assessed. City staff emphasized the importance of the clarity of these definitions in their ability to consistently and accurately apply the appropriate fee rate to new projects. Consider impacts on essential neighborhood services. San Francisco s exemption of most pharmacies and grocery stores reduces the possible negative impact on the provision of essential goods and services. 22 City and County of San Francisco Controllers Office, FY Development Impact Fee Report. November 30, Accessed 7/19/ Mayor s Office of Housing and Community Development, Annual Progress Report Fiscal Year PDF. Accessed 7/15/
167 Land contribution and/or direct payment to residential developer are rarely used. As is the case in Palo Alto, the option to provide a payment to a residential developer to construct affordable units rather than paying the fee is rarely, if ever, used. It may be prudent to allow for a deferral mechanism in the future, even if not immediately effective. Deferral mechanisms were necessary and were well-utilized during the Great Recession when there was uncertainty about project completion. It is important, however, to include the provision of temporary policies carefully. San Francisco s description of a deferral mechanism in the Planning Code is somewhat misleading; the Planning Code references a section of the Building Code, which includes the expired sunset clause for this provision (planning staff noted that this is a constant source of confusion). 97
168 SACRAMENTO HOUSING TRUST FUND COMMERCIAL FEE Background The City of Sacramento enacted the Housing Trust Fund (HTF) Ordinance (Chapter of the City of Sacramento Zoning Code) to fund construction of affordable housing near new employment centers.. 24 The original impetus seems to have been rapid development in North Natomas, where expected new commercial projects caused concern about creating an imbalance between new jobs and new housing. The Citywide and North Natomas fees currently in effect are shown below. Land uses vary for North Natomas due to different land use designations for that area s Specific Plan. SACRAMENTO CITYWIDE AND NORTH NATOMAS FEES, 2016 Citywide N. Natomas Office $ 2.50 Office/Business $ 2.74 Hotel $ 2.38 Community/Neighborhood Com $ 2.06 Commercial $ 2.00 Hwy Commercial $ 2.74 R & D $ 2.12 M-50 $ 1.74 Manufacturing $ 1.57 M-20 $ 1.44 Warehouse/Office $ 0.91 Light Industrial $ 1.12 Warehouse $ 0.68 Source: City of Sacramento; BAE, Effective 7/1/2016 The City also enacted a separate series of commercial fees for projects where the developer elects to build affordable housing instead of pay the full fee (fees drop to 20 percent of above if specific amounts of housing are built). Also not shown above, are other specific land uses, including major medical facilities, which have a fee of $3.90 per square foot. In the commercial fee program, the Planning Director determines the fee amount when the project does not fall in an existing category or when it is a use not shown here. Projects subject to this discretionary determination include sports complexes, marinas, golf courses, drive-in theaters, nonresidential care facilities, bus terminals, pest control companies, slaughter houses and flea markets. Other uses are exempt from the commercial fee, including properties owned by the state or US (as a state capital, Sacramento has substantial stateowned property), non-profit homeless facilities, low income services facilities, churches, child care facilities, utilities, and a number of other special purpose structures. 24 City of Sacramento, Programs/Housing%20Trust%20Fund, last accessed May 30,
169 The Sacramento commercial fee at present, is increased each year by the San Francisco Construction Cost Index. In earlier years, fees were left the same for long periods, then increased, and when economic conditions warranted, rolled back. Fees are collected prior to (and as condition for) the issuance of the building permit. No provisions exist for the deferral of fees or refunds. However, as long as the monies have not been transferred into the Housing Trust Fund itself, it is possible for a developer who decides not to build to negotiate a refund. Fees flow to the Housing Trust Fund, created in 1989 specifically to administer monies collected under the commercial linkage fee program. The objective of the Fund is to increase and improve the supply of housing affordable to households of low income, with priority given to very low income households. 25 The Trust Fund does not finance housing for the homeless or low income senior housing. Outcomes Since inception in 1989 through 2013, approximately $25 million of commercial fees have been collected, an average of roughly $1 million per year. Staff estimates that these fees have been used to leverage gap financing to build 3,095 affordable housing units in 44 development projects. Projects receiving funds from the fees are tracked and identified on a map published by the Planning Division. Lessons Learned The staff interviewed for this report indicated that since the North Natomas area has now been largely built out, the separate fee structure may need to be collapsed into a single citywide schedule. Staff also mentioned complexities determining how to apply the fee to mixed-use projects (e.g., hotel with convention center and residential units) or or projects that start one way and end up another way (e.g., a warehouse to which office space is added over time). 25 Sacramento City Code, section Low income housing fund. 99
170 OAKLAND JOBS/HOUSING IMPACT FEE Background In 1999, the City of Oakland commissioned a Housing Development Task Force, which recommended in 2000 that the City conduct a Nexus Study for a Jobs/Housing Impact Fee. The City adopted the Jobs/Housing Impact fee in 2002 following completion of the Nexus Study in However, the City delayed implementation of the fee until 2005 in an effort to clear the development pipeline of projects that had been proposed before the fee was adopted. Fee Structure The City of Oakland adopted the jobs/housing impact fee to apply only to office and warehouse/distribution uses, despite that nexus study analyzed office, warehouse/distribution, hotel, and retail uses. The City s ordinance applies citywide but exempts the first 25,000 square feet of all projects and all space devoted to parking. In addition to new construction, the fee applies to substantial rehabilitation projects, defined as projects in which the cost of repairs or rehabilitation exceed 25 percent of the value of the building after the rehabilitation or repair. The fee is updated on an annual basis based on the Marshall & Swift building cost index. As of 2016, the fee rate was $5.44 per square foot (up from $4 per square foot in 2005) of gross floor area in excess of 25,000 square feet. Oakland assesses the fee rate at building permit issuance, but the fee is paid in three installments. The first 25 percent of the fee is paid prior to issuance of a building permit for all or any portion of the project. Developers are required to pay another 50 percent prior to issuance of a temporary certificate of occupancy for all or any portion of the project. The final 25 percent is due 18 months after the date of issuance of a temporary certificate of occupancy for all or a portion of the project. If necessary, the City may enforce payment by recording a lien against the property, revoking or suspending the certificate of occupancy, or other action. Project applicants can request a fee exemption from the City Manager only under special circumstances. In addition, applicants can elect to provide affordable units on site at a rate of units per square foot of office or warehouse/distribution uses (with the first 25,000 square feet of commercial uses exempted). However, applicants for eligible projects are generally expected to pay the fee rather than seek exemptions. The Jobs/Housing Linkage fee revenue accrues to the City s Housing Trust Fund, which is used to increase, improve, and preserve the supply of affordable housing in the City, with priority given to housing for very low income households. Eligible uses include, but are not limited to, assistance with staff costs or other administrative costs attributable to a specific affordable 100
171 housing project, equity participation in affordable housing projects, loans and grants to affordable housing projects, or other public/private partnership arrangements. Monies from the Affordable Housing Trust Fund may be extended for the benefit of rental housing, owner occupied housing, limited equity cooperatives, mutual housing developments, or other types of affordable housing projects. Outcomes As of April 2016, the City of Oakland had collected approximately $1,878,000 from the jobs/housing impact fee, with $2,483,000 expected from planned projects by the end of The City estimates that the fee revenue collected to date has supported the construction or substantial rehabilitation of 15 to 19 units, with a typical City contribution of approximately $100,000 to $125,000 per unit. Lessons Learned Adaptive reuse projects can generate commercial linkage fee revenue. The City of Oakland assesses its jobs/housing impact fee on substantial rehabilitation projects resulting in office or warehouse/distribution uses, provided that the project site has been vacant. A planned conversion of a former Sears building in the City to offices for Uber Technologies Inc. is expected to generate approximately $1 million in jobs/housing impact fees to the City, more than half of the total revenue that the fee has generated to date. Commercial linkage fee revenue collection varies substantially over time due to real estate market cycles. Since implementation in 2005, Oakland s Jobs/Housing Impact Fee has generated a relatively modest amount of revenue, totaling just under $1.9 million, approximately $170,000 per year on average. The moderate pace of revenue collection is attributable in large part to the minimal amount of developer interest in office or warehouse/distribution projects in the City since However, due to strong regional job growth in key office-based industries, leading to strong office real estate markets in Oakland and other regional employment centers, the City now anticipates receipt of approximately $2.5 million in jobs/housing impact fee revenue over the next 12 to 18 months, exceeding the total revenue collected since the fee was implemented. 101
172 SAN DIEGO HOUSING IMPACT FEE Background In 1989, the San Diego Housing Commission created a task force to address the city s growing shortage of affordable housing, leading to adoption of the Housing Trust Fund Ordinance in April 1990, which established a Housing Impact Fee for commercial development. 26 Since 1990, the Ordnance has been revised many times, most recently in April, Fees were reduced by 50 percent in 1996, and only recently restored to their 1990 levels. Fee Structure Fees apply to the gross square feet of office, hotel, and retail projects, along with a discounted fee for R & D projects (to encourage economic development). Exempt uses include manufacturing and warehousing, as well as non-profit hospitals, SRO housing units, projects located on state or federally-owned lands, and general government buildings. The most recent Ordinance update also removed the prior requirement that staff recommend an annual fee increase to City Council. 27 Current fees per April 2016 are: SAN DIEGO HOUSING IMPACT FEES Per Gross Building Sqare Foot and After Office $ 1.76 $ 2.12 Hotel $ 1.06 $ 1.28 Retail $ 1.06 $ 1.28 R & D $ 0.80 $ 0.80 Source: San Diego Municipal Code Chapter 9: Building, Housing and Sign Regulations Article 8: Housing, Division 6: Housing Impact Fees On Commercial Development For rehab projects, the fee to be paid shall be the fees for the new use, less any fees that either were paid or would have been paid based on the existing use of the building. 28 In lieu of fees, developers can donate land or air rights, provided the dedicated property is suitable for housing construction 29. Developers may also ask for a fee variance prior to obtaining the building permit, for reasons such as financial hardship or if special circumstances apply. To date, 54 requests for fee variances have been submitted, mostly by religious and educational institutions, including 49 stating they would create few jobs, one for financial hardship, and four on both grounds. The five claims of financial hardship were denied, but many of the low job-creation reasons were approved. These variances have resulted in a mix of reduced and 26 San Diego Municipal Code, Chapter 9: Building, Housing and Sign Regulations, Article 8: Housing, Division 6: Housing Impact Fees On Commercial Development, Section : Purpose. 27 Adapted, with modifications, from a person communication from staff, June 29, San Diego Municipal Code, Section : Payment of Housing Impact Fee. 29 This provision was granted once, in 2003, when the San Diego Revitalization Corporation had over $83,000 in impact fees waived because it included shared parking in a commercial project for use by people in an adjacent affordable housing project. 102
173 waived fees, reducing total collections for the 54 requests by over $600,000. The Mayor makes the ultimate determination of fee waiver amounts. 30 As of May 2016, developers may ask for fee deferral for up to two years, but certificates of occupancy are not issued without payment. The deferral program is administered by the City of San Diego Facilities Financing Department and is run on a cost-recovery basis (an application for deferral costs $500). Since the program is new, no information is available about uptake. Outcomes San Diego s commercial fees are deposited in a Housing Impact Fee subaccount of the San Diego Housing Trust Fund. Recent data collected for the period indicates that total revenues from the fee were approximately $14 million, averaging $1.55 million annually. No data is collected to track housing financed by the fee. Lessons Learned Staff indicated that the commercial fee, with just four categories, which may be too few for contemporary development product types. Also, each category is not clearly defined. The recent removal of an automatic indexed increase to the fee also is problematic, particularly because other local fees are indexed and this fee used to be indexed. 30 San Diego Municipal Code, Section : Determination of Fee. 103
174 WEST HOLLYWOOD NON-RESIDENTIAL AFFORDABLE HOUSING FEE Background West Hollywood s Non-Residential Affordable Housing Impact Fee was established in Since its inception, the fee has applied to developments of at least 10,000 net new square feet of commercial space. In 2014, the City increased the fee from $2.85 to $8.00 per square foot based on an updated nexus study. To minimize impacts of this increase, the City Council phased it in over two years; the fee rose to $4.00 per square foot in FY 15-16, and rose again to $8.00 per square foot in FY The flat fee is based on the average of the fees supported by various nonresidential uses per the most recent nexus study. 32 Fee Structure The City currently levies its commercial fee on office, retail, and hotel development. Fees must be paid prior to building permit issuance. If a project consists of multiple phases, fees for the whole project must be paid before building permit issuance. The Non-Residential Affordable Housing Impact Fee is annually adjusted based on the Building Cost Index (BCI). 33 Currently, fees cannot be deferred, and are generally nonrefundable; however, fee payments may be returned if the building permit expires and is not extended, or if the fees were collected illegally or erroneously. To request a refund, applicants must file a written request with the City no later than 90 days after the initial payment date to be considered. 34 Outcomes Commercial fees are deposited into the City s Affordable Housing Trust Fund (along with West Hollywood s residential fee). The Trust s funds subsidize housing projects with at least 20 percent of units affordable to very low income households, and at least 60 percent affordable to low- and moderate-income households. Non-profit housing developers in West Hollywood receive these funds for development costs including predevelopment, land acquisition, administration, and gap financing. From 2002 through 2013, the Trust Fund generated $2.57 million in revenue, and been used to subsidize 17 housing projects 35. Future Trust Fund revenues are projected to grow rapidly due to the recent commercial fee increase West Hollywood Department of Human Services and Rent Stabilization, Non-Residential Jobs-Housing Nexus Study and Residential Nexus Study. December 15, 2014 City Council Agenda Report. 33 Keyser Marston Associates, Non-Residential Jobs-Housing Nexus Study. August West Hollywood Municipal Code, Chapter (Development Fees). 35 Keyser Marston Associates, Non-Residential Jobs-Housing Nexus Study. August IBID 104
175 PALO ALTO COMMERCIAL IMPACT FEE Background In 1977, three years after the City adopted its inclusionary housing policy, Palo Alto began requiring affordable housing mitigation fees for large commercial and industrial developments, using its environmental review authority provided by the California Environmental Quality Act (CEQA). Funds were deposited into what was then known as the Industrial-Commercial Account, which has since evolved into the current Commercial Housing Fund. 37,38 Historically, the City has charged one impact fee per square foot for all commercial uses (most recently at $19.85). In 2014, the City completed commercial and residential nexus studies to update its commercial and market-rate residential affordable housing fees. Fee Structure Palo Alto s commercial fees are shown below. Effective August 15, 2016, the new fee structure varies by commercial use type. The fee applies to all gross building area, excluding parking. PALO ALTO COMMERCIAL FEE Use Existing Fee Adopted Fee (a) Office/R&D $19.85/sf $35/sf Hotel $19.85/sf $30/sf Retail/Restaurant/Other $19.85/sf $19.85/sf Note: (a) Adopted fee schedule is effective August 15, Sources: Palo Alto Planning and Community Environment Department, 2016; BAE, Exemptions include on-site child care or recreational facilities, residential uses, churches, colleges and universities, commercial recreation, hospitals and convalescent facilities, private clubs, private educational facilities, public facilities, and small retail/restaurant/auto spaces of 1,500 square feet or less City of Palo Alto Finance Committee, Residential/Commercial Impact Fee Studies Staff Report. February 16, Accessed 7/19/ City of Palo Alto, Affordable Housing Fund Guidelines. August 17, PDF. Accessed 7/21/ See Palo Alto Municipal Code, Chapter
176 While determined to be reasonable by the 2014 Residential Nexus Study, Palo Alto s recently adopted fees are among the highest in the Bay Area due to the City s strong housing market conditions, making housing in Palo Alto unaffordable for many new workers. 40 The commercial fee must be paid before issuance of the first grading or building permit. If a project consists of multiple phases, payments may be submitted proportional to each phase prior to issuance of the grading and building permits for that phase. Fees are adjusted annually based on in the Consumer Price Index (all urban consumers) for the San Francisco- Oakland area. Revenues generated by the affordable housing impact fee are collected in the Commercial Housing Fund, a sub-fund of the City s Affordable Housing Fund, a trust fund to preserve and expand affordable housing for very low-, low-, and moderate-income households. Other subfunds of the Affordable Housing Fund include the Residential In-Lieu Fund, Home Investment Partnership Fund, Community Development Block Grant (CDBG), and Below Market Rate Emergency Fund. Detailed guidelines for use of Affordable Housing Fund are posted on the City s website. According to these guidelines, specific restrictions apply to the use of funds in each subcategory. Fees generated by the Commercial Housing Fund may be used for the following: Construction of new housing units; Addition of new units to existing buildings; Conversion of non-residential space to housing units; Acquisition, rehabilitation, and preservation of existing affordable housing, where rents are controlled by deed restriction or another similar mechanism; Administrative costs for the collection of fees and administration of the fund; The cost of consultant studies required to update the fees; Direct costs for the City to implement an affordable housing construction program. 41 Alternatives to Fee Payment As is the case in San Francisco, Palo Alto s commercial affordable housing fee program also permits developers to construct affordable units rather than paying the fee. City staff remarked that while this alternative is available, it is rarely, if ever, pursued by commercial developers in Palo Alto. The formula used to determine the required number of below marketrate units is as follows: Gross square feet/350 x = Number of units required 40 City of Palo Alto Finance Committee, Staff Report Attachment A: Draft Commercial Linkage Fee Nexus Study. November Accessed 7/19/ City of Palo Alto, Affordable Housing Fund Guidelines. August 17, PDF. Accessed 7/21/
177 Put simply, under this alternative, developers are required to construct 1.7 percent of the gross square feet of the nonresidential development divided by 350. If the calculation results in a fraction of a unit, the developer must either provide a whole unit or pay an in-lieu fee based on the square footage of the applicable project. Outcomes In fiscal year , revenues generated by the commercial affordable housing impact fee contributed approximately $2.3 million to the Commercial Housing In-Lieu Fund, independent of interest earnings. As of June 30, 2015, the Fund contained approximately $14.6 million City of Palo Alto, Annual Status Report Development Impact Fees FY15. January 25, PDF. Accessed 7/19/
178 Commercial Fees Beyond California BOSTON COMMERCIAL IMPACT FEE Background In 1983, a non-binding ballot measure to promote development in the neighborhoods (vs. downtown) and institute a commercial linkage fee received strong voter approval. Council then adopted the fee, set at $5.00 per square foot payable in 12 years, on new commercial projects that had over square feet. of floor area and received a zoning change. After a change in administration, Boston created the Neighborhood Housing Trust to manage and allocate the fees. Council added a $1.00 square foot fee for job training and shortened the payment period from 12 to 7 years for downtown projects. A Neighborhood Jobs Trust was set up for the new job-training fees in Fee Structure Contrary to most other cities, there is a flat fee for all projects, irrespective of kind or location. It is currently set at $8.34 per square foot. Instead of paying the fee, developers may also build or help build housing that is affordable to low- and moderate-income residents (with an investment at least equal to the amount that would have been paid in fees) or do a combination of fee payment and housing development. The development project in which the developer invests must be approved by the Boston Redevelopment Authority. This provision is the mirror image, so to speak, of the City s Inclusionary Development Policy, under which a developer may pay cash in lieu of building affordable units. The fee is imposed on all new large-scale commercial real estate developments exceeding 100,000 square feet and requiring zoning relief, including expansion and rehabilitation projects. 43 The fee applies only to the floor area in excess of 100,000 square feet. This provision applies to phased development and to the Master Plans that health and educational institutions and the City of Boston adopt together to regulate the institution s growth: one cannot development in a number of small phases (< 100,000 square feet) in order to avoid fee payments. The initial fee of $5.00 per square foot was raised to $7.18 per square foot in At the same time, the payment period was set at 7 years for both downtown and neighborhood development. In 2006, the fee was raised to $7.87 per square foot was raised again in 2013, to $8.34 per square foot. 43 City of Boston, Neighborhood Housing Trust Annual Report 2014, n. p.; available at _150406_1230.pdf (last consulted on May 31, 2016). 108
179 The timing of fee payments can be spread over seven years, or paid up front (present value). For neighborhood projects, the fee must be paid either at issuance of certificate of occupancy or 24 months after issuance of building permit, whichever is sooner. Downtown projects, in contrast, must pay at building permit issuance. Fees go to the Neighborhood Housing Trust, which then allocates funds raised from fees to affordable housing projects based on criteria including meeting a but for test (fee is needed), serving households at 80 percent or below, and with affordability set for 50 years for for-sale units, and in perpetuity for rental units. 44 Outcomes Between 1986 and 2012, commercial fees generated over $133.,8 million. 45 In the same time period ( ), fees contributed to the development or preservation of 10,176 units in 193 projects. 46 Lessons Learned Boston s regulations are fairly simple compared to those of other cities (e.g., flat fee for all kinds of projects, everywhere in the city). This has limited political debates and the creation of favorable rates for some rather than others. At the same time, flexibility is important, too. For example, Boston allows developers of commercial projects to partner with a community group to build affordable units rather than pay fees, creating partnerships best-equipped to address the underlying goal of affordable housing unit production. Staff interviews indicated that Boston s lack of a built-in annual fee increase is being reconsidered at present (rather than have to rely on Council to raise fees periodically). Another possible change under consideration is whether the size threshold of 100,000 square feet should be reduced to 50,000 square feet, to provide a more targeted incentive to non-fee paying small projects. 44 Ibid. 45 Ibid. 46 Ibid. 109
180 SEATTLE AFFORDABLE HOUSING IMPACT MITIGATION PROGRAM FOR COMMERCIAL DEVELOPMENT Background Seattle has had an incentive zoning program for downtown commercial development since 2001, and for residential development since In 2013, during the rezoning of the South Lake Union area near downtown, it became clear that these programs were insufficient to meet the need for affordable housing created by new market-rate commercial and residential development. It should also be noted that general interpretations of Washington State laws have meant that fees or inclusionary zoning is considered not possible unless these are paired with upzoning regulations given at the same time. The initiative to update the city s affordable housing programs started in May It included best practices studies, the creation of the Housing Affordability and Livability Agenda (HALA), and the institution of the HALA Advisory Committee. This committee submitted its report in July Its main recommendation was that the City boost market capacity by extensive citywide upzoning of residential and commercial zones and, in connection with such upzones, implement a mandatory inclusionary housing program for new construction residential development and a commercial linkage fee program for new construction commercial development. 47 The policy goal is to help produce 6,000 housing units that are affordable to households with incomes below 60 percent of median income over ten years. A nexus study set possible fee levels; the City chose to stay well below those levels in its July 2015 Statement of Intent for Basic Framework for Mandatory Inclusionary Housing and Commercial Linkage Fee, and to monitor their effects. Council passed an ordinance in November 2015 to establish the framework for an Affordable Housing Impact Mitigation Program for commercial development. 48 Upzoning in commercial, industrial and mixed-use districts should take place in Seattle has had strong grassroots activists and political leaders over the years who have pushed the affordable-housing agenda forward. There is a community of sophisticated affordable-housing developers and experienced city staff in incentive zoning and such measures. Debates between the City and the development community were intense, with 47 City of Seattle, Ordinance , p City of Seattle, Ordinance , An ordinance relating to land use and zoning; adding a new Chapter 23.58B of the Seattle Municipal Code (SMC) to establish the framework for an Affordable Housing Impact Mitigation Program for commercial development; and amending subsection A, subsection B, subsection C, and subsection I of the SMC, available at 5A AF11-C20A4919A85B&Options=&Search=, last accessed on June 6,
181 consulting reports produced on both sides. In the end, the parties struck a Grand Bargain in which increased burdens on development to contribute to affordable housing were exchanged for increased development densities. The link between upzoning and the imposition of a commercial linkage fee also serves a legal function: because such a fee was still untested in Washington State, providing extra development density as compensation would make the policy less likely to be challenged in court. Fee Structure In all cases, developers may choose to meet the requirements of the ordinance by means of payment (fees) or by means of performance, i.e., in the provision of affordable rental units, on-site or off. Fees are differentiated by location in the city, i.e., inside or outside Downtown and South Lake Union Urban Centers and then by location within these general areas. Inside Downtown and South Lake Union Urban Centers, the fees are differentiated by land-use zone, and outside these two areas, they are differentiated by land-use zone and by intensity. Given the number of land-use zones in the downtown area and Urban Centers, this approach results in a lengthy fee schedule, but there is simplicity in the fact that there is not differentiation according to the type of development. Among the 43 land-use zones that are listed in the table of fees for Downtown and South Lake Union Urban Centers, four have no impact fee requirement; among the other 39 zones, cash requirements vary from $8.00 per square foot to $17.50 per square foot. Exemptions are meant to avoid impacting desirable mixed-use development: In building in which at least 50 percent of above-ground floor area is devoted to housing, up to 4,000 square feet of street-level floor area used for arts facilities, cafés and restaurants, entertainment venues (except for adult entertainment) and general sales and services Along designated pedestrian streets, all street-level floor area that is necessary to meet standards set by the City for such streets Commercial floor area in buildings containing affordable units (with at least 75 percent of units affordable to households with less than 60 percent of median income) and in buildings with rent-controlled or income-controlled units Seattle Municipal Code, Section 23.58B.020: Voluntary agreements for affordable housing, Subsection C: Exemptions. 111
182 The Director of Construction and Inspections may, in consultation with the Director of Housing, modify the impact fee in cases where the developer can demonstrate that the housing impact of the project does not warrant the regular fee, or when the project is in a zone with building heights over 85 feet and development standards SEATTLE ZONE MAP FOR COMMERCIAL FEES make it impossible for the project to exceed that height, or when the requirements would cause financial hardship that outweighs the affordable housing impacts 5051 As mentioned above, the ordinance calls for possible fee adjustments during the implementation phase, and every five years thereafter. In addition, there is an automatic adjustment every year, starting March 1, 2016, according to the change in the Consumer Price Index for the preceding calendar year. Fees must be paid before a construction permit is issued. However, construction permit does not include a demolition, excavation, or shoring Source: Seattle Municipal Code, 23.58B.050: Affordable housing impact permit. If a phased permit application is being used, the fees must be paid prior to issuance of the portion of the building permit that includes the structural frame for the entire building Seattle Municipal Code, Section 23.58B.030: Modification of amount of payment or performance, Subsection D. Financial hardship. 51 Although the is given in the section pertaining to the performance option, it also applies to the payment option, i.e., to the fees to be paid. 52 Seattle Municipal Code, Section 23.58B.035: Documentation and timing. 112
183 All fees will go into a dedicated fund to subsidize affordable projects which preserve or produce rental units affordable to households with incomes up to 60 percent of Area Median Income, and to owner households with incomes up to 80 percent. 53 Allocation of these funds are guided by factors including contribution to fair housing choice, location in an urban center or in an urban village (place types which guide planning in Seattle), proximity to transit service, or contribution to furthering economic opportunity. t 54 Lessons Learned The Grand Bargain struck by all stakeholders enabled the City to adopt new programs to produce affordable housing and/or generate funding for it. Parties made compromises, resulting in a complex system which links upzoining with fee payments and/or affordable housing unit production. The ordinance contains strong provisions for monitoring and possible adjustments, including planned upzonings, modifications to development standards, and starting in 2018, and every two years thereafter, staff analysis of the effectiveness of the policies and a report on unit production. The program s rules also required it to be reviewed and possibly amended within five years of its adoption if outcomes are below expectations or if significant changes occur in real-estate markets; otherwise, it has to be reviewed within ten years. To perform a review, the Mayor and Council will appoint and Technical Review Committee with proper representation of all public, private and community stakeholders. 53 Seattle Municipal Code, Section 23.58B.040: Affordable housing impact mitigation - payment option, Subsection B: Deposit and use of cash contributions. 54 Ibid. 113
184 Appendix B: Commercial Building Permit Analysis APPENDIX B-1: SUMMARY OF COMMERCIAL PERMITS, CITY OF LOS ANGELES, Permitted Commercial Space by Use Allocation Code Building Type (a) Total Permitted (sf) % of Total # of Projects Median Size (sf) Minimum Size (sf) Maximum Size (sf) Private Garage 9,976, % 82 64,855 5, ,569 Public Garage 4,417, % ,605 5,180 1,374,661 Commercial Office 4,382, % 98 19,145 5, ,380 Retail Store 1,988, % 94 12,004 5, ,865 Hotel/Motel 1,740, % 9 80,797 8, ,148 Warehouse 1,601, % 31 16,212 5, ,130 School 1,379, % 38 26,760 5, ,443 Airport Building 538, % 16 17,003 5, ,367 Miscellaneous Structure 403, % 9 11,085 6, ,548 Amusement Building 395, % 20 25,510 5, ,269 Restaurant 387, % 26 10,330 5,072 45,954 School Dormitory 285, % 3 85,192 62, ,833 Hospital 279, % 1 279,659 N/A N/A Medical/Dental Clinic 212, % 7 16,408 6,135 73,320 Church 175, % 5 29,541 6,725 71,817 Manufacturing 174, % 10 11,673 5,558 46,398 Service Station/Repair 144, % 6 7,045 5, ,777 Public Administration Building 103, % 5 15,986 7,358 51,856 Cinema/Live Theater 60, % 2 30,295 24,782 35,808 Senior Independent Housing (ground floor retail) 23, % 1 23,409 N/A N/A Consumer Services 14, % 1 14,190 N/A N/A Public Utility Facility 12, % 2 6,318 5,425 7,211 Single - room Occupancy (ground floor retail) 12, % 2 6,253 5,511 6,995 Artist-in-Residence/Loft (ground floor retail) 5, % 1 5,370 N/A N/A Total 28,716, % 493 Notes: (a) Includes permits for "New" buildings > 5,000 sf issued by City of LA from thru (b) Land use categories adapted from categories utilized in 2013 Santa Monica Commercial Nexus Study and Linkage Fee Analysis. Sources: Los Angeles Department of Buildings; BAE,
185 APPENDIX B-2: BUILDING PERMIT DATA RE-CATEGORIZED BY PROPOSED COMMERCIAL FEE LAND USES Permitted Commercial by Proposed Fee Category Fee Category (a)(b) 5-Year Total % of # of Median Minimum Maximum Size Annual Avg. 1. Office Commercial Office 4,382, % 98 19,145 5, , ,453 Subtotal 4,382, % , Retail Retail Store 1,988, % 94 12,004 5, , ,608 Amusement Building 395, % 20 25,510 5, ,269 79,129 Restaurant 387, % 26 10,330 5,072 45,954 77,459 Service Station/Repair 144, % 6 7,045 5, ,777 28,923 Cinema/Live Theater 60, % 2 30,295 24,782 35,808 12,118 Senior Independent Housing (ground floor retail) 23, % 1 23,409 N/A N/A 4,682 Consumer Services 14, % 1 14,190 N/A N/A 2,838 Single - room Occupancy (ground floor retail) 12, % 2 6,253 5,511 6,995 2,501 Artist-in-Residence/Loft (ground floor retail) 5, % 1 5,370 N/A N/A 1,074 Subtotal 3,031, % , Industrial Manufacturing 174, % 10 11,673 5,558 46,398 34,960 Subtotal 174, % 10 34, Hotel Hotel/Motel 1,740, % 9 80,797 8, , ,174 Subtotal 1,740, % 9 348, Institutional School 1,379, % 38 26,760 5, , ,969 School Dormitory 285, % 3 85,192 62, ,833 57,010 Church 175, % 5 29,541 6,725 71,817 35,058 Subtotal 1,840, % , Medical & Social Services Medical/Dental Clinic 212, % 7 16,408 6,135 73,320 42,513 Hospital 279, % 1 279,659 N/A N/A 55,932 Public Administration Building 103, % 5 15,986 7,358 51,856 20,616 Subtotal 595, % , Warehouse/Utility/Light Industrial Warehouse 1,601, % 31 16,212 5, , ,329 Public Utility Facility 12, % 2 6,318 5,425 7,211 2,527 Airport Building 538, % 16 17,003 5, , ,727 Subtotal 2,152, % ,582 SUBTOTAL EMPLOYMENT-GENERATING USES 13,917, % 378 2,783,598 Not Classifed for Fee Purposes Private Garage 9,976, % 82 64,855 5, , ,550 Public Garage 4,417, % ,605 5,180 1,374, ,550 Miscellaneous Structure 403, % 9 11,085 6, ,548 57,010 Subtotal 14,798, % 115 2,959,685 TOTAL ALL PERMITS 28,716, % 493 5,743,283 Notes: (a) Includes permits for "New" buildings > 5,000 sf issued by City of LA from thru (b) Fee categories adapted from 2013 Santa Monica Commercial Nexus Study and Linkage Fee Analysis. (c) Includes Commercial Office square footage specifically noted as creative or production-oriented in LADBS database. Sources: Los Angeles Department of Building and Safety; BAE,
186 APPENDIX B-3: DISTRIBUTION OF OFFICE AND RETAIL PROJECTS BY SIZE (SQ.FT.) Office Retail By Square Feet Sq. Ft. % of Total Sq. Ft. % of Total <10K Sq. Ft. 194, % 449, % >10K Sq. Ft. and <20K Sq. Ft. 334, % 530, % >20K Sq. Ft. 3,766, % 2,314, % 4,295, % 3,293, % By Number of Projects Projects % of Total Projects % of Total <10K Sq. Ft % % >10K Sq. Ft. and <20K Sq. Ft % % >20K Sq. Ft % % % % Note: Data are for permits for "New" buildings > 5,000 sq. ft. issued by City of LA from thru Sources: Los Angeles Department of Building and Safety; BAE,
187 Appendix C: Pro Forma Analysis for Commercial Land Uses 117
188 APPENDIX C-1: RETAIL PRO FORMAS Alternative 1 Alternative 2 Alternative 3 Alternative 1 Alternative 2 Alternative 3 Low Market with Linkage Fee Moderate Market- Baseline Moderate Market with Linkage Fee Strong Market - Baseline Strong Market with Linkage Fee Low Market with Linkage Fee Key Development Assuptions Low Market - Baseline Development Costs Low Market - Baseline Strong Market - Baseline Gross Building Area (sf) 14,000 14,000 14,000 14,000 14,000 14,000 Land $ 1,948,800 $ 1,948,800 $ 2,016,000 $ 2,016,000 $ 4,032,000 $ 4,032,000 Efficiency Ratio 95% 95% 95% 95% 95% 95% Land per Site sf $ $ $ $ $ $ Moderate Market- Baseline Moderate Market with Linkage Fee Strong Market with Linkage Fee Net Leaseable Area 13,300 13,300 13,300 13,300 13,300 13,300 Parking Ratio (spaces per square foot) 1 per per per per per per 250 Construction Costs Number of Parking Spaces Site Work $ 168,000 $ 168,000 $ 168,000 $ 168,000 $ 168,000 $ 168,000 Total Surface Spaces Hard Costs $ 1,680,000 $ 1,680,000 $ 1,680,000 $ 1,680,000 $ 1,680,000 $ 1,680,000 Total Structured Parking Spaces Hard Costs - Parking $ 336,000 $ 336,000 $ 336,000 $ 336,000 $ 336,000 $ 336,000 Total Underground Spaces Tenant Improvements $ 700,000 $ 700,000 $ 700,000 $ 700,000 $ 700,000 $ 700,000 Total Parking Area (sf) ,600 19,600 19,600 19,600 19,600 19,600 Soft Costs $ 576,800 $ 576,800 $ 576,800 $ 576,800 $ 576,800 $ 576,800 Total Number of Stories Total Number of Stories (Parking) School Fee $ 7,560 $ 7,560 $ 7,560 $ 7,560 $ 7,560 $ 7,560 Built FAR (ratio to 1.0) Commercial Linkage Fee $ - $ - $ - $ 98,000 $ - $ 392,000 Site Size (sf) 33,600 33,600 33,600 33,600 33,600 33,600 Subtotal Costs Before Financing $ 3,468,360 $ 3,468,360 $ 3,468,360 $ 3,566,360 $ 3,468,360 $ 3,860,360 Site Size (acres) Rents Financing Costs Rent/SF/Year (a) $ $ $ $ $ $ Points $ 41,620 $ 41,620 $ 41,620 $ 42,796 $ 41,620 $ 46,324 Development Costs Construction Period Interest $ 390,036 $ 390,036 $ 394,874 $ 401,930 $ 540,026 $ 568,250 Site Work $ 5 $ 5 $ 5 $ 5 $ 5 $ 5 Subtotal Financing Costs $ 431,656 $ 431,656 $ 436,494 $ 444,726 $ 581,646 $ 614,574 Hard Costs (b) $ 120 $ 120 $ 120 $ 120 $ 120 $ 120 Tenant Improvements (c) $ 50 $ 50 $ 50 $ 50 $ 50 $ 50 Total Development Costs $ 5,848,816 $ 5,848,816 $ 5,920,854 $ 6,027,086 $ 8,082,006 $ 8,506,934 Parking Costs (per space surface) $ 6,000 $ 6,000 $ 6,000 $ 6,000 $ 6,000 $ 6,000 Total Development Cost per SF $ $ $ $ $ $ Parking Costs (per space structured) $ 30,000 $ 30,000 $ 30,000 $ 30,000 $ 30,000 $ 30,000 Commerical Linkage Fee as % of TDC 0.0% 0.0% 0.0% 1.6% 0.0% 4.6% Parking Costs (per space underground) $ 50,000 $ 50,000 $ 50,000 $ 50,000 $ 50,000 $ 50,000 Total Impact Fees as % of TDC 0.1% 0.1% 0.1% 1.8% 0.1% 4.7% Soft Costs exc Fees (as % of hard) 20.0% 20.0% 20.0% 20.0% 20.0% 20.0% Valuation Impact Fees Operations School Fee per sq. ft. (d) $ 0.54 $ 0.54 $ 0.54 $ 0.54 $ 0.54 $ 0.54 Gross Income $ 332,500 $ 332,500 $ 465,500 $ 465,500 $ 665,000 $ 665,000 Commercial Linkage Fee $ - $ - $ - $ 7.00 $ Less: Vacancy $ (16,625) $ (16,625) $ (23,275) $ (23,275) $ (33,250) $ (33,250) Financing Costs Less: Op Expenses $ (16,625) $ (16,625) $ (23,275) $ (23,275) $ (33,250) $ (33,250) Loan to Cost Ratio 80.0% 80.0% 80.0% 80.0% 80.0% 80.0% Net Operating Income (NOI) $ 299,250 $ 299,250 $ 418,950 $ 418,950 $ 598,500 $ 598,500 Interest Rate 6.0% 6.0% 6.0% 6.0% 6.0% 6.0% Value at Stabilization $ 4,275,000 $ 4,275,000 $ 6,982,500 $ 6,982,500 $ 10,881,818 $ 10,881,818 Loan Fees 1.5% 1.5% 1.5% 1.5% 1.5% 1.5% Yield on Cost Construction Period (months) Value at Stabilization $ 4,275,000 $ 4,275,000 $ 6,982,500 $ 6,982,500 $ 10,881,818 $ 10,881,818 Average Outstanding Balance 60.0% 60.0% 60.0% 60.0% 60.0% 60.0% Less: Total Development Costs $ 5,848,816 $ 5,848,816 $ 5,920,854 $ 6,027,086 $ 8,082,006 $ 8,506,934 Operations Profit $ (1,573,816) $ (1,573,816) $ 1,061,646 $ 955,414 $ 2,799,812 $ 2,374,884 Vacancy 5.0% 5.0% 5.0% 5.0% 5.0% 5.0% Return on Cost -26.9% -26.9% 17.9% 15.9% 34.6% 27.9% Op Ex (% of Gross Rent) (a) 5.0% 5.0% 5.0% 5.0% 5.0% 5.0% Yield on Cost (NOI/TDC) 5.1% 5.1% 7.1% 7.0% 7.4% 7.0% Cap Rate (e) 7.0% 7.0% 6.0% 6.0% 5.5% 5.5% Project Feasible? (f) No No Yes Yes Yes Yes Notes: a) Assumes triple net lease b) Hard costs were based on data from RS Means with a location factor applied to reflect construction costs in Los Angeles. c) Estimates for tenant improvements were provided by developers active in Los Angeles building this product type. d) School Fees for Commercial Current $ 0.54 psf Anticipated to Increase in Fall 2016 $ 0.57 psf e) Cap rates were estimated based on investor reports, data provided by developers, and a review of Costar data for properties sold between August 2015 and July f) Feasibility is based on a minimum Yield on C 7% and a minimum Return on Cost of 15% based on interviews with developers active in the Los Angeles. Source: BAE,
189 APPENDIX C-2: OFFICE PRO FORMAS Alternative 1 Alternative 2 Alternative 3 Alternative 1 Alternative 2 Low Market with Linkage Fee Moderate Market with Linkage Fee Strong Market with Linkage Fee Low Market - Moderate Market- Strong Market - Low Market - Low Market with Linkage Moderate Market- Moderate Market with Strong Market - Strong Market with Linkage Key Development Assuptions Baseline Baseline Baseline Development Costs Baseline Fee Baseline Linkage Fee Baseline Fee Gross Building Area (sf) 23,000 23,000 23,000 23,000 23,000 23,000 Land $ 983,250 $ 983,250 $ 1,311,000 $ 1,311,000 $ 4,370,000 $ 4,370,000 Efficiency Ratio 100% 100% 100% 100% 100% 100% Land per Site sf $ $ $ $ $ $ Net Leaseable Area 23,000 23,000 23,000 23,000 23,000 23,000 Parking Ratio (spaces per square foot) 1 per per per per per per 500 Construction Costs Number of Parking Spaces Site Work $ 109,250 $ 109,250 $ 109,250 $ 109,250 $ 109,250 $ 109,250 Total Surface Spaces Hard Costs $ 4,485,000 $ 4,485,000 $ 4,485,000 $ 4,485,000 $ 4,485,000 $ 4,485,000 Total Structured Parking Spaces Hard Costs - Parking $ 276,000 $ 276,000 $ 276,000 $ 276,000 $ 276,000 $ 276,000 Total Underground Spaces Tenant Improvements $ 460,000 $ 460,000 $ 460,000 $ 460,000 $ 460,000 $ 460,000 Total Parking Area (sf) ,100 16,100 16,100 16,100 16,100 16,100 Soft Costs $ 1,066,050 $ 1,066,050 $ 1,066,050 $ 1,066,050 $ 1,066,050 $ 1,066,050 Total Number of Stories (Bldg) Total Number of Stories (Parking) School Fee $ 12,420 $ 12,420 $ 12,420 $ 12,420 $ 12,420 $ 12,420 Built FAR (ratio to 1.0) Commercial Linkage Fee $ - $ - $ - $ 333,500 $ - $ 759,000 Site Size (sf) 21,850 21,850 21,850 21,850 21,850 21,850 Subtotal Costs Before Financing $ 6,408,720 $ 6,408,720 $ 6,408,720 $ 6,742,220 $ 6,408,720 $ 7,167,720 Site Size (acres) Rents Financing Costs Asking Rent/SF/Year (a) $ $ $ $ $ $ Points $ 76,905 $ 76,905 $ 76,905 $ 80,907 $ 76,905 $ 86,013 Development Costs Construction Period Interest $ 709,629 $ 709,629 $ 741,093 $ 773,109 $ 1,034,757 $ 1,107,621 Site Work $ 5 $ 5 $ 5 $ 5 $ 5 $ 5 Subtotal Financing Costs $ 786,534 $ 786,534 $ 817,998 $ 854,016 $ 1,111,662 $ 1,193,634 Hard Costs (b) $ 195 $ 195 $ 195 $ 195 $ 195 $ 195 Tenant Improvements (c) $ 20 $ 20 $ 20 $ 20 $ 20 $ 20 Total Development Costs $ 8,178,504 $ 8,178,504 $ 8,537,718 $ 8,907,236 $ 11,890,382 $ 12,731,354 Parking Costs (per space surface) $ 6,000 $ 6,000 $ 6,000 $ 6,000 $ 6,000 $ 6,000 Total Development Costs/SF $ $ $ $ $ $ Parking Costs (per space structured) $ 30,000 $ 30,000 $ 30,000 $ 30,000 $ 30,000 $ 30,000 Commerical Linkage Fee as % of TDC 0.0% 0.0% 0.0% 3.7% 0.0% 6.0% Parking Costs (per space underground) $ 50,000 $ 50,000 $ 50,000 $ 50,000 $ 50,000 $ 50,000 Total Impact Fees as % of TDC 0.2% 0.2% 0.1% 3.9% 0.1% 6.1% Soft Costs exc Fees (as % of hard) 20.0% 20.0% 20.0% 20.0% 20.0% 20.0% Valuation Impact Fees Operations School Fee per sq. ft. (d) $ 0.54 $ 0.54 $ 0.54 $ 0.54 $ 0.54 $ 0.54 Gross Income $ 575,000 $ 575,000 $ 805,000 $ 805,000 $ 1,150,000 $ 1,150,000 Commercial Linkage Fee $ - $ - $ - $ $ - $ Less: Vacancy $ (28,750) $ (28,750) $ (40,250) $ (40,250) $ (57,500) $ (57,500) Financing Costs Less: Op Expenses $ (143,750) $ (143,750) $ (201,250) $ (201,250) $ (287,500) $ (287,500) Loan to Cost Ratio 80.0% 80.0% 80.0% 80.0% 80.0% 80.0% Net Operating Income (NOI) $ 402,500 $ 402,500 $ 563,500 $ 563,500 $ 805,000 $ 805,000 Interest Rate 6.0% 6.0% 6.0% 6.0% 6.0% 6.0% Value at Stabilization $ 6,192,308 $ 6,192,308 $ 10,245,455 $ 10,245,455 $ 14,636,364 $ 14,636,364 Loan Fees 1.5% 1.5% 1.5% 1.5% 1.5% 1.5% Yield on Cost Construction Period (months) Value at Stabilization $ 6,192,308 $ 6,192,308 $ 10,245,455 $ 10,245,455 $ 14,636,364 $ 14,636,364 Average Outstanding Balance 60.0% 60.0% 60.0% 60.0% 60.0% 60.0% Less: Total Development Costs $ 8,178,504 $ 8,178,504 $ 8,537,718 $ 8,907,236 $ 11,890,382 $ 12,731,354 Operations Profit $ (1,986,196) $ (1,986,196) $ 1,707,737 $ 1,338,219 $ 2,745,982 $ 1,905,010 Vacancy 5.0% 5.0% 5.0% 5.0% 5.0% 5.0% Return on Cost -24.3% -24.3% 20.0% 15.0% 23.1% 15.0% Op Ex (% of Gross Rent) (a) 25% 25% 25% 25% 25% 25% Yield on Cost (NOI/TDC) 4.9% 4.9% 6.6% 6.3% 6.8% 6.3% Cap Rate (e) 6.5% 6.5% 5.5% 5.5% 5.5% 5.5% Project Feasible? (f) No No Yes Yes Yes Yes Alternative 3 Notes: a) Assumes full-service lease b) Hard costs were based on data from RS Means with a location factor applied to reflect construction costs in Los Angeles. c) Estimates for tenant improvements were provided by developers active in Los Angeles building this product type. d) School Fees for Commercial Current $ 0.54 psf Anticipated to Increase in Fall 2016 $ 0.57 psf e) Cap rates were estimated based on investor reports, data provided by developers, and a review of Costar data for properties sold between August 2015 and July f) Feasibility is based on a minimum Yield on 6% and a minimum Return on Cost of 15% based on interviews with developers active in the Los Angeles. Source: BAE,
190 APPENDIX C-4: HOTEL PRO FORMAS Alternative 1 Alternative 2 Alternative 3 Alternative 1 Alternative 2 Alternative 3 Low Market with Linkage Fee Moderate Market with Linkage Fee Strong Market with Linkage Fee Low Market - Moderate Market- Strong Market - Low Market - Low Market with Linkage Moderate Market- Moderate Market with Strong Market - Strong Market with Linkage Key Development Assuptions Baseline Baseline Baseline Development Costs Baseline Fee Baseline Linkage Fee Baseline Fee Gross Building Area (sf) 45,000 45,000 45,000 45,000 45,000 45,000 Land $ 787,500 $ 787,500 $ 1,102,500 $ 1,102,500 $ 2,047,500 $ 2,047,500 Number of Hotel Rooms Land per Site sf $ $ $ $ $ $ Parking Ratio (a) See (a) See (a) See (a) See (a) See (a) See (a) Number of Parking Spaces Construction Costs Total Surface Spaces Site Work $ 78,750 $ 78,750 $ 78,750 $ 78,750 $ 78,750 $ 78,750 Total Structured Parking Spaces Hard Costs $ 10,125,000 $ 10,125,000 $ 10,125,000 $ 10,125,000 $ 10,125,000 $ 10,125,000 Total Underground Spaces Hard Costs - Parking $ 2,025,000 $ 2,025,000 $ 2,025,000 $ 2,025,000 $ 2,025,000 $ 2,025,000 Total Parking Area (sf) ,750 15,750 15,750 15,750 15,750 15,750 Tenant Improvements/FFEs $ 1,200,000 $ 1,200,000 $ 1,500,000 $ 1,500,000 $ 2,400,000 $ 2,400,000 Total Number of Stories (Bldg) Soft Costs $ 2,685,750 $ 2,685,750 $ 2,745,750 $ 2,745,750 $ 2,925,750 $ 2,925,750 Total Number of Stories (Parking) Built FAR (ratio to 1.0) School Fee $ 24,300 $ 24,300 $ 24,300 $ 24,300 $ 24,300 $ 24,300 Site Size (sf) 15,750 15,750 15,750 15,750 15,750 15,750 Commercial Linkage Fee $ - $ - $ - $ 225,000 $ - $ 1,125,000 Site Size (acres) Subtotal Costs Before Financing $ 16,138,800 $ 16,138,800 $ 16,498,800 $ 16,723,800 $ 17,578,800 $ 18,703,800 Rents Average Daily Rate (b) $ 135 $ 135 $ 250 $ 250 $ 300 $ 300 Financing Costs Occupancy Rate 70% 70% 70% 70% 70% 70% Points $ 205,770 $ 205,770 $ 210,360 $ 213,228 $ 224,130 $ 238,473 RevPAR $ 95 $ 95 $ 175 $ 175 $ 210 $ 210 Construction Period Interest $ 1,726,483 $ 1,726,483 $ 1,795,333 $ 1,818,283 $ 2,001,883 $ 2,116,633 Other Revenue per Available Room Night $ 15 $ 15 $ 30 $ 30 $ 30 $ 30 Subtotal Financing Costs $ 1,932,252 $ 1,932,252 $ 2,005,692 $ 2,031,511 $ 2,226,012 $ 2,355,106 Development Costs Site Work $ 5.0 $ 5.0 $ 5.0 $ 5.0 $ 5.0 $ 5.0 Total Development Costs $ 18,858,552 $ 18,858,552 $ 19,606,992 $ 19,857,811 $ 21,852,312 $ 23,106,406 Hard Costs (c) $ 225 $ 225 $ 225 $ 225 $ 225 $ 225 Total Development Costs/SF Tenant Improvements/FFEs (per room) (d) $ 20,000 $ 20,000 $ 25,000 $ 25,000 $ 40,000 $ 40,000 Commerical Linkage Fee as % of TDC 0.0% 0.0% 0.0% 1.1% 0.0% 4.9% Parking Costs (per space) (surface) $ 6,000 $ 6,000 $ 6,000 $ 6,000 $ 6,000 $ 6,000 Total Impact Fees as % of TDC 0.1% 0.1% 0.1% 1.3% 0.1% 5.0% Parking Costs (per space) (structured) $ 30,000 $ 30,000 $ 30,000 $ 30,000 $ 30,000 $ 30,000 Valuation Parking Costs (per space) (underground) $ 45,000 $ 45,000 $ 45,000 $ 45,000 $ 45,000 $ 45,000 Operations Soft Costs exc Fees (as % of hard) 20.0% 20.0% 20.0% 20.0% 20.0% 20.0% Revenue - Hotel Rooms $ 2,069,550 $ 2,069,550 $ 3,832,500 $ 3,832,500 $ 4,599,000 $ 4,599,000 Impact Fees Revenue - Other $ 328,500 $ 328,500 $ 657,000 $ 657,000 $ 657,000 $ 657,000 School Fee per sq. ft. (e) $ 0.54 $ 0.54 $ 0.54 $ 0.54 $ 0.54 $ 0.54 Less: Op Expenses $ (1,438,830) $ (1,438,830) $ (2,693,700) $ (2,693,700) $ (3,153,600) $ (3,153,600) Commercial Linkage Fee $ - $ - $ - $ 5.00 $ - $ Net Operating Income (NOI) $ 959,220 $ 959,220 $ 1,795,800 $ 1,795,800 $ 2,102,400 $ 2,102,400 Financing Costs Value at Stabilization $ 13,703,143 $ 13,703,143 $ 29,930,000 $ 29,930,000 $ 35,040,000 $ 35,040,000 Loan to Cost Ratio 85.0% 85.0% 85.0% 85.0% 85.0% 85.0% Yield on Cost Interest Rate 6.0% 6.0% 6.0% 6.0% 6.0% 6.0% Value at Stabilization $ 13,703,143 $ 13,703,143 $ 29,930,000 $ 29,930,000 $ 35,040,000 $ 35,040,000 Loan Fees 1.5% 1.5% 1.5% 1.5% 1.5% 1.5% Less: Total Development Costs $ 18,858,552 $ 18,858,552 $ 19,606,992 $ 19,857,811 $ 21,852,312 $ 23,106,406 Construction Period (months) Profit $ (5,155,409) $ (5,155,409) $ 10,323,008 $ 10,072,189 $ 13,187,688 $ 11,933,594 Avg. Outstanding Balance During Construction 60.0% 60.0% 60.0% 60.0% 60.0% 60.0% Return on Cost -27.3% -27.3% 52.6% 50.7% 60.3% 51.6% Operations Yield on Cost (NOI/TDC) 5.1% 5.1% 9.2% 9.0% 9.6% 9.1% Op Ex (% of revenue per available room) 60% 60% 60% 60% 60% 60% Project Feasible? (f) No No Yes Yes Yes Yes Cap Rate (f) 7.0% 7.0% 6.0% 6.0% 6.0% 6.0% Notes: a) The parking requirements for a hotel/motel are as follows: one parking space for the first 30 guestrooms, 1/2 of a parking space for the next 30 guestrooms, and 1/3 of a parking space for the remaining rooms. b) Average daily rates were derived from listesd average rooms rates for hotels across market conditions. c) Hard costs were based on data from RS Means with a location factor applied to reflect construction costs in Los Angeles. d) Furniture, fixtures, and equipment for hotels in strong markets were assumed to have a greater cost associated with higher grade finishes. e) School Fees for Commercial Current $ 0.54 psf Anticipated to Increase in Fall 2016 $ 0.57 psf f) Cap rates were estimated based on investor reports, data provided by developers, and a review of Costar data for properties sold between August 2015 and July g) Feasibility is based on a minimum YOC of 9% and a minimum return on cost of 15% based on interviews with developers active in the Los Angeles. Source: BAE,
191 APPENDIX C-5: WAREHOUSE PRO FORMAS Alternative 1 Alternative 2 Alternative 3 Low Market with Linkage Fee Moderate Market with Linkage Fee Strong Market with Linkage Fee Alternative 1 Alternative 2 Alternative 3 Key Development Assuptions Low Market - Baseline Moderate Market- Baseline Strong Market - Baseline Development Costs Low Market - Baseline Low Market with Linkage Fee Moderate Market- Baseline Moderate Market with Linkage Fee Strong Market - Baseline Strong Market with Linkage Fee Gross Building Area (sf) 16,000 16,000 16,000 16,000 16,000 16,000 Land $ 351,300 $ 351,300 $ 468,400 $ 468,400 $ 1,405,200 $ 1,405,200 Efficiency Ratio 100% 100% 100% 100% 100% 100% Land per Site sf $ $ $ $ $ $ Net Leaseable Area 16,000 16,000 16,000 16,000 16,000 16,000 Parking Ratio (spaces per square foot) (a) 1 per per per per per per 500 Construction Costs Number of Parking Spaces (a) Site Work $ 117,100 $ 117,100 $ 117,100 $ 117,100 $ 117,100 $ 117,100 Total Surface Spaces Hard Costs $ 1,760,000 $ 1,760,000 $ 1,760,000 $ 1,760,000 $ 1,760,000 $ 1,760,000 Total Structured Parking Spaces Hard Costs - Parking $ 127,200 $ 127,200 $ 127,200 $ 127,200 $ 127,200 $ 127,200 Total Underground Spaces Tenant Improvements $ - $ - $ - $ - $ - $ - Total Parking Area (sf) 350 7,420 7,420 7,420 7,420 7,420 7,420 Soft Costs $ 400,860 $ 400,860 $ 400,860 $ 400,860 $ 400,860 $ 400,860 Total Number of Stories (Bldg) Total Number of Stories (Parking) School Fee $ 8,640 $ 8,640 $ 8,640 $ 8,640 $ 8,640 $ 8,640 Built FAR (ratio to 1.0) Commercial Linkage Fee $ - $ - $ - $ 80,000 $ - $ 400,000 Site Size (sf) 23,420 23,420 23,420 23,420 23,420 23,420 Subtotal Costs Before Financing $ 2,413,800 $ 2,413,800 $ 2,413,800 $ 2,493,800 $ 2,413,800 $ 2,813,800 Site Size (acres) Rents Financing Costs Asking Rent/SF/Year (b) $ 9.00 $ 9.00 $ $ $ $ Points $ 28,966 $ 28,966 $ 28,966 $ 29,926 $ 28,966 $ 33,766 Development Costs Construction Period Interest $ 132,725 $ 132,725 $ 138,346 $ 142,186 $ 183,312 $ 202,512 Site Work $ 5 $ 5 $ 5 $ 5 $ 5 $ 5 Subtotal Financing Costs $ 161,690 $ 161,690 $ 167,311 $ 172,111 $ 212,278 $ 236,278 Hard Costs (c) $ 110 $ 110 $ 110 $ 110 $ 110 $ 110 Tenant Improvements $ - $ - $ - $ - $ - $ - Total Development Costs $ 2,926,790 $ 2,926,790 $ 3,049,511 $ 3,134,311 $ 4,031,278 $ 4,455,278 Parking Costs (per space surface) $ 6,000 $ 6,000 $ 6,000 $ 6,000 $ 6,000 $ 6,000 Total Development Costs/SF $ 183 $ 183 $ 191 $ 196 $ 252 $ 278 Parking Costs (per space structured) $ 30,000 $ 30,000 $ 30,000 $ 30,000 $ 30,000 $ 30,000 Commerical Linkage Fee as % of TDC 0.0% 0.0% 0.0% 2.6% 0.0% 9.0% Parking Costs (per space underground) $ 50,000 $ 50,000 $ 50,000 $ 50,000 $ 50,000 $ 50,000 Total Impact Fees as % of TDC 0.3% 0.3% 0.3% 2.8% 0.2% 9.2% Soft Costs exc Fees (as % of hard) 20% 20.0% 20.0% 20.0% 20.0% 20.0% Valuation Impact Fees Operations School Fee per sq. ft. (d) $ 0.54 $ 0.54 $ 0.54 $ 0.54 $ 0.54 $ 0.54 Gross Income $ 144,000 $ 144,000 $ 224,000 $ 224,000 $ 320,000 $ 320,000 Commercial Linkage Fee $ - $ - $ - $ 5.00 $ - $ Less: Vacancy $ (7,200) $ (7,200) $ (11,200) $ (11,200) $ (16,000) $ (16,000) Financing Costs Less: Op Expenses $ (4,320) $ (4,320) $ (6,720) $ (6,720) $ (9,600) $ (9,600) Loan to Cost Ratio 80.0% 80.0% 80.0% 80.0% 80.0% 80.0% Net Operating Income (NOI) $ 132,480 $ 132,480 $ 206,080 $ 206,080 $ 294,400 $ 294,400 Interest Rate 6.0% 6.0% 6.0% 6.0% 6.0% 6.0% Value at Stabilization $ 2,208,000 $ 2,038,154 $ 3,746,909 $ 3,746,909 $ 5,352,727 $ 5,352,727 Loan Fees 1.5% 1.5% 1.5% 1.5% 1.5% 1.5% Yield on Cost Construction Period (months) Value at Stabilization $ 2,208,000 $ 2,038,154 $ 3,746,909 $ 3,746,909 $ 5,352,727 $ 5,352,727 Average Outstanding Balance 60.0% 60.0% 60.0% 60.0% 60.0% 60% Less: Total Development Costs $ 2,926,790 $ 2,926,790 $ 3,049,511 $ 3,134,311 $ 4,031,278 $ 4,455,278 Operations Profit $ (718,790) $ (888,637) $ 697,398 $ 612,598 $ 1,321,450 $ 897,450 Vacancy 5% 5% 5% 5% 5% 5% Return on Cost -24.6% -30.4% 22.9% 19.5% 32.8% 20.1% Op Ex (% of Gross Rent) (b) 3% 3% 3% 3% 3% 3% Yield on Cost (NOI/TDC) 4.5% 4.5% 6.8% 6.6% 7.3% 6.6% Cap Rate (e) 6.0% 6.5% 5.5% 5.5% 5.5% 5.5% Project Feasible? (f) No No Yes Yes Yes Yes Notes: a) The parking ratio for warehouse or storage is 1 per 500 square feet for the first 10,000 square feet, and 1 per 5,000 thereafter. b) Assumes triple-net lease b) Hard costs were based on data from RS Means with a location factor applied to reflect construction costs in Los Angeles. d) School Fees for Commercial Current $ 0.54 psf Anticipated to Increase in Fall 2016 $ 0.57 psf e) Cap rates were estimated based on investor reports, data provided by developers, and a review of Costar data for properties sold between August 2015 and July f) Feasibility is based on a minimum YOC of 6.5% and a minimum return on cost of 15% based on interviews with developers active in the Los Angeles. Source: BAE,
192 APPENDIX C-6: INDUSTRIAL PRO FORMAS Alternative 1 Alternative 2 Alternative 3 Alternative 1 Alternative 2 Low Market with Linkage Fee Moderate Market with Linkage Fee Strong Market with Linkage Fee Key Development Assuptions Low Market - Baseline Moderate Market- Baseline Strong Market - Baseline Development Costs Low Market - Baseline Low Market with Linkage Fee Moderate Market- Baseline Moderate Market with Linkage Fee Strong Market - Baseline Strong Market with Linkage Fee Gross Building Area (sf) 12,000 12,000 12,000 12,000 12,000 12,000 Land $ 306,000 $ 306,000 $ 408,000 $ 408,000 $ 816,000 $ 816,000 Efficiency Ratio 95% 95% 95% 95% 95% 95% Land per Site sf $ $ $ $ $ $ Net Leaseable Area 11,400 11,400 11,400 11,400 11,400 11,400 Parking Ratio (spaces per square foot) 1 per per per per per per 500 Construction Costs Number of Parking Spaces Site Work $ 102,000 $ 102,000 $ 102,000 $ 102,000 $ 102,000 $ 102,000 Total Surface Spaces Hard Costs $ 1,620,000 $ 1,620,000 $ 1,620,000 $ 1,620,000 $ 1,620,000 $ 1,620,000 Total Structured Parking Spaces Hard Costs - Parking $ 144,000 $ 144,000 $ 144,000 $ 144,000 $ 144,000 $ 144,000 Total Underground Spaces Tenant Improvements $ - $ - $ - $ - $ - $ - Total Parking Area (sf) 350 8,400 8,400 8,400 8,400 8,400 8,400 Soft Costs $ 373,200 $ 373,200 $ 373,200 $ 373,200 $ 373,200 $ 373,200 Total Number of Stories (Bldg) Total Number of Stories (Parking) School Fee $ 6,480 $ 6,480 $ 6,480 $ 6,480 $ 6,480 $ 6,480 Built FAR (ratio to 1.0) Commercial Linkage Fee $ - $ - $ - $ 168,000 $ - $ 234,000 Site Size (sf) 20,400 20,400 20,400 20,400 20,400 20,400 Subtotal Costs Before Financing $ 2,245,680 $ 2,245,680 $ 2,245,680 $ 2,413,680 $ 2,245,680 $ 2,479,680 Site Size (acres) Rents Financing Costs Asking Rent/SF/Year (a) $ $ $ $ $ $ Points $ 2,695 $ 2,695 $ 2,695 $ 2,896 $ 2,695 $ 2,976 Development Costs Construction Period Interest $ 12,248 $ 12,248 $ 12,738 $ 13,544 $ 14,696 $ 15,819 Site Work $ 5 $ 5 $ 5 $ 5 $ 5 $ 5 Subtotal Financing Costs $ 14,943 $ 14,943 $ 15,432 $ 16,440 $ 17,391 $ 18,795 Hard Costs $ 135 $ 135 $ 135 $ 135 $ 135 $ 135 Tenant Improvements $ - $ - $ - $ - $ - $ - Total Development Costs $ 2,566,623 $ 2,566,623 $ 2,669,112 $ 2,838,120 $ 3,079,071 $ 3,314,475 Parking Costs (per space surface) $ 6,000 $ 6,000 $ 6,000 $ 6,000 $ 6,000 $ 6,000 Total Development Costs/SF $ 214 $ 214 $ 222 $ 237 $ 257 $ 276 Parking Costs (per space structured) $ 30,000 $ 30,000 $ 30,000 $ 30,000 $ 30,000 $ 30,000 Commerical Linkage Fee as % of TDC 0.0% 0.0% 0.0% 5.9% 0.0% 7.1% Parking Costs (per space underground) $ 50,000 $ 50,000 $ 50,000 $ 50,000 $ 50,000 $ 50,000 Total Impact Fees as % of TDC 0.3% 0.3% 0.2% 6.1% 0.2% 7.3% Soft Costs exc Fees (as % of hard) 20% 20.0% 20.0% 20.0% 20.0% 20.0% Valuation Impact Fees Operations School Fee per sq. ft. (c) $ 0.54 $ 0.54 $ 0.54 $ 0.54 $ 0.54 $ 0.54 Gross Income $ 114,000 $ 114,000 $ 205,200 $ 205,200 $ 239,400 $ 239,400 Commercial Linkage Fee $ - $ - $ - $ $ - $ Less: Vacancy $ (5,700) $ (5,700) $ (10,260) $ (10,260) $ (11,970) $ (11,970) Financing Costs Less: Op Expenses $ (5,700) $ (5,700) $ (10,260) $ (10,260) $ (11,970) $ (11,970) Loan to Cost Ratio 8.0% 8.0% 8.0% 8.0% 8.0% 8.0% Net Operating Income (NOI) $ 102,600 $ 102,600 $ 184,680 $ 184,680 $ 215,460 $ 215,460 Interest Rate 6.0% 6.0% 6.0% 6.0% 6.0% 6.0% Value at Stabilization $ 1,710,000 $ 1,578,462 $ 3,357,818 $ 3,357,818 $ 3,917,455 $ 3,917,455 Loan Fees 1.5% 1.5% 1.5% 1.5% 1.5% 1.5% Yield on Cost Construction Period (months) Value at Stabilization $ 1,710,000 $ 1,578,462 $ 3,357,818 $ 3,357,818 $ 3,917,455 $ 3,917,455 Average Outstanding Balance 60.0% 60.0% 60.0% 60.0% 60.0% 60% Less: Total Development Costs $ 2,566,623 $ 2,566,623 $ 2,669,112 $ 2,838,120 $ 3,079,071 $ 3,314,475 Operations Profit $ (856,623) $ (988,161) $ 688,706 $ 519,698 $ 838,384 $ 602,980 Vacancy 5% 5% 5% 5% 5% 5% Return on Cost -33.4% -38.5% 25.8% 18.3% 27.2% 18.2% Op Ex (% of Gross Rent) (b) 5% 5% 5% 5% 5% 5% Yield on Cost (NOI/TDC) 4.0% 4.0% 6.9% 6.5% 7.0% 6.5% Cap Rate (d) 6.0% 6.5% 5.5% 5.5% 5.5% 5.5% Project Feasible? (f) No No Yes Yes Yes Yes Alternative 3 Notes: a) Assumes triple-net lease b) Hard costs were based on data from RS Means with a location factor applied to reflect construction costs in Los Angeles. c) School Fees for Commercial Current $ 0.54 psf Anticipated to Increase in Fall 2016 $ 0.57 psf d) Cap rates were estimated based on investor reports, data provided by developers, and a review of Costar data for properties sold between August 2015 and July e) Feasibility is based on a minimum YOC of 6.5% and a minimum return on cost of 15% based on interviews with developers active in the Los Angeles. Source: BAE,
193 APPENDIX C-7: MEDICAL (HOSPITAL) PROTOTYPE (COST-BASIS) Key Development Assuptions (a) Cost Basis Development Costs Cost Basis Gross Building Area (sf) 75,000 Land $ 3,906,250 Efficiency Ratio 100% Land per Site sf $ Net Leaseable Area 75,000 Parking Ratio (spaces per square foot) 1 per 200 Construction Costs Number of Parking Spaces 375 Site Work $ 390,625 Total Surface Spaces - Hard Costs $ 60,000,000 Total Structured Parking Spaces 375 Hard Costs - Parking $ 9,375,000 Total Underground Spaces - Tenant Improvements $ - Total Parking Area (sf) ,250 Soft Costs $ 13,953,125 Total Number of Stories (Bldg) 6 Subototal Before Fees $ 83,718,750 Total Number of Stories (Parking) 2 Built FAR (ratio to 1.0) 1.0 School Fee $ 40,500 Site Size (sf) 78,125 Commercial Linkage Fee $ 2,625,000 Site Size (acres) 1.79 Subtotal Fees $ 2,665,500 Rents Asking Rent/SF/Year N/A Total Development Costs $ 90,290,500 Development Costs Total Development Costs/SF $ 1,204 Site Work $ 5 Commerical Linkage Fee as % of TDC 2.9% Hard Costs $ 800 Total Impact Fees as % of TDC 3.0% Tenant Improvements $ - Parking Costs (per space surface) $ 6,000 Parking Costs (per space structured) $ 25,000 Parking Costs (per space underground) $ 40,000 Soft Costs exc Fees (as % of hard) 20.0% Impact Fees School Fee per sq. ft. (b) $ 0.54 Commercial Linkage Fee $ Notes: a) The hospital/medical office prototype was evaluated using a total development cost metric because it is difficult to obtain data on revenue, which varies depending on the type of medical services offered. Data from the Office of Statewide Health Planning and Development was evaluated for new hospital expansion projects between 2010 and 2016, with construction costs averaging $600-$1,200 per square foot. For each cost threshold, the fee was set at 1% of total development cost. b) School Fees for Commercial Current $ 0.54 Anticipated to Increase in Fall 2016 $ 0.57 Source: BAE,
194 APPENDIX C-8: LAND SALES FOR COMMERCIAL AND RESIDENTIAL PROJECTS Commercial Land Comps City Neighborhood APN Zoning Sale Date Land SF Sales Price Price/SF Market 7221 Canby Avenue Reseda Reseda C2 4/3/ ,994 $ 439,760 $ Low Sherman Way Reseda Reseda C2 4/17/ ,690 $ 1,600,000 $ Low Sherman Way Reseda Reseda C2 4/17/ ,220 $ 1,600,000 $ Low Sherman Way Reseda Reseda C2 4/3/2015 8,400 $ 420,000 $ Low Reseda Blvd Reseda Reseda C2/P 3/3/ ,142 $ 1,550,000 $ Low 7332 Reseda Blvd Reseda Reseda C2 9/19/ ,140 $ 1,555,000 $ Low Sherman Way Canoga Park Canoga Park R2 5/4/ ,719 $ 880,000 $ Low 7304 Canby Avenue Reseda Reseda C2 4/18/2014 8,003 $ 540,000 $ Low Bryant Street Northridge Northridge CM 3/2/ ,192 $ 1,040,000 $ Low Sherman Way Winnetka Winnetka C4-5/P 6/6/ ,533 $ 1,500,000 $ Low Average $ Sherman Way Van Nuys Lake Balboa C2 2/28/ ,552 $ 840,000 $ Moderate Sherman Way Van Nuys Lake Balboa LAR3 3/14/ ,462 $ 967,000 $ Moderate Average $ Industrial Land Comps 930 East 111th Place Los Angeles Green Meadows Multiple M-1-395,555 $ 7,900,000 $ Moderate 338 East Beach Avenue Inglewood N/A Industrial 11/1/ ,468 $ 1,100,000 $ Outside of City 9415 Burtis Street South Gate N/A Industrial 11/1/ ,508 $ 5,250,000 $ Outside of City South Wilmington Avenue Carson N/A Industrial 12/1/ ,164 $ 14,200,000 $ Outside of City Average $ Residential Land Comps # of Units Price/Unit N. Soto Street Los Angeles Boyle Heights N/A N/A Escrow 49 $ 2,000,000 $ 40,816 Low East 1st Street Los Angeles Boyle Heights N/A N/A 8/1/ $ 1,483,100 $ 47,842 Low Sichel Street Los Angeles Lincoln Heights N/A N/A 2/1/ $ 1,195,000 $ 59,750 Low 516 Echandia Street Los Angeles Boyle Heights N/A N/A 4/1/ $ 230,000 $ 76,667 Low Average $ 56,269 G12 Los Angeles Downtown N/A N/A Oct $ 45,000,000 $ 70,313 High Hanover Los Angeles Downtown N/A N/A Jan $ 18,000,000 $ 77,922 High 1027 Olive Los Angeles Downtown N/A N/A Jan $ 20,000,000 $ 99,502 High Average $ 82,579 Source: Data based on multiple appraisals provided by the City of Los Angeles in
195 Appendix D: Residential Fee Case Studies The following profiles several residential fee programs established in cities throughout California. First, larger cities programs are summarized, including San Francisco, Sacramento, Oakland, and San Diego. Next, several smaller cities located near Los Angeles are profiled to provide context for more localized real estate economics and policy considerations. It should be noted that these profiles are not exhaustive; numerous other cities in California have pre-existing inclusionary housing programs, and almost all of these jurisdictions have an in-lieu fee option (especially post-palmer for rental housing projects). The only city profiled in this chapter that did not have an existing inclusionary housing ordinance at the time of the Palmer decision is Oakland, which just recently adopted it s housing impact fee, as described below. SAN FRANCISCO INCLUSIONARY PROGRAM AND IN-LIEU FEES Background San Francisco s Inclusionary Housing Program dates back to 1992, though substantial amendments in 2002 extended applicability to as-of-right projects with ten units or more, and established the option to pay an in-lieu fee that in large part remains in place today. Since its inception, the inclusionary requirements and scope have been modified numerous times to account for changing economic conditions, growing affordable housing needs. and legal challenges to inclusionary housing policies across the State. 55 At the time of the policy s adoption in 1992, the program established a 10 percent on-site affordable housing (60% AMI) requirement that applied only to projects seeking conditional uses. Changes to the policy in 2002 cited declining vacancy rates and dramatic increases in average housing prices as the impetus for the imposition of stricter requirements, including expanding its applicability to asof-right projects. 56 Rather than constructing inclusionary units, market-rate residential developers have had an option to pay an in-lieu fee, based on the number of off-site inclusionary units (typically a higher percentage than those required on-site), the affordability gap identified by way of a nexus study, and annual adjustments. 55 A summary of the evolution of San Francisco s Inclusionary Housing Program has been compiled by the Mayor s Office of Housing and Community Development and may be accessed at the following URL as of 7/21/16: Evolution%20of%20Inclusionary%20Housing%20Program% pdf. 56 San Francisco Ordinance No , Inclusionary Affordable Housing Program. Amended 3/18/02. Accessed 7/18/
196 In 2010, the Program s in-lieu fee evolved into the Affordable Housing Fee following the 2009 California Court of Appeal s decision in Palmer/Sixth Street Properties L.P. v. City of Los Angeles, which effectively prohibited the enforcement of inclusionary housing programs and associated in-lieu fees on rental developments. The current ordinance imposes the Affordable Housing Fee on residential projects of ten or more units and provides developers with an option to construct units rather than paying the Fee, provided they meet certain requirements. This setup is opposite the original policy, which required the construction of units but offered the option to pay an in-lieu fee, subject to conditions. Most recently, in June 2016, San Francisco voters passed Proposition C, which removed the existing inclusionary rates from the City Charter to allow for easier routine adjustment and increased the affordable housing obligations applicable for larger market-rate residential developments. The requirements set forth in Proposition C will be enforced on an interim basis until the City enacts an ordinance to amend the Planning Code and adopt inclusionary and/or affordable housing obligations. 57 As such, the inclusionary standards described in this section reflect those in Proposition C. Today, San Francisco s program applies broadly to any residential development project that consists of at least ten units (even if units are located on separate adjacent lots), with standard exemptions such as developments located on property owned or leased continuously by the United States or State of California used exclusively for governmental or educational purposes, and those located on property owned by the San Francisco Redevelopment Agency or Port of San Francisco where application is prohibited by State or local law. Projects in which 100 percent of units will be affordable and regulated by a government unit, agency, or authority and qualified student housing projects are also exempt from the inclusionary requirement, subject to specific requirements and conditions. 58 As part of the program, all project sponsors or developers are required to submit a Declaration of Intent specifying how the inclusionary requirements will be fulfilled to the Planning Department before payment of any fees. The Planning Department is then responsible for notifying the Development Fee Collection Unit at the Department of Building Inspection of their choice. Should a developer opt to proceed with an alternative option rather than paying the 57 The full text of Proposition C may be accessed at the following URL as of 7/21/16: 58 Section of the Municipal Code states, If a project qualifies as exempt because it consists of 100 percent affordable units, the project sponsor must record an NSR against the property that provides that, in the event of foreclosure or for any other reason, the project no longer qualifies as a project meeting the requirements of [the exemption], the project will either pay the Affordable Housing Fee plus interest from the date the project received its first construction document for the project if no affordable units were ever provided, or if affordable units were provided and occupied, then the Affordable Housing Fee with no interest is due on the dates the units were no longer occupied by qualifying households; or provide the required number of on-site affordable units required at time of original project approval and that those units shall be subject to all of the requirements of [the inclusionary program]. In order to qualify as exempt, a Student Housing project must be part of a larger institutional master plan, which is to be filed with the Planning Department prior to the issuance of any building permit or alteration permit. 126
197 fee, they must submit an Affidavit of Eligibility for an Alternative to the Affordable Housing Fee in addition to the Declaration of Intent. Fee Structure The amount of the Affordable Housing Fee (formerly the in lieu fee) is charged on a per-unit basis for either 20 percent of the total number of units in the principal project for projects with 10 to 24 units or 33 percent for projects with 25 units or more, without rounding up to the nearest whole number. The current fee schedule is shown in the table below. Fees charged per unit reflect the unit mix of the principal project. The inclusion of a fee specific to single room occupancy (SRO) and Group Housing Units in 2016 is unique among the case study areas analyzed for this report and accounts for the finding that these units are typically smaller than studios. MARKET-RATE RESIDENTIAL AFFORDABLE HOUSING FEES Project Size Unit Type (a) Units (b) 25+ Units (c) SRO/Group Housing Unit $29,701 $49,007 Studio $39,602 $65,343 1 Bedroom $53,792 $88,757 2 Bedroom $73,274 $120,902 3 Bedroom $83,560 $137,874 4 Bedroom $104,286 $172,072 Note: (a) Fees shown are those effective June 1, (b) Reflects an off-site inclusionary requirement of 20% of units in the principal project. (c) Reflects an off-site inclusionary requirement of 33% of units in the principal project. Sources: SF Mayor's Office of Housing and Community Development, 2016; BAE, The Affordable Housing Fee must be paid in full before issuance of the first construction document, though in the past, the Board of Supervisors has adopted deferral mechanisms. For example, during the Great Recession, development projects in the pipeline were permitted to defer payment of the in-lieu fee, in addition to all other impact fees, to prior to issuance of the first certificate of occupancy, subject to a deferral surcharge deposited into the Downtown Park Fund. This option expired in July 2013, though the language still exists in the Planning Code, in the event that the Board of Supervisors is motivated to reactivate such provisions. All monies collected by the Affordable Housing Fee and any lien proceedings are deposited into the Citywide Affordable Housing Fund, which is managed by the Mayor s Office of Housing. Funds generated by the Inclusionary Housing Program are used as a source of gap financing to 127
198 support affordable housing developments, 59 assist low and moderate income homebuyers, and pay the expenses of the Mayor s Office of Housing and Community Development (MOHCD) as necessary to administer and monitor compliance with the Program, but not exceeding $200,000 every five years. The Mayor s Office of Housing and Community Development updates and publishes annual adjustments to the Affordable Housing Fee, based on the annual percent change in the Construction Cost Index (CCI) for San Francisco as published by Engineering News Record. Alternatives As noted previously, developers may choose to construct inclusionary units, either on- or offsite (or provide a combination of units and paying the fee) rather than paying the Affordable Housing Fee in full. 60 If a developer chooses to construct units rather than paying the fee, they must either (a) construct, market and sell all units as ownership units that will remain ownership units for the life of the project, or (b) submit a contract to the City demonstrating that construction of the inclusionary units is not in violation of the Costa-Hawkins Rental Housing Act because they have entered into an agreement with a public entity to receive a direct financial contribution or other form of assistance, thereby exempting the development from the requirements of Costa-Hawkins. 61 Typically, off-site units must be located within one mile of the principal project, to support an even distribution of market-rate and subsidized housing across the City. Special requirements may apply to individual projects subject to standards established in a developer agreement. Pursuant to recent changes adopted in Proposition C, the number of inclusionary units required is dependent on project size as follows: Projects with Units For projects with fewer than 25 units, developers may choose to construct inclusionary units on- or off-site, equivalent to either 12 percent of the number of units in the principal project for on-site units or 20 percent for off-site units, and affordable to low-income households Based on an interview with a Development Project Manager in the Mayor s Office of Housing and Community Development, the amount of gap financing contributed by the Affordable Housing Fund typically does not exceed $200,000 per unit. The City has established supportive service requirements for affordable projects, and these standards which may be increased especially when the City has invested funds into the project; however, funds are generally not used directly for supportive services, which are typically shown as an operating expense (rather than construction cost), and paid by the developer over the life of the project. 60 In certain geographic areas such as the UMU and Mission Transit Districts, developers also have an additional option to contribute land to the City whose value is at least equivalent to payment of the Affordable Housing Fee. 61 Refer to California Civil Code Section (a)(2). 62 The percentage requirement of off-site affordable units is slightly different for tall projects. Section of the Municipal Code provides that any project that is over 120 feet in height and does not require a Zoning Map amendment or Planning Code text amendment related to its project approvals that results in a net increase in the number of permissible residential units or in a material increase in the net permissible residential square footage is required to construct 17 percent times the number of units in the principal project, rounded up from fractions of 0.5 or more. 128
199 Projects with 25+ Units For projects with twenty-five dwelling units or more, the minimum required number of on-site affordable units be must be equal to at least 25 percent of the units in the principal project, rounded up from fractions of 0.5 or more, with 15 percent of units affordable to low- and very low-income households and 10 percent affordable to middle-income households. If inclusionary units are constructed off-site, the developer must construct at least the number of units equivalent to 33 percent of all units constructed in the principal project, rounded up from fractions of 0.5 or more, with 20 percent of units affordable to low- and very low-income households and 13 percent of units affordable to middle-income households. These alternative scenarios are summarized in the table below. INCLUSIONARY HOUSING REQUIREMENTS FOR ON- AND OFF-SITE UNITS Project Size On-Site Requirement (a) On-Site Minimum Affordability Requirement Off-Site Requirement (b) Off-Site Minimum Affordability Requirement < 10 units 0 N/A 0 N/A units 12% of units on project site Affordable to LI households 20% of units in principal project Affordable to LI households > 24 units 25% of units on project site 15% affordable to LI households; 10% affordable to LI/MI households 33% of units in principal project 20% affordable to LI households; 13% affordable to LI/MI households Notes: (a) The requirements shown are general, city-wide requirements. Specific requirements may apply to the UMU District and Eastern Neighborhood. (b) Subject to a pending feasibility study. Sources: SF Planning Code, Sec. 415, 2016; SF Planning, 2016; BAE, Outcomes Since its inception in 1992, the inclusionary housing program has resulted in the production of 2,157 total below market-rate (BMR) units with an average of 86 units completed per year 63 Due to the nature of the program, the magnitude of BMR inclusionary housing units completed in a particular year is dependent on market-rate construction trends and consequently broader economic conditions. In 2008, for example, 311 BMR units were completed, the peak year since the program s establishment in Following the Great Recession, the program saw its lowest production of BMR inclusionary units, with just four completed in Since 2012, production of BMR units has grown annually, but has not yet exceeded the 2008 pre-recession peak. In addition to the units produced on-site, as of FY , $50,321,468 in Inclusionary Housing Fees had been deposited into the Affordable Housing Fund. 64 Lessons Learned 63 Based on an inventory of projects completed between Q and Q Source data provided by the SF MOHCD and may be downloaded at Accessed 7/19/ City and County of San Francisco Controllers Office, FY Development Impact Fee Report. November 30, Accessed 7/19/
200 City staff interviewed for this study remarked that while the City is not legally able to require developers to select one particular option to comply with the ordinance, construction of on-site units is the City s preferred option in most cases. 65 This is partially due to the challenge of using of Affordable Housing Fee funds in housing boom cycles, when land prices and construction costs are high, making affordable projects difficult to build. By imposing a smaller proportion of affordable units when constructed on-site, San Francisco s program incentivizes on-site construction of affordable units. Since the transition of the in-lieu fee to the Affordable Housing Fee in 2010 and realignment of the policy towards a fee-based program, 60 percent of projects approved by the Planning Department have elected to construct on-site units. Of those projects electing to provide onsite affordable units, a slightly greater proportion have built ownership units (54 percent ownership compared to 46 percent rental units.) 66 Approximately 34 percent of projects approved since 2011 have chosen to pay the Affordable Housing Fee and approximately three percent have sought a combination of units and fees. These program outcomes are summarized below. INCLUSIONARY PROGRAM OUTCOMES, Q Q Option Projects (a) Percent On-Site BMR Project % Fee Payment % Combination Project 4 2.9% Land Dedication 2 1.5% Units for Off-Site Project with Onsite Obligation 1 0.7% Units for Off-Site Project 1 0.7% Total % Note: (a) Based on the date of planning approval. Sources: San Francisco MOHCD, 2016; BAE, One case in which on-site units are not a preference are those in which luxury units have particularly high homeowners association fees that may ultimately make a technically affordable unit exceed allowable housing payments. 66 Based on a total of 83 projects that chose to provide on-site BMR units and received planning approval between 1/1/11 and 6/9/
201 OAKLAND AFFORDABLE HOUSING IMPACT FEE Background The City of Oakland had undertaken various efforts to study inclusionary housing ordinances prior to the City s recent adoption of an affordable housing impact fee in May For example, in 2000, a City Housing Task Force recommended that the City consider adopting an inclusionary housing policy, though the City did not act on the recommendation at that time. In 2006, the City Council established a Blue Ribbon Commission to study a proposed inclusionary ordinance, condominium conversions, and a comprehensive housing strategy, and formulate a set of recommendations. The Commission s final report was presented to Council in September Among other recommendations, the Commission recommended that the City adopt an inclusionary housing ordinance for new residential ownership developments. An economic feasibility report that was completed to inform the Commission s work found that development of rental housing was economically infeasible at the time even without an additional affordable housing impact fee, leading the Commission to elect not to recommend inclusionary requirements for rental projects. In late 2007, shortly after the release Blue Ribbon Commission s recommendations, the Oakland housing market began to experience the impacts of the recent recession, stalling the City s consideration of an inclusionary housing ordinance. However, in the past few years, Oakland s housing market, including the market for rental housing, has experienced a dramatic boom. Significant increases in housing costs and concerns about displacement have led housing advocates to call for affordable housing impact fees, particularly within the context of the City s recent adoption of four major Specific Plans. At roughly the same time, the City began to consider adoption of a transportation impact fee, causing City staff and Council members to call attention to the need for an affordable housing impact fee, along with fees for other capital improvements. In 2013 the City Council authorized funding for the affordable housing impact fee nexus study, which was completed in The Nexus Study analyzed seven types of residential development and found the maximum legal fees per unit of each type of housing to be as follows: Single-Family Homes Urban $34,833 Single-Family Homes Hills $81,729 Townhomes Urban $44,693 Townhomes Hills $53,258 Multifamily Lower/Mid-Rise $35,172 Multifamily Mid-Rise $39,887 Multifamily High-Rise $50,
202 Alongside the nexus study, the City commissioned an Economic Feasibility Study to evaluate the impacts of all three new impact fees (affordable housing, transportation, and capital facilities) on development feasibility. The study found that single-family homes and townhouses were feasible in most parts of Oakland, multifamily rental housing was marginally feasible without the new impact fees, and condominium development was not feasible even without the new fees. The Oakland City Council adopted substantially lower-than-maximum housing fees (see next section) on May The adopted fee schedule is effective on September 1, Fee Structure Oakland s affordable housing impact fee applies to all new residential units constructed in the City, regardless of the number of units in the project. The fee structure has different rates for each of three product types - multifamily, townhome, and single-family units - as well as different fees and phase-in schedules for each of three geographic zones. In the two geographic zones with stronger current residential market conditions, the fee will be phased in starting on September 1, 2016 and increasing on July 1, 2017 and July 1, The third zone, with a more moderate residential market, has a slower phase-in period. Starting on July 1, 2021, the fee will increase on an annual basis based on the Marshall & Swift building cost index. The adopted fee rates and phasing through July 1, 2020 are as shown in the table below. Affordable units and accessory dwelling units are exempt from the fee. OAKLAND AFFORDABLE HOUSING IMPACT FEE (PER UNIT) Sept. 1, 2016 July 1, 2017 July 1, 2018 July 1, 2019 July 1, 2020 Zone 1 Multifamily $5,500 $11,500 $22,000 $22,000 $22,000 Townhome $6,500 $12,000 $20,000 $20,000 $20,000 Single-Family $6,000 $12,500 $23,000 $23,000 $23,000 Zone 2 Multifamily $4,550 $9,250 $17,750 $17,750 $17,750 Townhome $2,600 $7,200 $14,250 $14,250 $14,250 Single-Family $3,750 $9,000 $16,500 $16,500 $16,500 Zone 3 Multifamily $0 $0 $3,000 $6,000 $12,000 Townhome $0 $0 $1,000 $4,000 $8,000 Single-Family $0 $0 $1,000 $4,000 $8,000 Sources: City of Oakland, 2016; BAE, Oakland s affordable housing impact fee is collected in two installments: half prior to issuance of a building permit for all or any part of the project, and half prior to issuance of a certificate of occupancy or temporary certificate of occupancy. The City has the ability to enforce payment of the fee by withholding building permits, recording a special assessment or other 132
203 lien against the property, revoking or suspending the certificate of occupancy or temporary certificate of occupancy, assessing civil penalties, or taking any other action necessary and appropriate to secure payment. Project applicants have the option to provide affordable units on- or off-site rather than pay the fee. Affordable units provided off site must be completed within 18 months of the issuance of a certificate of occupancy for the market-rate units, and in most cases must be located within one half mile of the market-rate project site. In order to qualify for a fee exemption, the project must provide ten percent of units to low- or moderate-income households or five percent of units to very low-income households. In effect, these provisions exempt projects that are developed pursuant to the State Density Bonus Ordinance from the fee. 67 The City enacted these provisions in part to encourage developers to apply for density bonuses to address a lack of developer interest in pursuing density bonus projects in Oakland. In addition, City staff and leadership are hoping that use of the density bonus will make it feasible for a larger number of developers to provide units on-site within market-rate developments. Applicants can also petition the City Manager for fee waivers or reductions on the basis that the fee would make a project infeasible and there are no feasible means of compliance, that the specific project will not generate a need for affordable housing (or only a limited need for affordable housing), or that the project has been subjected to atypical delays beyond the applicant s control due to litigation or similar circumstances. Once the fee is implemented, revenues will be deposited into Oakland s Housing Trust Fund and can be used to support primarily the development of units for very low- or low-income households; up to 15 percent of revenues can be used to support the development of moderate-income households. Outcomes Because the fee has not yet gone into effect, the program has not generated any revenue or units to date. Lessons Learned Stakeholder working groups are often essential to creating a feasible fee, but can be controversial. Oakland engaged a stakeholder working group comprised of housing advocates and developers in order to gain technical insight and ensure that the adopted fee rate would be feasible. City staff report that this process was essential to determine feasible fee rates. 67 Oakland s affordability requirements for fee exemptions differ slightly from the affordability requirements under the State Density Bonus Ordinance in that the State Density Bonus does not include provisions that allow for additional density for rental projects that provide units for moderate-income households, while Oakland s ordinance does allow fee exemptions for projects that provide moderate-income units. 133
204 However, the working group process did receive some negative media attention because meetings were not open to the public in order to ensure candid stakeholder input. Adopting different fees in different geographic areas can be politically controversial. The City of Oakland adopted different fee rates for each residential unit type based on three geographic zones. In general, the adopted fee rates and are lower and phased in more slowly in areas of the City that have experienced minimal recent developer interest in order to avoid the potential negative impacts of fees in areas with weaker real estate market conditions and encourage additional development in those areas. As the City began discussing the proposed fee rates with the public, some residents expressed dissatisfaction with the difference in rates on the basis that the differing rates send a message that the area with lower fee rates are not as desirable as other areas. Stakeholders have differing views on fee collection vs. units on site. Affordable housing advocates in Oakland generally supported policies that would encourage most developers to provide fee revenue rather than construct units on site. Because Housing Trust Fund revenue can be used to leverage other sources of affordable housing financing, many affordable housing developers and advocates prefer fee revenue on the basis that it can generate a larger total number of affordable units. However, City staff and elected officials developed fee exemptions for on-site units with the goal of encouraging a greater mix of incomes at both the project and neighborhood level, and therefore adopted less stringent requirements for onsite units than many housing advocates requested. The City expects some developers to elect to pay the fees regardless of exemptions for on or offsite units due to the relative simplicity of providing the fee or economic feasibility considerations specific to each project. Notably, some areas of Oakland have no height or density limits, thereby negating any potential benefit of a density bonus that would be provided in exchange for affordable units. Eligible activities for fee expenditures should be related to nexus study methodology. Affordable housing advocates lobbied to have all affordable housing fee revenues dedicated to support units serving lower-income households. In contrast, due to high market-rate housing costs, Oakland City staff and elected officials identified a need to also serve moderate-income households. Consequently, the City adopted policies that would allow up to 15 percent of housing impact fee revenue to support moderate-income units. Adopting a charge based on square footage can lead to different outcomes than per-unit charges. The City of Oakland s adopted fees are charged on a per-unit basis, despite prior consideration of a fee that would be based on square footage. In part, the City decided on a per unit fee because developers often make a larger profit on a per-square-foot basis for smaller units. A per-unit fee effectively results in a higher fee rate per square foot for smaller units than for larger units, thereby capturing a larger share of any excess profit from smaller units relative to larger units, which may have lower profit margins. Perhaps more importantly, 134
205 the City has identified a need for increased construction of larger multifamily units, and therefore sought to avoid charging higher fees for larger units. 135
206 SACRAMENTO HOUSING IMPACT FEE Background In 2005, housing advocates pushed for making inclusionary housing requirements citywide. (The 2000 regulations on inclusionary housing concerned only certain growth areas.) A new council member elected in District 1 (with one of the growth areas) also wanted a fairer distribution of affordable housing units. The Housing Element update of 2008 put the shift to city-wide affordable housing policy on paper. The Palmer and Patterson decision and the loss of the Redevelopment Agency both forced the city to look for new ways of producing affordable housing or revenue for affordable housing. A linkage fee was chosen. Keyser Marston did a nexus study in 2015, and a new ordinance was passed in the summer of that year. Fees go into the Housing Trust Fund that was created in 1989, for the commercial impact fee program. The Mixed Income Housing ordinance was enacted on Sept. 1, Fee Structure The fee structure shown below aims to foster higher densities of development and to steer development into specific locations: the fee of $2.58 per square foot is waived for high-density housing and greatly reduced in a Housing Incentive Zone (see figure on next page). SACRAMENTO HOUSING FEES Type Fee Per Square Foot Single/Duplex $ 2.58 High Density Single/Duplex (a) $ - Multi-Unit Dwelling $ 2.58 High Density Multi-Unit Dwelling (b) $ - Nonresidential to Residential Conversion $ - DU in Housing Incentive Zone $ 1.11 Notes: (a) "High Density" single/duplex is defined as 20 dwelling units or more per acre. (b) "High Density" multi-unit is defined as 40 dwelling units or more per acre. Sources: City of Sacramento, 2016; BAE, Effective 11/1/2015 The Housing Incentive Zone (HIZ) is made up of areas where the market supplies housing that is actually affordable. The reduction in the fee represents an incentive to build there and helps to keep prices affordable. The ratio of HIZ fee to citywide fee is the same as the ratio of the median home price in the HIZ to the median home price in the rest of the city. 136
, several categories of project are exempt, including mobile home parks, development projects with at")

207 Note that for projects on parcels larger than 100 acres in area, the developer, in addition to paying impact fees, must gain approval of a mixed income housing strategy in the project. Aside from grandfathered projects (with varying conditions according to the type of the project), several categories of project are exempt, including mobile home parks, development projects with at least 10 percent of affordable units, a new single-unit dwelling built by an owner-builder on his/her property (under certain conditions), a secondary dwelling unit, uninhabitable square footage without conditioned air, and community rooms for residential developments.68 SACRAMENTO HOUSING INCENTIVE ZONES Increases occur annually, on July 1, according to the San Francisco Construction Cost Index. Fees are collected prior to (and as condition for) the issuance of the building permit. No provisions exist for the deferral of fees (but see below, planned revisions) and no provisions exist for refunds. However, as long as the monies have not been transferred into the Housing Trust Fund itself, it should be possible for a developer who decides not to build to negotiate a refund. According to staff interviewed for this report, there is little interplay between the fee program with the density bonus program, because the current zoning code is very permissive in terms of densities. Only two bonuses have been awarded in the last 20 years. 68 Sacramento City Code, section Exempted development projects. 137
208 Fees accrue to the Housing Trust Fund, founded in 1989 (when the commercial linkage fee program was initiated. The objective of the Housing Trust Fund is to increase and improve the supply of housing affordable to households of low income, with priority given to very low income households. 69 Low income is defined as being below 80% of countywide median income; very low income is defined as below 50% of median income. Housing that is financed by the Housing Trust Fund does not include housing for the homeless and housing dedicated to seniors. Outcomes Since Sept. 1, 2016, only about $30,000 has been collected. This small amount can be explained by three factors: the limited time since the adoption of the ordinance; the fact that many projects were already in the pipeline at the time of adoption; the fact that many projects are at densities or in locations that make them exempt from the fee. No affordable housing units have been produced. Lessons Learned The requirement to pay the whole housing linkage fee upfront is a burden to developers. Council is currently studying a fee deferral ordinance, to enable developers to pay housing linkage fees over a certain amount of time. The fees apply to all housing projects in which units are market-rate, i.e., not restricted to an affordable housing price or affordable rent. 70 This includes projects such as those built by Habitat for Humanity, in which owners invest sweat equity. The Planning Division would like to amend definitions so as to exempt such projects. Planners also would like to clarify the ways in which fees are assessed on multi-use projects or projects with different forms of tenure. Finally, the price differential between market-rate housing in the Housing Incentive Zone and housing elsewhere in the city needs to be monitored, to know whether the ratio of HIZ fee to regular fee is still correct. 69 Sacramento City Code, section Low income housing fund. 70 Sacramento City Code, section Definitions. 138
209 SAN JOSE AFFORDABLE HOUSING IMPACT FEE Background The City of San Jose wanted to have additional tools to implement some of its housing policy goals (as spelled out in the Housing Element of its General Plan), in particular the objective to have 15 percent of new residential units be affordable units. Other goals served by the provision of affordable housing is a better jobs-housing balance and reduced pressure on traffic, and the attraction and retention of employees by the city s businesses. 71 A nexus analysis was prepared in 2014, and a new regulation was passed by City Council later that year. The Affordable Housing Impact Fee ordinance will take effect on July 1, The Affordable Housing Impact Fee applies only to rental housing projects in large part because the Palmer decision limited the City s ability to generate revenue for affordable housing through in-lieu fees on rental development as part of its Inclusionary Housing Policy. San Jose s Inclusionary Housing Ordinance was adopted in 2010 (though it will take effect only this year, after a long legal battle). Legally distinct from the in-lieu fee, the Affordable Housing Impact Fee is an alternative mechanism to increase the City s supply of both affordable rental and ownership units. Fee Structure Fees apply to all market-rate rental developments (i.e., not to homeownership projects). Floor areas on which the fee is calculated are the residential areas of units (i.e., not including balconies, loggias, etc. or common areas in buildings). Two categories of projects exist: Rental Development and Downtown High Rise Rental Development. The latter are projects in the Downtown Core Area in which the highest occupied floor is 150 feet or more above street level. The fees are $17.00 per square foot for both categories. (The two categories of projects reflect the categorization that exists in the Inclusionary Housing Ordinance, where downtown high-rise buildings had a lower in-lieu fee.) It is also noteworthy that the fee on rental units is the same as the in-lieu fee per the inclusionary program charged on for-sale units. 72 Exemptions to the fee include pipeline projects, downtown high-rise projects which obtain a certificate of occupancy by July 1, 2021, and projects for which the developer is able to demonstrate no impact or standard violations of the US Constitution or California Constitution City of San Jose, Resolution No , A Resolution of the Council of the City of San Jose Adopting a Housing Impact Fee, available at last accessed on June 1, This equality is due to the fact that the nexus study gave a range of possible levels for the impact fee and that $17.00 per square foot was within that range and seemed to all to be a good compromise. 73 City of San Jose, Resolution No , Section 11, par. A. 139
210 Fees are adjusted annually at a fixed rate of 2.4 percent. In addition, the resolution allows the City to adjust the fee schedule from time to time if conditions change, such as an economic downturn. Fees must be paid prior to issuance of the building permit. Developers may petition the Director of Housing of the City to delay payment of the fees to the time of delivery of the Certificate of Occupancy or the date of the final inspection if the City is not yet able to spend impact fees. A Housing Impact Fee Fund was set up to manage the monies collected. It can be used to purchase affordable housing, finance the development of affordable housing, or to acquire affordability covenants. This fund is different from the Affordable Housing Fund set up with the adoption of the Inclusionary Housing Policy in 1988 (revised 2010). The City has prepared an Expenditure Plan for Housing Impact Fee Revenue based on the nexus study of 2014 and demographic projections from ABAG. Outcomes The program has not yet generated fees. The City received 34 applications for exemptions as pipeline projects. Lessons Learned The ordinance was produced on the basis of a robust consultation process, in which developers and the public were heard. This produced a good compromise (e.g., 5-year exemption for downtown high-rise rental projects, but the same fee of $17.00 per square foot fee as on rental projects elsewhere), and provided solid support when City Council voted on the ordinance. 140
211 SANTA MONICA AFFORDABLE HOUSING PRODUCTION PROGRAM Background In 1990, Santa Monica voters approved Proposition R, which required that at least 30 percent of all housing units produced in any given year be affordable to low- and moderate-income households. Other ordinances were adopted over the years, including the Affordable Housing Production Program (AHPP) in The current ordinance took effect in May 2006 and was revised in June Santa Monica s inclusionary housing policy mandates that 20 to 25 percent of market-rate units on-site, or 25 percent more than the on-site requirement for inclusionary units built offsite, be made affordable to low- and moderate-income households, depending on tenure and project size. The current residential Affordable Housing Fee originated from the option for residential developers to pay an in-lieu fee, rather than constructing affordable units, to satisfy the requirements of the AHPP. Fee Structure In-lieu fees are required for all rental projects, irrespective of the number of units 74 As an option for rental projects, a developer of a project with two or more units may dedicate land to the City or to a non-profit housing developer, sell either party land below market rate, or pay for an option on a piece of land. In all of these land options, the developer s loss or investment must equal the fee amount. Fees can also be an option for or-sale projects that contain two or three units. For-sale projects with four or more units must provide affordable units either on- or off-site. Currently, the Unit Base Fee is $31.25 per square foot for rental projects and $36.51 per square foot for condominium projects. 75 Exemptions in addition to pipeline and other standard exemptions include single-unit projects, and designated landmark buildings or structures that are part of a historic district (fee only applies to new structures on site). Fees are reviewed annually and are set by Council. Increases are based on changes in construction costs and on changes in land costs in the past year. The former are assessed by means of the relevant Construction Cost Index published by the Engineering New Record; the 74 City of Santa Monica, Affordable Housing Production Program, at Housing_and_Redevelopment/Housing/Production_Program_(Inclusionary)/AHPP.aspx, last accessed on June 5, In the Municipal Code that is available on the web at this time (June 5, 2016), there is no differentiation between condominium and apartment projects. 75 City of Santa Monica, Fee Affordable Housing, available at Housing_and_ Redevelopment/Housing/Fee_-_Affordable_Housing/Fee_-_Affordable_Housing.aspx 141
212 latter are determined by data on the median condominium prices in the city. The precise methodology for revising the Affordable housing unit base fee is described in internal guidelines, the latest version of which was approved by Council in April Fees must be paid between issuance of the first building permit and issuance of the certificate of occupancy. No certificate will be issued without fees having been paid. Fees are deposited a reserve account separate from the General Fund, and are to be used only for development of affordable housing, administrative costs related to the production of this housing, and monitoring and evaluation of this affordable housing production program. 77. Fees must be used within five years of payment or approval of the project, whichever occurs later. An interesting enforcement mechanism has been adopted to manage the fee program: If fees are not used in the five-year time period, they will be returned to all developers who paid fees during the relevant five-year period, on a pro-rata basis. The City of Santa Monica has also adopted an extensive Land Use and Circulation Element of the General Plan (LUCE), which provides for density bonuses in exchange for providing affordable housing along with an array of other incentives to direct denser development to certain locations. However, these provisions have been in flux in the past several years, with changes to implementing policies (not detailed herein). Outcomes Approximately $17 million has been received as in-lieu fees between 1998 and City of Santa Monica Housing Division, Affordable Housing Production Program Administrative Guidelines (Pursuant to Chapter 9.64 of the Municipal Code), April 12, 2016, available at HED/Housing_and_Redevelopment/Housing/Production_Program_(Inclusionary)/AHPP_Administrative_Guidelines_ pdf, last accessed on June 5, Santa Monica Municipal Code, Section : Affordable Housing Fee, paragraph F. 78 This sum was obtained by adding in-lieu fees reported in the annual Housing Reports of the City of Santa Monica, available at Reports.aspx, last consulted on June 7, The exact sum is $16,863,380. It was obtained by adding (1) fees collected in the first half of 1998 and in fiscal year from all projects approved in that time period, (2) fees collected in fiscal years to for all projects completed in that time period, and (3) fees collected in fiscal year from all projects completed, under construction or approved in that year. 142
213 WEST HOLLYWOOD AFFORDABLE HOUSING IMPACT FEE Background Established in 1986, West Hollywood s original Inclusionary Housing Program required developers to construct at least one unit affordable to low- or moderate-income households for projects with ten or fewer units and 20 percent affordable units in projects with over ten units. 79 Only projects of ten or fewer units have historically had the option to pay an Affordable Housing Fee in-lieu of providing units. Subsequent to Palmer/Sixth Street Properties, L.P v. City of Los Angeles (2009), the City modified its inclusionary program by expanding the in-lieu fee option to rental projects of any size, provided the project does not utilize the State Density Bonus program or any other form of assistance described in Section of the California Civil Code. Condominiums, cooperatives, and apartments constructed using the Density Bonus program or other forms of assistance are still required to construct inclusionary units. 80 In 2014 the City commissioned a residential nexus study to ensure that even if such requirements faced legal challenge, the requisite fees would survive the reasonable nexus test. 81 The Nexus Study prepared in 2014 confirmed that the in-lieu fee charged as part of the City s inclusionary program is supported by the analysis of all three residential prototypes studied. Nevertheless, the City is in the process of converting the Inclusionary Housing Ordinance into a Residential Affordable Housing Impact Fee program to establish consistent fee requirements for all residential development, regardless of tenure, and reduce the opportunity for legal challenge. While inclusionary units are still required of condominiums, cooperatives, and apartments constructed with a density bonus, this section describes the Residential Affordable Housing Fee as it applies to rental projects constructed without a density bonus or other form of financial assistance. 79 City of West Hollywood, Housing Element. December PDF. Accessed 7/14/ City staff expressed that while their program has faced legal challenge, it has withstood such scrutiny due to the fact that the court s ruling in the Palmer case was that density bonuses and other types of incentives qualify as direct financial contribution or any other [form] of assistance specified in CA Civil Code Section (Density Bonus Program), therefore exempting development projects utilizing such incentives or assistance from the requirements of the Costa-Hawkins Rental Housing Act (CA Civil Code Section ). 81 West Hollywood Department of Human Services and Rent Stabilization, Non-Residential Jobs-Housing Nexus Study and Residential Nexus Study. December 15, 2014 City Council Agenda Report. 143
214 Fee Structure In general, all residential development projects are required to either construct inclusionary units or pay the Affordable Housing Fee, with the exception of new single family dwelling units or the replacement of one single family dwelling with another single family dwelling, and projects developed, owned, or operated by a nonprofit housing provider (including residential care facilities), where all units are exclusively for low- or low- and moderate-income persons. 82 The City provides density bonuses in excess of what is currently required per State law, allowing a maximum density increase of up to 100 percent the maximum density permitted by the underlying zone, subject to conditions of approval. In addition, the Inclusionary Housing Program offers concessions to developers including modified development standards such as height limits, setback, and open space requirements, in addition to reduced parking requirements. If a density bonus or other financial incentives are utilized, developers are required to construct inclusionary units (with an option to construct a greater proportion of inclusionary units off-site) and comply with the development standards as described in Chapter of the West Hollywood Municipal Code. The amount of the Affordable Housing Fee depends on project size (in terms of the number of units) and calculated based on the square feet of gross livable area (GLA) (including balconies and porches, but excluding parking.) Projects with 10 or fewer units pay a fee per square foot of GLA based on the sliding scale shown below. Projects with greater than ten units are required to pay a fee of $27.13 per square foot of GLA. Note that the figures in the table below reflect current amounts for the fiscal year. WEST HOLLYWOOD AFFORDABLE HOUSING IN-LIEU FEES Fee per Project Size Square Foot 2 Units $ Units $ Units $ Units $ Units $ Units $ Units $ Units $ Units $27.13 Sources: City of West Hollywood, 2016; BAE, The adopted Affordable Housing Fee is a fraction of the maximum fees supported by the 2014 Residential Nexus Study. The Nexus Study arrived at a maximum supportable per square foot 82 West Hollywood Municipal Code, Chapter (Affordable Housing Requirements and Incentives). 144
215 fee of $33.00 for small condo projects, $40.30 for medium rental projects, and $47.20 for large rental projects. The Affordable Housing Fee is adjusted based on changes in the Construction Cost Index (CCI) and adopted annually by the City Council. Fees must be paid in full upon issuance of a building permit for all units incurring the fees. If the project consists of multiple detached units, fees for the whole project must be paid before building permit issuance. Currently, there is no option for fee deferral. Impact fees are generally nonrefundable; however, funds may be issued if the building permit expires and is not extended or if the fees were collected illegally or erroneously. To request a refund, applicants must file a written request with the City no later than 90 days after the initial payment date to be considered. 83 Outcomes Revenue generated by the Affordable Housing Fee is deposited into the City s Affordable Housing Trust Fund. In fiscal year , the Affordable Housing Fee generated approximately $1.3 million. 84 Established in 1986, the Affordable Housing Trust Fund receives funds from residential and commercial development impact fees, as well as settlement funds. Funds are used exclusively for projects that include a minimum of 20 percent of the total units affordable to low income households and at least 60 percent affordable to low- and moderate-income households. Taxexempt, non-profit corporations are eligible to apply to receive funds from the Affordable Housing Trust Fund which may be used for predevelopment costs, land or air rights acquisition, administrative costs, gap financing, or to lower the interest rate of construction loans or permanent financing. As of June 20, 2015, loans disbursed from the Affordable Housing Trust Fund and the Housing Asset Fund to qualified non-profit housing and community development corporations had an outstanding balance of $28,996, The City does not have an updated estimate of the funds generated by the Residential Affordable Housing Fee or the number of units constructed by the program. City staff expressed a desire to maintain records of this progress in the future. Lessons Learned Of the case study areas analyzed, the City of West Hollywood s detailed sliding scale for smaller projects is unique; this approach lessens the burden of impact fees on small projects. 83 West Hollywood Municipal Code, Chapter (Development Fees). 84 City of West Hollywood, Comprehensive Annual Financial Report. Fiscal Year Ending June 30, Accessed 7/14/16. Page City of West Hollywood, Comprehensive Annual Financial Report. Fiscal Year Ending June 30, Accessed 7/14/16. Page
216 SANTA ANA INCLUSIONARY IN-LIEU FEE Background The Housing Opportunity Ordinance was adopted in 2011 to support implementation of the 2009 Housing Element Update. Other major land use changes underway in the City of Santa Ana at the time, including major rezoning of large industrial areas (Transit Zoning Code) and for the Harbor Boulevard Corridor, underscored the need to address affordable housing as well. Santa Ana s inclusionary housing policy is contained in the Housing Opportunity Ordinance and requires that 15 percent of new, market rate residential projects consisting of five or more units be made affordable on-site to very low- or low-income households. Rather than constructing affordable units, developers may opt to pay an in-lieu fee, whose revenues are collected in an Inclusionary Housing Fund and used to produce affordable housing. It is important to note that the Ordinance applies only to three types of projects: (1) housing developments that exceed the density otherwise available under applicable zoning and development standards, (2) projects that require a change in land use classification from a land use that does not permit residential uses to one that does, and (3) the conversion of rental units to condominiums. 86 Fee Structure The in-lieu fee varies by size of project, from $5.00 per square foot for projects with 5 to 20 units, to $15.00 per square foot for projects with over 20 units. This fee is applied only to the number of units that exceed land use density regulations allow at the time of the application. The fee is also used to deal with fractions of units that are normally required but are not included among those being built on-site or off-site. The structure of the in-lieu fee has changed over time, with a recent shift to a higher fee per square foot on smaller projects because City Council realized that it is difficult for smaller projects (less than 20 units) to incorporate affordable units within them, so a fee payment is preferable. Aside from pipeline projects and projects subject to California statues, projects with fewer than five units are exempt from the inclusionary requirement and thus the fee. In addition, the ordinance exempts conversion or adaptive reuse projects that change the use of the property from non-residential to residential; this exemption is provided in recognition of the fact that conversion and adaptive reuse projects are often made very expensive by code upgrades 86 City of Santa Ana, Affordable Rental Housing Administrative Procedures. January PDF. Accessed 8/9/
217 The fee is due at issuance of the building permit. In the case of mixed-use projects, the rule applies even if the first building permit concerns only the non-residential portion of the project. Outcomes Fees are deposited in an Inclusionary Housing Fund, and combined with other affordable housing funding sources. Uses of in-lieu and other Trust funds can be used for rental or ownership projects. The ordinance contains a provision that invites developers paying the fees to provide input into their use, which according to staff interviewed for this study, is present to prevent political pressure from directing the affordable housing funds to a particular project or affordable housing developer. As of June 2016, $4,302,000 has been received. So far, $1,875,000 has been committed to a project with 64 units. 147
218 PALO ALTO BELOW MARKET RATE HOUSING PROGRAM Background Palo Alto s Below Market Rate (BMR) Housing Program was implemented in 1974, concurrent with the City s first receipt of Community Development Block Grant funding, to increase the City s supply of affordable housing. 87 Like other cities with inclusionary housing programs that predate the Palmer decision, Palo Alto is in the process of converting its residential inclusionary in-lieu fee to an impact fee supported by a reasonable nexus. In 2014, the City completed both residential and commercial nexus studies to determine the maximum legal fees justified by the impact of market-rate residential development in the City. The City s existing BMR Housing program, adopted in 2008, is contained in Chapter of the Municipal Code. The policy requires developers of projects with five or more units to construct 15 percent of units in the principal project as BMR units, or pay an in-lieu fee. Today this requirement applies only to ownership housing units, unless the developer agrees by contract to restrict rents in exchange for financial incentives such as a density bonus. Rental projects were once subject to this requirement before the 2009 California Court of Appeal ruled, in Palmer/Sixth Street Properties L.P. v. City of Los Angeles, that the application of inclusionary housing requirements and associated in-lieu fees on rental residential development was a violation of the Costa-Hawkins Rental Housing Act. In 2014, the City completed a residential nexus study to transform the in-lieu fee into a market-rate residential affordable housing impact fee. Palo Alto s home prices and rental rates surged during its recovery from the Great Recession. A 2016 staff report explains that, Since 2010 the purchase price of an average priced home in Palo Alto has increased 259% from $900,785 to $2,337,500. Rental costs have also skyrocketed from an average of $1,695 in 2010 to $3,105 in Combined with the Palmer decision, these factors formed the impetus for the City to undertake commercial and residential nexus studies to establish impact fees and generate revenue for affordable housing. Fee Structure Historically, the City has imposed an inclusionary in-lieu fee equivalent to 7.5 to 10 percent of the sales price for market-rate single-family detached, single family attached, and condominiums. Following the results of recent nexus studies, the City has adopted flat fees per unit, rather than the existing percentage of sales price, that will take effect on August 15, City of Palo Alto Finance Committee, Residential/Commercial Impact Fee Studies Staff Report. February 16, Accessed 7/19/ City of Palo Alto Finance Committee, Residential/Commercial Impact Fee Studies Staff Report. February 16, Accessed 7/19/16. Page
219 Both the existing and adopted fees are shown in the table below. PALO ALTO RESIDENTIAL FEES Unit Type Existing Fee Adopted Fee (a) Single Family Detached 7.5 to 10% of sales price $95/sf Single Family Attached 7.5 to 10% of sales price $50/sf Condominium 7.5 to 10% of sales price $50/sf Rental Housing None $50/sf Note: (a) Adopted fee schedule is effective August 15, Sources: Palo Alto Planning and Community Environment Department, 2016; BAE, Revenues generated by the affordable housing impact fee are collected in the City s Residential Housing Fund, a sub-fund of the City s Affordable Housing Fund, a trust fund that exists to preserve and expand affordable housing for very low-, low-, and moderate-income households. Other sub-funds of the Affordable Housing Fund include the Commercial In-Lieu Fund, Home Investment Partnership Fund, Community Development Block Grant (CDBG), and Below Market Rate Emergency Fund. Detailed guidelines dictating the use of Affordable Housing Fund are posted on the City s website. According to these guidelines and the City s Notice of Funding Availability application, specific restrictions apply to the use of funds in each sub-category. Fees generated by the Residential Housing Fund may be used for the following: Construction of new housing units; Addition of new units to existing buildings; Conversion of non-residential space to housing units; Acquisition, rehabilitation, and preservation of existing affordable housing, where rents are controlled by deed restriction or another similar mechanism; Administrative costs of operating the BMR housing program. 89 There is currently no limit on the amount of funding that can be allocated to a single development. 90 Established in 2002 and distinct from the Residential Affordable Housing Fund, the Below- Market Rate Emergency Fund is used chiefly for activities necessary to preserve existing BMR housing by providing assistance such as deferred payment, low interest loans in the event that an owner of BMR housing faces severe financial hardship in paying major capital assessment on condominiums (not including monthly homeowners dues), acquiring units in 89 City of Palo Alto, Affordable Housing Fund Guidelines. August 17, PDF. Accessed 7/21/ City of Palo Alto, Notice of Funding Availability. May 20, PDF. Accessed 7/21/
220 foreclosure, repairing and reselling BMR units acquired by the City, or issuing short-term loans to rehabilitate older BMR housing stock. 91 Outcomes In Fiscal Year , $19,800 in housing in-lieu fees was collected and deposited into the City s Residential Housing In-Lieu Fund, which as of June 30, 2015 had an ending balance of approximately $17.6 million. 91 City of Palo Alto, Affordable Housing Fund Guidelines. August 17, PDF. Accessed 7/21/16. Page

221 PASADENA INCLUSIONARY HOUSING ORDINANCE Background Pasadena s Inclusionary Housing Ordinance was adopted in The policy requires either that 15 percent of all newly constructed, market-rate residential units be made affordable to low- and moderate- income households and constructed on-site, or payment of a fee based on project size and tenure, and assessed per square foot. As with most inclusionary housing ordinances in California, the residential fee was originally established as an option in-lieu of producing the required number of affordable units. After the California courts limited mandatory unit production in the case of market-rate rental units, Pasadena revisited its rental housing in-lieu fee. In 2015 the City commissioned an Affordable Housing In-Lieu Analysis to recalculate the fee based on the affordability gap between the cost of market-rate housing units and the price that a low- or moderate-income household could afford to pay. 93 The City is currently considering raising its ordinance requirements based on a recent nexus study presented to City Council in April Fee Structure Inclusionary requirements and in-lieu fees vary by zone, with the four zones also varying slightly by tenure (rental vs. ownership projects) as shown below. PASADENA INCLUSIONARY HOUSING ZONES Source: City of Pasadena: sites/3/2016/04/city-presentation-april pdf 92 City of Pasadena, Ordinance #6868, An Ordinance of the City of Pasadena Amending Title David Paul Rosen and Associates, Pasadena Affordable Housing In Lieu Fee Analysis. March 10, PDF. Accessed 8/9/16. Analysis-.pdf. 151
222 Current and proposed fees as of April 2016 are shown below: PASADENA CURRENT AND PROPOSED IN-LIEU FEES Fee Per Square Foot FY 2016 Rate Proposed Rate Rental Units Sub-area A $ - $ Sub-area B $ 1.14 $ Sub-area C $ $ Sub-area D $ $ Rental Units Sub-area A $ - $ Sub-area B $ 1.14 $ Sub-area C $ $ Sub-area D $ $ Ownership Units Sub-area A $ $ Sub-area B $ $ Sub-area C $ $ Sub-area D $ $ Ownership Units Sub-area A $ $ Sub-area B $ $ Sub-area C $ $ Sub-area D $ $ Sources: David Paul Rosen and Associates; 2016, BAE, Projects with fewer than 10 units are exempt from the Inclusionary Ordinance. Half of the fee is due prior to obtaining the first building permit, with the balance due prior to obtaining a certificate of occupancy. Fees accrue to the Inclusionary Housing Trust Fund. There are no guidelines or limitations on the use of the fees collected. Outcomes The total amount collected between 2001 and April 2016 was $19.6 million. 94 Fee revenues have varied dramatically year by year: revenue dropped from about $5,000,000 in 2006 to about $100,000 six years later, during the Great Recession. These fluctuations have spurred the City to consider other options currently, including a commercial fee. 95 As of 2016, Pasadena reports that there have been 1,507 city-funded affordable units produced. 94 City of Pasadena, Affordable Housing Workshop: Pasadena Inclusionary Housing Ordinance (presentation by Jim Wong, Senior Project Manager, April 12, 2016), p. 7, available at sites/3/2016/04/city-presentation-april pdf, last accessed on June 6, City of Pasadena, City Council Affordable Housing Workshop (PowerPoint presentation by William Huang, Director of the Housing Department, January 11, 2016 ),available at ww2.cityofpasadena.net/councilagendas/2016%20agendas/ Jan_11.../ AR%2014.ppt, last accessed on June 6,

223 BOSTON INCLUSIONARY DEVELOPMENT IN-LIEU FEE Background An executive order created the Boston inclusionary housing policy in The policy allowed for in-lieu fees: instead of including a number of affordable units equivalent to 10 percent of the total number of units in the project, the developer could pay a fee of $52,000 per unit on a number of units BOSTON INCLUSIONARY DEVELOPMENT ZONES equivalent to 15 percent of the total number of units in the project. In 2003, a revision required that an in-lieu fee also be paid for the fraction of affordable unit that was not built when the number of affordable units was rounded off to the nearest lower number. The program has been revised several times to improve implementation since its inception. The Inclusionary Development Program (IDP) applies to all residential projects that have ten units or more that are financed by the City, that are located on land that belongs to the City or to the Boston Redevelopment Authority, or for which zoning relief is sought. Fee Structure Fees vary by location and by tenure. The territory of the city was divided into three Source: City of Boson, Inclusionary Development Policy, Exhibit B zones: Zone A comprise neighborhoods whose median value of a square foot of residential living area is in the top third of city valuations; Zone B has neighborhood medians close to the city average; and Zone C has neighborhood medians in the bottom third of city valuations. Different fees apply in each zone. Contributions for rental projects are $380,000 per unit for projects in Zone A, $300,000 per unit for projects in Zone B, and $200,000 per unit for projects in Zone C. These unit costs are called Zone Factors. The number of units on which the IDP Contribution is calculated is 18 percent of the total number of units for projects in Zone A and in Zone B and 15 percent in Zone C. The total contribution is therefore Zone Factor X number of units. 153
224 Contributions per unit for homeownership projects are the highest of two figures: the Zone Factor or 50 percent of the difference between the market rate price and the affordable price for each unit type. The number of units is the same as for rental projects: 18 percent of total project units in Zones A and B, 15% in Zone C. Note that an in-lieu contribution is also required in cases where affordable units are built on site to compensate for the loss of a fraction of an affordable unit in the project. For example, if the number of affordable units that is required is 7.35 and 7 units are built, the developer owes 35 percent of the in-lieu fee for a unit. Exemptions include grandfathered projects, projects in which 40 percent or more of the units have income restrictions or are otherwise protected as affordable units, and dormitories. There are no automatic fee increases; the unit factor was first set at $52,000, raised to $97,000 in 2005, and then to $200,000 in The 2006 revisions included a provision that contributions for rental projects could be paid in seven annual installments rather than all at once. The fee structure was amended again in 2015, to its current status. Developers of rental housing may pay the IDP Contribution in 7 annual installments or all at once (using the current yield of a 10-year Treasury bond to calculate NPV). The first installment is due within 30 days of receipt of the initial full building permit. Developers of ownership projects must pay 25 percent of the IDP Contribution based on Zone Factors within 30 days of receiving the building permit and the remaining 75 percent within 30 days of receiving the Certificate of Occupancy for their project. Fees normally go into the IDP Fund. However, developers may ask that some or all of their IDP Contribution be used to finance an affordable housing project in the vicinity of their own development project. Outcomes Between 2000 and 2015, $119,700,542 was generated by in-lieu IDP Contributions. About $80,000,000 were already collected at that time, and the remainder was committed but not collected. An additional $22,176,190 was estimated to be in the pipeline, from projects that had been approved by the Boston Redevelopment Authority but had not yet been granted a development permit. 96 In the same time period ( ), contributions helped to build 1,597 new affordable housing units. Of these, 1,215 units were for low-income households (< 60% AMI) and 382 units were middle-income households (60% - 120% AMI) Ibid. 97 Ibid. 154
225 Lessons Learned The City would like a maximum number of projects to be built with affordable housing units onsite. Developers prefer either building off-site units or paying in-lieu fees. City staff reports that most projects chose a combination of units and fees. Staff are currently considering revisions or clarifications on a number of elements of the ordinance including: The provision that allows developers to identify a specific project to target their in-lieu fees; because fee payments may be made in 7 years, this provision raises a serious problem for the financing of the affordable housing project. If the developer does not pay all fees upfront (with NPV calculation), the City must utilize the IDP fund to finance the affordable housing project and then use future fee payment to repay the IDP The distribution of monies to affordable housing projects; more emphasis on unit preservation vs. new construction may be needed. New units are generally in less attractive locations with fewer services, and preservation may also be cheaper in some cases. 155
226 EAST RIVER RD 8800 W CUMBERLAND AV 8400 W PACIFIC AV 8000 W HARLEM AV 7200 W NARRAGANSETT AV 6400 W CENTRAL AV 5600 W STATE ST 0 E/W ASHLAND AV W HALSTED ST 800 W COTTAGE GROVE AV 800 E STONY ISLAND AV 1600 E YATES AV 2400 E BRANDON AV 3200 E HARLEM AV 7200 W CICERO AV 4800 W KOSTNER AV 4400 W NAGLE AV 6432 W AUSTIN AV 6000 W CENTRAL AV 5600 W LARAMIE AV 5200 W CICERO AV 4800 W PULASKI RD 4000 W PULASKI RD 4000 W CENTRAL PARK AV 3600 W KEDZIE AV W KEDZIE AV 3200 W CALIFORNIA AV 2800 W WESTERN AV 2400 W WESTERN AV 2400 W STEWART AV 400 W DR MARTIN LUTHER KING JR DR 400E WOODLAWN AV 1200 E JEFFERY AV 2000 E MUSKEGAN AV 2838 E EWING AV 3634 E RACINE AV 1200 W LARAMIE AV 5200 W AUSTIN AV 6000 W ORIOLE AV 7600 W ORIOLE AV 7600 W KOSTNER AV 4400 W CENTRAL PARK AV W CALIFORNIA AV 2800 W CHICAGO AFFORDABLE REQUIREMENTS ORDINANCE Background Chicago adopted the first version of the Affordable Requirements Ordinance (ARO) in A few years later, as the market grew stronger and affordable units lost to new development increased, community groups pushed for stronger inclusionary requirements and Mayor Daley supported their goals. A much stronger ordinance was adopted in 2007, which started to generate more in-lieu fees (see Fees collected since inception, below). After the Great Recession, a new market upswing provoked a new push for generating affordable housing funding. Thus in 2015, requirements were strengthened again in order to generate more inlieu fees. Fee Structure The fees are differentiated in several ways. First, they are differentiated geographically, according to local market conditions. Where the market is strongest ( Downtown ), the fees are highest. Lower fees are charged in medium strength markets (e.g., Higher Income areas, with low poverty rates), and still lower fees are charged in areas where markets are weakest (e.g., Low-Moderate Income areas, with high poverty rates). This scale is viewed as an incentive for developers to invest in Low-Moderate Income areas. A simplified map of the three zones will be updated every five years, based on new census data. CHICAGO ZONE MAP 76 CHICA GO O'HARE INTERNATIONAL AIRPORT COMMUNITY AREA NAMES 1. Rogers Park 2. West Ridge 3. Uptown 4. Lincoln Square 5. North Center 6. Lake View 7. Lincoln Park 8. Near N orth Side 9. Edison Pa rk 10. Norwood 11. Jefferson Park 12. Forest Glen 13. North Park 14. Albany Park 15. Portage Park 16. Irving Park 17. Dunning 18. Montclare 19. Belmont Cragin 57. Archer Heights 20. Hermosa 58. Brighton Park 63RD ST S Avondale 59. McKinley Park 22. Logan Square 60. Bridgeport Humboldt Park 61. New City 65 Second, the fees are differentiated 71ST ST 24. West Town 62. West Elsdon 7100 S 25. Austin 63. Gage Park West Garfield Park 64. Clearing 27. East Garfield Park 65. West Lawn 28. Near West Side 66. Chicago Lawn 79TH ST North Lawndale 67. West Englewood 7900 S 30. South Lawndale 68. Englewood according to tenure in the Lower West Side 69. Greater Grand Crossing Loop 70. Ashburn 87TH ST 33. Near South Side 71. Auburn Gresham 8700 S 34. Armour Square 72. Beverly Douglas 73. Washington H eights 36. Oakland 74. Mount Greenwood 95TH ST Downtown zone. Third, the fees are 37. Fuller Park 75. Morgan Park 9500 S 38. Grand Boulevard 76. O'Hare Edgewater RD ST S 52 differentiated according to the 111TH ST S 51 Legend TH ST S Community Areas developer s effort to contribute to TH ST 55 Downtown S TH ST S the supply of affordable housing by Higher Income Low-Moderate Income more information on map is available in the 2015 ARO Rules and Regulations means of construction (rather than in-lieu fees; see three green Source: City of Chicago, available at columns). Thus in the table on the general/housing/2015_aro_ Zone_Map _JULY_28_2015.pdf next page, the Final In-lieu Fee applies today for regular projects; the Final Authorized Agency In-lieu Fee applies to projects in which the developer builds and sells or leases to an authorized PETERSON AV N BRYN MA WR AV 5600 N FOSTER AV 5200 N LAWRENCE AV N MONTROSE AV N IRVING PARK RD N ADDISON ST N BEL MONT AV N 39. Kenwood 40. Washington Park 41. Hyde Park 42. Woodlawn 43. South Shore 44. Chatham 45. Avalon Park 46. South Chicago 47. Burnside 48. Calumet Heights 49. Roseland 50. Pullman 51. South Deering 52. East Side 53. West Pullman 54. Riverdale 55. Hegewisch 56. Garfield Ridge HOWARD ST 7600 N TOUHY AV N PRATT AV N DEVO N AV N DIVERSEY AV N 18 FULLERTON AV 2400 N ARMITAGE AV 2000 N NORTH AV N DIVISION ST N CHICAGO AV 800 N KINZIE ST 400 N MADISON AV 0 N/S HARRISON ST 600 S ROOSEVELT RD S 51ST ST 5100 S 55TH ST 5500 S 59TH ST S OAK PARK AV 6800 W TH ST 3500 S PERSHING RD 3900 S 43RD ST 4300 S 47TH ST 4700 S 16TH ST 1600 S CERMAK RD 2200 S 26ST ST 2600 S 31ST ST 3100 S CHICA GO MIDWAY AIRPORT 67TH ST 6700 S 75TH ST 7500 S 83RD ST 8300 S 91ST ST 9100 S 99TH ST 9900 S TH ST S 115TH ST S DAMEN AV 2000 W ASHLAND AV 1600 W DAMEN AV 2000 W RD ST S 2015 ARO Zones Map effective October 13, TH ST S STATE LINE RD 4100 E 156
227 agency (for use as affordable housing, in the project at hand) a number of housing units at least equal to 25 percent of the total number of affordable units required under the ARO (i.e., the number of affordable units that should be built if no in-lieu fees were paid). The Final Inlieu Premium applies to downtown for-sale projects in which the developer fails to build, onsite or off-site, at least 25 percent of the number of required affordable units. 98 Finally, fee increases were phased in over a year: initial levels are replaced by final levels after about 6 months. CHICAGO IN-LIEU FEES In-Lieu Fee Per Unit Initial Final Initial Final Zone Initial (a) Final (b) Authorized Agency Authorized Agency Premium Premium Low-Moderate Income $ 50,000 $ 50,000 n/a n/a n/a n/a Higher Income $ 125,000 $ 125,000 $ 100,000 $ 100,000 n/a n/a Downtown Rental $ 140,000 $ 175,000 $ 115,000 $ 150,000 n/a n/a Downtown For Sale $ 140,000 $ 175,000 $ 115,000 $ 150,000 $ 160,000 $ 225,000 Notes: (a) "Initial" denotes an effective date of October 13, (b) "Final" denotes an effective date of April 16, Sources: City of Chicago, 2016; BAE, Chicago, unlike other cities, does not require the payment of in-lieu fees for fractions of units that are required under the percentage-based formulas for on-site or off-site affordable housing construction. Results are rounded off to the nearest whole number. A number of projects are exempt from affordable housing requirements under ARO including grandfathered projects, projects that do not call for a rezoning, do not benefit from the sale of City land and do not benefit from the City s financial assistance (i.e., require a rezoning, include the purchase of City land or benefit from City subsidies); and existing housing units, except in projects for which the developer received financial assistance from the City (i.e., for projects that involve existing buildings and are not subsidized, the requirements are calculated only on the new units added to the project) Like other cities, Chicago also has a waiver option in its ordinance, which allows, the Commissioner of Planning and Development, in certain limited circumstances as specified in the rules and regulations, to waive, adjust or reduce the requirements of this section [i.e., ARO]. 99 However, the rules were written is such a way as to limit the number of requests for 98 Chicago Municipal Code, Section Affordable Requirements, subsection F Methods of compliance. Note that the price of units sold to an authorized agency is not regulated; i.e., the sale can be done at market prices. 99 Chicago Municipal Code, Affordable Requirements, subsection P Hardship Waiver. 157
228 waivers to a minimum. In fact, no developer has yet attempted to obtain a waiver under this article of the ordinance. Until 2015, fees were being updated periodically. The new ARO specifies that as of 2018, fees will be increased on January 1 of every year, at the rate given by the change in the Consumer Price Index for the metropolitan area of Chicago (using the annual change posted in September of the previous year). Fees are due prior (and as a condition for) the issuance of the first building permit. The applicable fees are calculated by the Project Manager when the project is submitted for review and are valid for two years only; after that time period they must be calculated again, in light of any changes in the ARO. In-lieu fees are deposited in the Affordable Housing Opportunity Fund ( unless required to be deposited into another fund pursuant to federal or state law 100 ). The funds will be divided two, one half being used for the production of affordable housing (new construction, rehabilitation or preservation), the other half is to be transferred to the Chicago Low-Income Housing Trust Fund, which provides rental subsidies. To date, the fee program has raised approximately $50 million since Because of the economic downturn of 2008 and subsequent years, most fees have been collected since To date, in-lieu fees have been used to produce an estimated 310 affordable units, with an addition 242 units were built by developers as part of their projects. Developers of projects who have received extra density under Chicago s Affordable Housing Zoning Bonus program (which give extra floor area in exchange for cash payments to the City) must first pay the fees owed under that program. Sums paid are then credited toward the inlieu fees to be paid under the ARO. 101 Lessons Learned Sensitivity to context, i.e., to the socioeconomic geography of the city, is important. In Chicago, the very robust downtown market is key to the generation of fees for affordable housing and for other city priorities. (A new Neighborhood Opportunity Bonus was instituted in May 2016, whereby developers can earn a density bonus in exchange for a contribution to a newly established Neighborhood Opportunity Fund, which will be used to finance local economic development programs and projects. 102 ) The distinction by zone, recognizing market 100 Chicago Municipal Code, Affordable Requirements, subsection G Affordable Housing Opportunity Fund. 101 Chicago Municipal Code, Affordable Requirements, subsection E Relationship between 2015 ARO and Affordable Housing Density Bonus. See also Section C Bonus Formula. 102 City of Chicago, Neighborhoods Opportunity Fund Ordinance, available at files/article/file-attachments/neighborhood%20opportunity%20fund%20ordinance.pdf, last accessed on June 4,
229 conditions, is also important, so that modulated fees can help to generate more fee income in areas where development is robust and encourage developers to do projects in areas where economic development is needed. One important issue noted during interviews for this case study is the balance between certainty and discretion in the use of funds generated by the in-lieu fee. On the one hand, the funds must be earmarked for specific purposes. However, planners feel that they must be able to allocated the funds without constraints on the location or type of project. In Chicago as in other cities, there was pressure from the community to earmark in-lieu fees from a project to affordable units in the same neighborhood. Planners resisted the pressure and maintained their right to allocate fees to projects throughout the city, on the basis of need. A similar tension exists in the provision about waivers: use of this provision must be very tightly regulated, to prevent abuse, but it remains useful as an escape valve for truly exceptional cases. 159
230 Appendix E: Residential Building Permit Analysis APPENDIX E-1: RESIDENTIAL UNITS PERMITTED, CITY OF LOS ANGELES, Note: Permit database codes small lot single family units in the single family detached category. Residential Units Permitted Total for Median Total Sq. Ft. Percent of Number of Total Building Avg. Units Avg, Sq,Ft, Avg. Units Building Type (a)(b) PermittedTotal Sq.Ft. Permits Units Size (sf) Per Permit Per Year Per Year Single Family Detached (b) 18,386, % 4,973 4,952 3,088 3,677, Single Family Attached/Townhouse Single Family Attached 1,266, % , ,269 Condominium 167, % ,632 33,468 Duplex Condominium 16, % 4 8 4,019 3,219 Subtotal 1,449, % , Multifamily Condominium Condominium 2-3 story 551, % , ,260 Condominium 4-5 story 876, % , ,225 Condominium > 6 story 0 0.0% 0 0 N/A N/A - Subtotal 1,427, % , TOTAL OWNERSHIP UNITS 21,264, % 5,682 6,280 4,252,822 1,256 Mutlifamily Rental Accessory Living Quarters 157, % ,477 31,535 Duplex 3,105, % 907 1,810 3, ,140 Artist-in-Residence/Loft 7, % 3 4 2,998 1,410 Apartment 2-3 story 5,588, % 321 4,272 10, ,117,667 Apartment 4-5 story 17,333, % ,488 38, ,466,619 Apartment 6-12 story 15,052, % 70 14, , ,010,502 Apartment > 12 story 6,524, % 15 5, , ,304,836 Senior Independent Housing 1,189, % 15 1,132 68, ,816 TOTAL RENTAL UNITS 48,957, % 1,678 41,341 9,791,526 8,268 TOTAL ALL UNITS 70,221, % 7,360 47,621 14,044,348 9,524 Notes: (a) Includes permits for "New" buildings > 1,000 sf issued by City of LA from thru (b) Excludes Miscellaneous Structure Use Codes. Sources: Los Angeles Department of Building and Safety; BAE,


231 Appendix F: Los Angeles PUMAs 161
ARTICLE 1.18 AFFORDABLE HOUSING LINKAGE FEE
 Page 1-2/23/17 ORDINANCE NO. An ordinance adding Section 21.18 and amending Section 16.02 of the Los Angeles Municipal Code, as well as adding Section 5.578 of Chapter 172 of the Administrative Code, establishing
An ordinance adding Section and amending Section of the Los Angeles Municipal Code to establish an Affordable Housing Linkage Fee.
 ORDINANCE NO. An ordinance adding Section 19.18 and amending Section 16.02 of the Los Angeles Municipal Code to establish an Affordable Housing Linkage Fee. WHEREAS, the City Council of the City of Los
CALIFORNIA VINCENT P. BERTONI, AICP DAVID H. J. AMBROZ DIRECTOR PRESIDENT (213) RENEE DAKE WILSON. i, 4 if.-*" V. j H* .AV ERIC GARCETTI MAYOR
 RENEE DAKE WILSON. i, 4 if.-* V. j H* .AV ERIC GARCETTI MAYOR") DEPARTMENT OF CITY PLANNING City of Los Angeles CITY PLANNING COMMISSION CALIFORNIA EXECUTIVE OFFICES 200 N. Spring Street, Room 525 Los Angeles, CA 90012-4801 VINCENT P. BERTONI, AICP DAVID H. J. AMBROZ
DEPARTMENT OF CITY PLANNING City of Los Angeles CITY PLANNING COMMISSION CALIFORNIA EXECUTIVE OFFICES 200 N. Spring Street, Room 525 Los Angeles, CA 90012-4801 VINCENT P. BERTONI, AICP DAVID H. J. AMBROZ
Agenda Re~oort PUBLIC HEARING: PROPOSED ADJUSTMENTS TO INCLUSIONARY IN-LIEU FEE RATES
 Agenda Re~oort August 27, 2018 TO: Honorable Mayor and City Council THROUGH: Finance Committee FROM: SUBJECT: William K. Huang, Director of Housing and Career Services PUBLIC HEARING: PROPOSED ADJUSTMENTS
CITY OF OAKLAND COUNCIL AGENDA REPORT
 CITY OF OAKLAND COUNCIL AGENDA REPORT TO: Office of the City Manager ATTN: Robert C. Bobb FROM: Community and Economic Development Agency DATE: July 23, 2002 RE: AN ORDINANCE AMENDING THE OAKLAND MUNICIPAL
CPC CA 3 SUMMARY
 CPC-2009-3955-CA 2 CONTENTS Summary Staff Report Conclusion 3 4 7 Appendix A: Draft Ordinance A-1 Attachments: 1. Land Use Findings 2. Environmental Clearance 1-1 2-1 CPC-2009-3955-CA 3 SUMMARY Since its
/'J (Peter Noonan, Rent Stabilization and Housing, Manager)VW
VW") CITY COUNCIL CONSENT CALENDAR OCTOBER 17, 2016 SUBJECT: INITIATED BY: INFORMATION ON PROPERTIES REMOVED FROM THE RENTAL MARKET USING THE ELLIS ACT, SUBSEQUENT NEW CONSTRUCTION, AND AFFORDABLE HOUSING HUMAN
CITY COUNCIL CONSENT CALENDAR OCTOBER 17, 2016 SUBJECT: INITIATED BY: INFORMATION ON PROPERTIES REMOVED FROM THE RENTAL MARKET USING THE ELLIS ACT, SUBSEQUENT NEW CONSTRUCTION, AND AFFORDABLE HOUSING HUMAN
Eric Garcetti, Mayor Investment Department. May 21, 2018
 i P moeo r Los Angeles HOUSING + COMMUNITY Eric Garcetti, Mayor Investment Department Rushmore D. Cervantes, General Manager Office of the General Manager 1200 West 7th Street, 9th Floor, Los Angeles,
Below Market Rate (BMR) Housing Mitigation Program Procedural Manual
 Housing Mitigation Program Procedural Manual") Below Market Rate (BMR) Housing Mitigation Program Procedural Manual Amended and Adopted by City Council May 5, 2015 Resolution No. 15-037 City of Cupertino Housing Division Department of Community Development
Below Market Rate (BMR) Housing Mitigation Program Procedural Manual Amended and Adopted by City Council May 5, 2015 Resolution No. 15-037 City of Cupertino Housing Division Department of Community Development
City and County of San Francisco
 City and County of San Francisco Office of the Controller - Office of Economic Analysis Residential Rent Ordinances: Economic Report File Nos. 090278 and 090279 May 18, 2009 City and County of San Francisco
Impact Fee Nexus & Economic Feasibility Study
 Impact Fee Nexus & Economic Feasibility Study Stakeholder Working Group November 12, 2015 Urban Economics Oakland Impact Fee Stakeholder Working Group November 12, 2015 INTRODUCTIONS 1 Agenda Introductions
ORDINANCE NO
 Item 4 Attachment A ORDINANCE NO. 2017-346 AN ORDINANCE OF THE CITY COUNCIL OF THE CITY OF CALABASAS, CALIFORNIA AMENDING CHAPTER 17.22 OF THE CALABASAS MUNICIPAL CODE, AFFORDABLE HOUSING, TO BRING INTO
2004 Cooperative Housing Journal
 2004 Cooperative Housing Journal Articles of Lasting Value for Leaders of Cooperative Housing Published by The National Association of Housing Cooperatives Dos Pinos Housing Cooperative in Davis, California
RE: Recommendations for Reforming Inclusionary Housing Policy
 Circulate San Diego 1111 6th Avenue, Suite 402 San Diego, CA 92101 Tel: 619-544-9255 Fax: 619-531-9255 www.circulatesd.org September 25, 2018 Chair Georgette Gomez Smart Growth and Land Use Committee City
FINDINGS. Goal 3B - Preservation of the City s stable single-family residential neighborhoods.
 FINDINGS I. GENERAL PLAN/CHARTER FINDINGS City Charter Section 556 In accordance with Charter Section 556, the proposed ordinance is in substantial conformance with the purpose, intent and provisions of
RESOLUTION NO
 RESOLUTION NO. 074532 BOARD OF SUPERVISORS, COUNTY OF SAN MATEO, STATE OF CALIFORNIA * * * * * * RESOLUTION ESTABLISHING RATES FOR AN AFFORDABLE HOUSING IMPACT FEE PROGRAM FOR NEW RESIDENTIAL AND NON-RESIDENTIAL
Draft for Public Review. The Market and Octavia Neighborhood Plan
 Draft for Public Review The Market and Octavia Neighborhood Plan San Francisco Planning Department As Part of the Better Neighborhoods Program December 00 . Housing People OBJECTIVE.1 MIXED-USE RESIDENTIAL
Detroit Inclusionary Housing Plan & Market Study Preliminary Inclusionary Housing Feasibility Study Executive Summary August, 2016
 Detroit Inclusionary Housing Plan & Market Study Preliminary Inclusionary Housing Feasibility Study Executive Summary August, 2016 Inclusionary Housing Plan & Market Study Objectives 1 Evaluate the citywide
Honorable Mayor and Members of the City Council. Submitted by: Jane Micallef, Director, Department of Health, Housing & Community Services
 Office of the City Manager ACTION CALENDAR October 16, 2012 To: From: Honorable Mayor and Members of the City Council Christine Daniel, City Manager Submitted by: Jane Micallef, Director, Department of
Summary of Findings & Recommendations
 Summary of Findings & Recommendations Minneapolis/St. Paul Region Mixed Income Housing Feasibility, Education and Action Project Background In 2015 and 2016, the Family Housing Fund and the Urban Land
City of Oakland Programs, Policies and New Initiatives for Housing
 City of Oakland Programs, Policies and New Initiatives for Housing Land Use Policies General Plan Update In the late 1990s, the City revised its general plan land use and transportation element. This included
INCLUSIONARY HOUSING PROGRAM IMPLEMENTATION GUIDELINES
 INCLUSIONARY HOUSING PROGRAM IMPLEMENTATION GUIDELINES JULY 2005 Department of Grants & Community Investment 1110 West Capitol Avenue West Sacramento, CA 95691 Phone: (916) 617-4555 Fax: (916) 372-1584
Denver Comprehensive Housing Plan. Housing Advisory Committee Denver, CO August 3, 2017
 Denver Comprehensive Housing Plan Housing Advisory Committee Denver, CO August 3, 2017 Overview 1. Review of Comprehensive Housing Plan process 2. Overview of legislative and regulatory priorities 3. Overview
City of Salinas Nexus Studies Overview and Summary February 2016
 City of Salinas Nexus Studies Overview and Summary February 2016 1) Introduction The City of Salinas is looking at ways to increase the supply of affordable housing in Salinas. The City already has a successful
Barbara County Housing Element. Table 5.1 Proposed Draft Housing Element Goals, Policies and Programs
 Table 5.1 Proposed Draft Housing Element Goals, Policies and Programs Goal 1: Enhance the Diversity, Quantity, and Quality of the Housing Supply Policy 1.1: Promote new housing opportunities adjacent to
The Impact of Market Rate Vacancy Increases Eleven-Year Report
 The Impact of Market Rate Vacancy Increases Eleven-Year Report January 1, 1999 - December 31, 2009 Santa Monica Rent Control Board April 2010 TABLE OF CONTENTS Summary 1 Vacancy Decontrol s Effects on
HILLS BEVERLY. Planning Commission Report. City of Beverly Hills
 BEVERLY HILLS 1 City of Beverly Hills Planning Division 455 N. Rexford Drive Beverly Hills, CA 90210 TEL, (310) 4854141 FAX. (310) 8584966 Planning Commission Report Meeting Date: February 14, 2013 Subject:
COMMUNITY DEVELOPMENT DEPARTMENT
 AGENDA ITEM I-1 COMMUNITY DEVELOPMENT DEPARTMENT Council Meeting Date: June 3, 2014 Agenda Item #: I-1 INFORMATIONAL ITEM: Update on Multi-City Affordable Housing Nexus Study and Impact Fee Feasibility
CITY COUNCIL JUNE 6, 2016 PUBLIC HEARING
 CITY COUNCIL JUNE 6, 2016 PUBLIC HEARING SUBJECT: INITIATED BY: COST OF SERVICES STUDY AND PROPOSED FEE RESOLUTION FOR FISCAL YEAR 2016-17 FINANCE & TECHNOLOGY SERVICES DEPARTMENT (David A Wilson, Director)
Developing an Inclusionary Zoning Ordinance
 Developing an Inclusionary Zoning Ordinance Key Considerations August 18, 2006 Dwayne Marsh Senior Associate, PolicyLink Inclusionary Zoning: An Important Affordable Housing Tool Requires or encourages
ORDINANCE NO. AN ORDINANCE OF THE CITY COUNCIL OF THE CITY OF DALY CITY REPEALING AND REPLACING CHAPTER RE: INCLUSIONARY HOUSING
 ORDINANCE NO. AN ORDINANCE OF THE CITY COUNCIL OF THE CITY OF DALY CITY REPEALING AND REPLACING CHAPTER 17.47 RE: INCLUSIONARY HOUSING The City Council of the City of Daly City, DOES ORDAIN as follows:
HOUSING IMPACT FEE NEXUS STUDY
 HOUSING IMPACT FEE NEXUS STUDY SUBMITTED TO City of Salinas January 2016 Prepared by VERNAZZA WOLFE ASSOCIATES, INC. www.vernazzawolfe.com 2909 Shasta Road Tel: (510) 548-8229 Berkeley, California 94708
Executive Summary Planning Code Text Amendment HEARING DATE: MAY 10, 2018
 Executive Summary Planning Code Text Amendment HEARING DATE: MAY 10, 2018 Project Name: Central SOMA Housing Sustainability District Case Number: 2018-004477PCA [Board File No. 180453] Initiated by: Mayor
Housing as an Investment Greater Toronto Area
 Housing as an Investment Greater Toronto Area Completed by: Will Dunning Inc. For: Trinity Diversified North America Limited February 2009 Housing as an Investment Greater Toronto Area Overview We are
California (213) DAVID H. J. AMBROZ PRESIDENT. eric garcetti ROCKY WILES
 DAVID H. J. AMBROZ PRESIDENT. eric garcetti ROCKY WILES") DEPARTMENT OF CITY PLANNING City of Los Angeles CITY PLANNING COMMISSION California EXECUTIVE OFFICES VINCENT P. BERTONI, AICP DIRECTOR (213) 978-1271 DAVID H. J. AMBROZ PRESIDENT RENEE DAKE WILSON c vos
DEPARTMENT OF CITY PLANNING City of Los Angeles CITY PLANNING COMMISSION California EXECUTIVE OFFICES VINCENT P. BERTONI, AICP DIRECTOR (213) 978-1271 DAVID H. J. AMBROZ PRESIDENT RENEE DAKE WILSON c vos
Subject. Date: 2016/10/25. Originator s file: CD.06.AFF. Chair and Members of Planning and Development Committee
 Date: 2016/10/25 Originator s file: To: Chair and Members of Planning and Development Committee CD.06.AFF From: Edward R. Sajecki, Commissioner of Planning and Building Meeting date: 2016/11/14 Subject
The New Starts Grant and Affordable Housing A Roadmap for Austin s Project Connect
 The New Starts Grant and Affordable Housing A Roadmap for Austin s Project Connect Created for Housing Works by the Entrepreneurship and Community Development Clinic at the University of Texas School of
DEPARTMENT OF CITY PLANNING
 DEPARTMENT OF CITY PLANNING RECOMMENDATION REPORT City Planning Commission Case No.: CPC-2018-5222-SP Date: November 8, 2018 Time: After 8:30 am Place: Los Angeles City Hall Council Chambers, Room 340
COMMUNITY BENEFIT REQUIREMENTS & IMPACT FEES FOR DEVELOPMENTS IN VARIOUS CITIES
 COMMUNITY BENEFIT REQUIREMENTS & IMPACT FEES FOR DEVELOPMENTS IN VARIOUS CITIES Prepared by Office of Mayor Tom Bates Current Requirements for Projects in Berkeley Downtown* Under Consideration for Projects
SANTA ROSA IMPACT FEE PROGRAM UPDATE FINAL REPORT. May Robert D. Spencer, Urban Economics Strategic Economics Kittelson & Associates
 SANTA ROSA IMPACT FEE PROGRAM UPDATE FINAL REPORT May 2018 Robert D. Spencer, Urban Economics With: Strategic Economics Kittelson & Associates City of Santa Rosa Impact Fee Program Update TABLE OF CONTENTS
Santa Barbara County In-Lieu Fee Update Report. Submitted to: The County of Santa Barbara. Submitted by: Bay Area Economics (BAE)
") Santa Barbara County In-Lieu Fee Update Report Submitted to: The County of Santa Barbara Submitted by: Bay Area Economics (BAE) June 2004 Table of Contents 1 Executive Summary...i 2 Introduction...1 2.1
Santa Barbara County In-Lieu Fee Update Report Submitted to: The County of Santa Barbara Submitted by: Bay Area Economics (BAE) June 2004 Table of Contents 1 Executive Summary...i 2 Introduction...1 2.1
Key findings of the study include:
 C I T Y O F C A M B R I D G E Community Development Department IRAM FAROOQ Assistant City Manager for Community Development MEMORANDUM To: Richard Rossi, City Manager From: Iram Farooq, Assistant City
Background and Purpose
 DRAFT MEMORANDUM To: From: Perkins+Will James Musbach and Rebecca Benassini Subject: Affordable Housing Need and Supply, Downtown Concord Specific Plan, addendum to Existing Conditions Report; EPS #121118
Bending the Cost Curve Solutions to Expand the Supply of Affordable Rentals. Executive Summary
 Bending the Cost Curve Solutions to Expand the Supply of Affordable Rentals Executive Summary Why Bending the Cost Curve Matters The need for affordable rental housing is on the rise. According to The
4. Parks and Recreation Fee Facility Needs and Cost Estimates Fee Calculation Nexus Findings 24
 TABLE OF CONTENTS CHAPTER PAGE 1. Introduction and Summary of Calculated Fees 1 1.1 Background and Study Objectives 1 1.2 Organization of the Report 2 1.3 Calculated Development Impact Fees 2 2. Fee Methodology
Modifying Inclusionary Housing Requirements: Economic Impact Report. Office of Economic Analysis Items # and # May 12, 2017
 Modifying Inclusionary Housing Requirements: Economic Impact Report Office of Economic Analysis Items #161351 and #170208 May 12, 2017 Introduction Two ordinances have recently been introduced at the San
DRAFT REPORT. Residential Impact Fee Nexus Study. June prepared for: Foster City VWA. Vernazza Wolfe Associates, Inc.
 DRAFT REPORT Residential Impact Fee Nexus Study June 2015 prepared for: Foster City VWA Vernazza Wolfe Associates, Inc. Table of Contents I. EXECUTIVE SUMMARY... 4 Introduction... 4 Background... 4 Report
M EMORANDUM. Attachment 7. Steve Buckley and Margot Ernst, City of Walnut Creek. Darin Smith and Michael Nimon, EPS
 Attachment 7 M EMORANDUM To: From: Subject: Steve Buckley and Margot Ernst, City of Walnut Creek Darin Smith and Michael Nimon, EPS Affordable Housing Fee Update Considerations; EPS #151080 Date: March
Housing Costs and Policies
 Housing Costs and Policies Presentation to Economic Society of Australia NSW Branch 19 May 2016 Peter Abelson Applied Economics Context and Acknowledgements Applied Economics P/L was commissioned by NSW
 EXHIBIT A: Proposed Ordinance CPC-2016-1245-CA May 12, 2016 Exhibit A CPC 2016 1245 CA ORDINANCE NO. An ordinance repealing Subsections 12.24.W.43 and 12.24.W.44 of Chapter 1 of the Los Angeles Municipal
AGENDA ITEM CITY COUNCIL MEETING DATE JUNE 20, 2017 BUSINESS ITEMS
 AGENDA ITEM CITY COUNCIL MEETING DATE JUNE 20, 2017 BUSINESS ITEMS DATE : June 13, 2017 TO : City Council FROM : City Manager SUBJECT : ADOPT A NEW MASTER FEE SCHEDULE, INCORPORATING UPDATES FROM THE CITYWIDE
Staff recommends the City Council hold a public hearing, listen to all pertinent testimony, and introduce on first reading:
 CITY COUNCIL PUBLIC HEARING JANUARY 16, 2018 SUBJECT: INITIATED BY: MULTI-FAMILY NEIGHBORHOODS ZONE TEXT AMENDMENTS: AMEND MINIMUM DENSITY REQUIREMENTS FOR R3 AND R4 DISTRICTS; AMEND THE DENSITY BONUS
PROPOSED INCLUSIONARY ORDINANCE
 PROPOSED INCLUSIONARY ORDINANCE AN ORDINANCE OF THE CITY COUNCIL OF THE CITY OF OXNARD AMENDING THE MUNICIPAL CODE TO AMEND INCLUSIONARY HOUSING REQUIREMENTS BY REVISING AND RENUMBERING WHEREAS, it is
Park City UT Housing Review
 Executive Summary Park City UT Housing Review Prepared for: City of Park City, Utah Prepared by: Economic & Planning Systems, Inc. Date EPS #153048 Table of Contents 1. EXECUTIVE SUMMARY... 1 1.1 Summary
Briefing Book. State of the Housing Market Update San Francisco Mayor s Office of Housing and Community Development
 Briefing Book State of the Housing Market Update 2014 San Francisco Mayor s Office of Housing and Community Development August 2014 Table of Contents Project Background 2 Household Income Background and
CHAPTER Committee Substitute for Committee Substitute for House Bill No. 437
 CHAPTER 2013-83 Committee Substitute for Committee Substitute for House Bill No. 437 An act relating to community development; amending s. 159.603, F.S.; revising the definition of qualifying housing development
Arizona Department of Housing Five-Year Strategic Plan
 Arizona Department of Housing Five-Year Strategic Plan Agency Mission Providing housing and community revitalization to benefit the people of Arizona. Agency Description The Arizona Department of Housing
Impact Fee Nexus & Economic Feasibility Study
 Impact Fee Nexus & Economic Feasibility Study Stakeholder Working Group December 10, 2015 Urban Economics Agenda Follow Up From Last Meeting Proposals Presentation Proposals Discussion Wrap Up 1 Oakland
TOD and Equity. TOD Working Group. James Carras Carras Community Investment, Inc. August 7, 2015
 TOD and Equity TOD Working Group James Carras Carras Community Investment, Inc. August 7, 2015 What is Equitable TOD? Equity is fair and just inclusion. Equitable TOD is the precept that investments in
JOBS HOUSING NEXUS ANALYSIS
 APPENDIX E EXECUTIVE SUMMARY JOBS HOUSING NEXUS ANALYSIS Jobs Housing Nexus Analysis Report Prepared for the City of San Mateo Prepared by Kayesr Marston Associates, Inc. February 2003 EXECUTIVE SUMMARY
HOUSING & RESIDENTIAL AREAS
 CHAPTER 10: HOUSING & RESIDENTIAL AREAS OVERVIEW With almost 90% of Ridgefield zoned for residential uses, the patterns and form of residential development can greatly affect Ridgefield s character. This
Housing and Economic Development Strategic Plan for Takoma Park OCTOBER 18, 2017
 Housing and Economic Development Strategic Plan for Takoma Park OCTOBER 18, 2017 1 Three Part Process Housing and Economic Data Analysis SWOT Analysis: Strengths, Weaknesses, Opportunities and Threats
ARLINGTON COUNTY, VIRGINIA
 ARLINGTON COUNTY, VIRGINIA County Board Agenda Item Meeting of January 21, 2006 DATE: January 5, 2006 SUBJECT: Action on Proposed Amendments to provide for the achievement of affordable housing objectives
Housing Affordability Research and Resources
 Housing Affordability Research and Resources An Analysis of Inclusionary Zoning and Alternatives University of Maryland National Center for Smart Growth Research and Education Abt Associates Shipman &
MAYOR. Members of the Arts, Parks, Health and Aging Committee:
 MICHAEllOGRANDE CHIEF ZONING ADMINISTRATOR DEPARTMENT OF CITY PLANNING ASSOCIATE ZONING ADMINISTRATORS PATRiCiA BROWN R. NICOLAS BROWN SUE CHANG ANI I< CHARRON tarry FRIEDMAN DANiEl GREEN LOURDES GREEN
Housing Broward An Inclusive Housing Plan
 Housing Broward An Inclusive Housing Plan THE COORDINATING COUNCIL OF BROWARD BROWARD HOUSING COUNCIL JULY 2017 The Coordinating Council of Broward County Chairperson, Senator (Commissioner) Nan Rich Executive
1. An adequate provision of affordable housing is a fundamental and critical feature of any strong, livable and healthy community.
 Strengthen Ontario s Provincial Policy Statement as one tool to meet the province s housing needs Submission by Wellesley Institute to PPS five-year review The Wellesley Institute believes that a strengthened
Affordable Housing Bonus Program. Public Questions and Answers - #2. January 26, 2016
 Affordable Housing Bonus Program Public Questions and Answers - #2 January 26, 2016 The following questions about the Affordable Housing Bonus Program were submitted by the public to the Planning Department
CITY OF COLD SPRING ORDINANCE NO. 304
 CITY OF COLD SPRING ORDINANCE NO. 304 AN ORDINANCE AMENDING THE CITY CODE OF COLD SPRING BY ADDING SECTIONS 555 AND 510 PERTAINING TO PAYMENT-IN-LIEU-OF-PARKING THE CITY COUNCIL OF THE CITY OF COLD SPRING,
Housing Program Application (HOME & HTF) County of Bucks, Pennsylvania Housing Services
 County of Bucks, Pennsylvania Housing Services") Housing Program Application (HOME & HTF) County of Bucks, Pennsylvania Housing Services Since 1989, Housing Services has been the comprehensive provider of funding for community development, housing and
Housing Program Application (HOME & HTF) County of Bucks, Pennsylvania Housing Services Since 1989, Housing Services has been the comprehensive provider of funding for community development, housing and
REGIONAL. Rental Housing in San Joaquin County
 Lodi 12 EBERHARDT SCHOOL OF BUSINESS Business Forecasting Center in partnership with San Joaquin Council of Governments 99 26 5 205 Tracy 4 Lathrop Stockton 120 Manteca Ripon Escalon REGIONAL analyst april
COMPARISON OF THE LONG-TERM COST OF SHELTER ALLOWANCES AND NON-PROFIT HOUSING
 COMPARISON OF THE LONG-TERM COST OF SHELTER ALLOWANCES AND NON-PROFIT HOUSING Prepared for The Fair Rental Policy Organization of Ontario By Clayton Research Associates Limited October, 1993 EXECUTIVE
The Affordable Housing Credit Improvement Act of 2016
 The Affordable Improvement Act of 2016 S. 3237 Sponsored by Senator Maria Cantwell (D-WA) and co-sponsored by Senate Finance Committee Chairman Orrin Hatch (R-UT) and Ranking Member Ron Wyden (D-OR), the
WELLSVILLE AFFORDABLE HOUSING PLAN
 WELLSVILLE AFFORDABLE HOUSING PLAN 2014 DRAFT 2.2 Wellsville: Affordable Housing Plan 2014 Page 2 DRAFT 2.2 Wellsville: Affordable Housing Plan 2014 Table of Contents Summary of Affordable Housing Conditions...
Regulatory Impact Statement
 Regulatory Impact Statement Establishing one new special housing area in Queenstown under the Housing Accords and Special Housing Areas Act 2013. Agency Disclosure Statement 1 This Regulatory Impact Statement
H o u s i n g N e e d i n E a s t K i n g C o u n t y
 1999 2000 2001 2002 2003 2004 2005 2006 2007 2008 2009 2010 Number of Affordable Units H o u s i n g N e e d i n E a s t K i n g C o u n t y HOUSING AFFORDABILITY Cities planning under the state s Growth
HOUSING OVERVIEW. Housing & Economic Development Strategic Plan for Takoma Park Presented by Mullin & Lonergan Associates February 26,2018
 HOUSING OVERVIEW Housing & Economic Development Strategic Plan for Takoma Park Presented by Mullin & Lonergan Associates February 26,2018 Overarching Themes & Underlying Bases Takoma Park strives to be
HOUSING ELEMENT I. GOALS, OBJECTIVES AND POLICIES
 HOUSING ELEMENT I. GOALS, OBJECTIVES AND POLICIES GOAL 1: IN ORDER TO ACHIEVE A BALANCED HOUSING SUPPLY (AND A BALANCED POPULATION AND ECONOMIC BASE), EVERY EFFORT SHOULD BE MADE TO PROVIDE A BROAD RANGE
UNDERSTANDING THE TAX BASE CONSEQUENCES OF LOCAL ECONOMIC DEVELOPMENT PROGRAMS
 UNDERSTANDING THE TAX BASE CONSEQUENCES OF LOCAL ECONOMIC DEVELOPMENT PROGRAMS Richard K. Gsottschneider, CRE President RKG Associates, Inc. 277 Mast Rd. Durham, NH 03824 603-868-5513 It is generally accepted
The City Council makes the following findings:
 12/ 07/2015 ORIGINAL ORDINANCE NO. 2417 AN ORDINANCE OF THE CITY COUNCIL OF THE CITY OF REDWOOD CITY ADDING A NEW ARTICLE XVII (AFFORDABLE HOUSING IMPACT FEE) TO CHAPTER 18 OF THE REDWOOD CITY MUNICIPAL
Fort Collins Housing Affordability Policy Study Stakeholder Workshop #1
 Fort Collins Housing Affordability Policy Study Stakeholder Workshop #1 Presented by: Dan Guimond, Principal David Schwartz, Senior Associate Economic & Planning Systems Don Elliott, Principal Clarion
Rent Stabilization, Vacancy Decontrol and Reinvestment in Rental Property in Berkeley, California
 Rent Stabilization, Vacancy Decontrol and Reinvestment in Rental Property in Berkeley, California REVISED FINAL REPORT July 16, 2012 Jay Kelekian, Executive Director Stephen Barton, Ph.D., Project Manager
Market Segmentation: The Omaha Condominium Market
 Market Segmentation: The Omaha Condominium Market Roger P. Sindt Steven Shultz University of Nebraska at Omaha Introduction A highly visible and growing niche in the homeownership market is the condominium
CHAPTER V: IMPLEMENTING THE PLAN
 CHAPTER V: IMPLEMENTING THE PLAN A range of resources is available to fund the improvements included in the Action Plan. These resources include existing commitments of County funding, redevelopment-related
American Canyon Affordable Housing Nexus Study: Background Report
 American Canyon Affordable Housing Nexus Study: Background Report City of American Canyon Final Report DAVID PAUL ROSE N & ASSOCI ATES D E V E L O P M E N T, F I N A N C E A N D P O L I C Y A D V I S O
MEMORANDUM Planning Commission Travis Parker, Planning Director DATE: April 4, 2018 Lakewood Zoning Amendments Housing and Mixed Use
 MEMORANDUM TO: FROM: Travis Parker, Planning Director DATE: April 4, 2018 SUBJECT: Lakewood Zoning Amendments Housing and Mixed Use In August 2017, the Lakewood Development Dialogue process began with
CITY OF OAKLAND IMPACT FEE ADMINISTRATIVE REGULATIONS AND MANUAL
 CITY OF OAKLAND IMPACT FEE ADMINISTRATIVE REGULATIONS AND MANUAL AFFORDABLE HOUSING, TRANSPORTATION & CAPITAL IMPROVEMENTS IMPACT FEES Adopted by City Administrator: August 9, 2017 City of Oakland Impact
Housing. Imagine a Winnipeg...: Alternative Winnipeg Municipal Budget
 Housing Housing, and the need for affordable housing in cities and towns across Canada, has finally caught the attention of politicians. After a quarter century of urging from housing advocates, there
Provide a diversity of housing types, responsive to household size, income and age needs.
 8 The City of San Mateo is a highly desirable place to live. Housing costs are comparably high. For these reasons, there is a strong and growing need for affordable housing. This chapter addresses the
1 #N7 AMX42TOD4BVTv1
 Introduced by: ORDINANCE NO. AN ORDINANCE OF THE CITY OF ~ASADENA AMENDING TITLE 17 (ZONING CODE) OF THE PASADENA MUNICIPAL CODE TO ALLOW THE CONVERSION OF HOTELS AND MOTELS TO AFFORDABLE HOUSING, AND
Dan Immergluck 1. October 12, 2015
 Examining Recent Declines in Low-Cost Rental Housing in Atlanta, Using American Community Survey Data from 2006-2010 to 2009-2013: Implications for Local Affordable Housing Policy Dan Immergluck 1 October
B-11-MN April 1, 2014 thru June 30, 2014 Performance Report. Community Development Systems Disaster Recovery Grant Reporting System (DRGR)
") Grantee: Grant: Pomona, CA B-11-MN-06-0516 April 1, 2014 thru June 30, 2014 Performance Report 1 Grant Number: B-11-MN-06-0516 Grantee Name: Pomona, CA Grant Award Amount: $1,235,629.00 LOCCS Authorized
Grantee: Grant: Pomona, CA B-11-MN-06-0516 April 1, 2014 thru June 30, 2014 Performance Report 1 Grant Number: B-11-MN-06-0516 Grantee Name: Pomona, CA Grant Award Amount: $1,235,629.00 LOCCS Authorized
City of Exeter Housing Element
 E. Identification and Analysis of Developments At-Risk of Conversion Pursuant to Government Code Section 65583, subdivision (a), paragraph (8), this sub-section should include an analysis of existing assisted
Financial Analysis of Urban Development Opportunities in the Fairfield and Gonzales Communities, Victoria BC
 Financial Analysis of Urban Development Opportunities in the Fairfield and Gonzales Communities, Victoria BC Draft 5 December 2016 Prepared for: City of Victoria By: Table of Contents Summary... i 1.0
Detroit Neighborhood Housing Markets
 Detroit Neighborhood Housing Markets Market Study 2016 In 2016, Capital Impact s Detroit Program worked with local and national experts to determine the residential market demand across income levels for
ECONOMIC CURRENTS. Vol. 5 Issue 2 SOUTH FLORIDA ECONOMIC QUARTERLY. Key Findings, 2 nd Quarter, 2015
 ECONOMIC CURRENTS THE Introduction SOUTH FLORIDA ECONOMIC QUARTERLY Economic Currents provides an overview of the South Florida regional economy. The report presents current employment, economic and real
Trends in Affordable Home Ownership in Calgary
 Trends in Affordable Home Ownership in Calgary 2006 July www.calgary.ca Call 3-1-1 PUBLISHING INFORMATION TITLE: AUTHOR: STATUS: TRENDS IN AFFORDABLE HOME OWNERSHIP CORPORATE ECONOMICS FINAL PRINTING DATE:
NOW, THEREFORE, THE CITY COUNCIL OF THE CITY OF SAN MATEO, CALIFORNIA, ORDAINS that:
 CITY OF SAN MATEO ORDINANCE NO. 2016-8 ADDING CHAPTER 23.61, "AFFORDABLE HOUSING COMMERCIAL LINKAGE FEE" TO TITLE 23, OF THE SAN MATEO MUNICIPAL CODE WHEREAS, there is a shortage of affordable housing
FOLLOW-UP TO CITY COUNCIL QUESTIONS FROM THE NOVEMBER 18, 2014, APPROVAL OF THE AFFORDABLE HOUSING IMPACT FEE
 CITY OF d ^3 SAN IPSE CAPITAL OF SILICON VALLEY TO: HONORABLE MAYOR AND CITY COUNCIL COUNCIL AGENDA: 11/10/15 ITEM: < j. 2. Memorandum FROM: Jacky Morales-Ferrand SUBJECT: SEE BELOW DATE: Approved ^ ^
The Affordable Housing Credit Improvement Act of 2017
 The Affordable Housing Credit Improvement Act of 2017 Sponsored by Representatives Pat Tiberi (R-OH) and Richard Neal (D-MA), the Affordable Housing Credit Improvement Act of 2017 would enact numerous