Housing Sentiment Index (HSI)
|
|
|
- Merilyn Walton
- 6 years ago
- Views:
Transcription
1
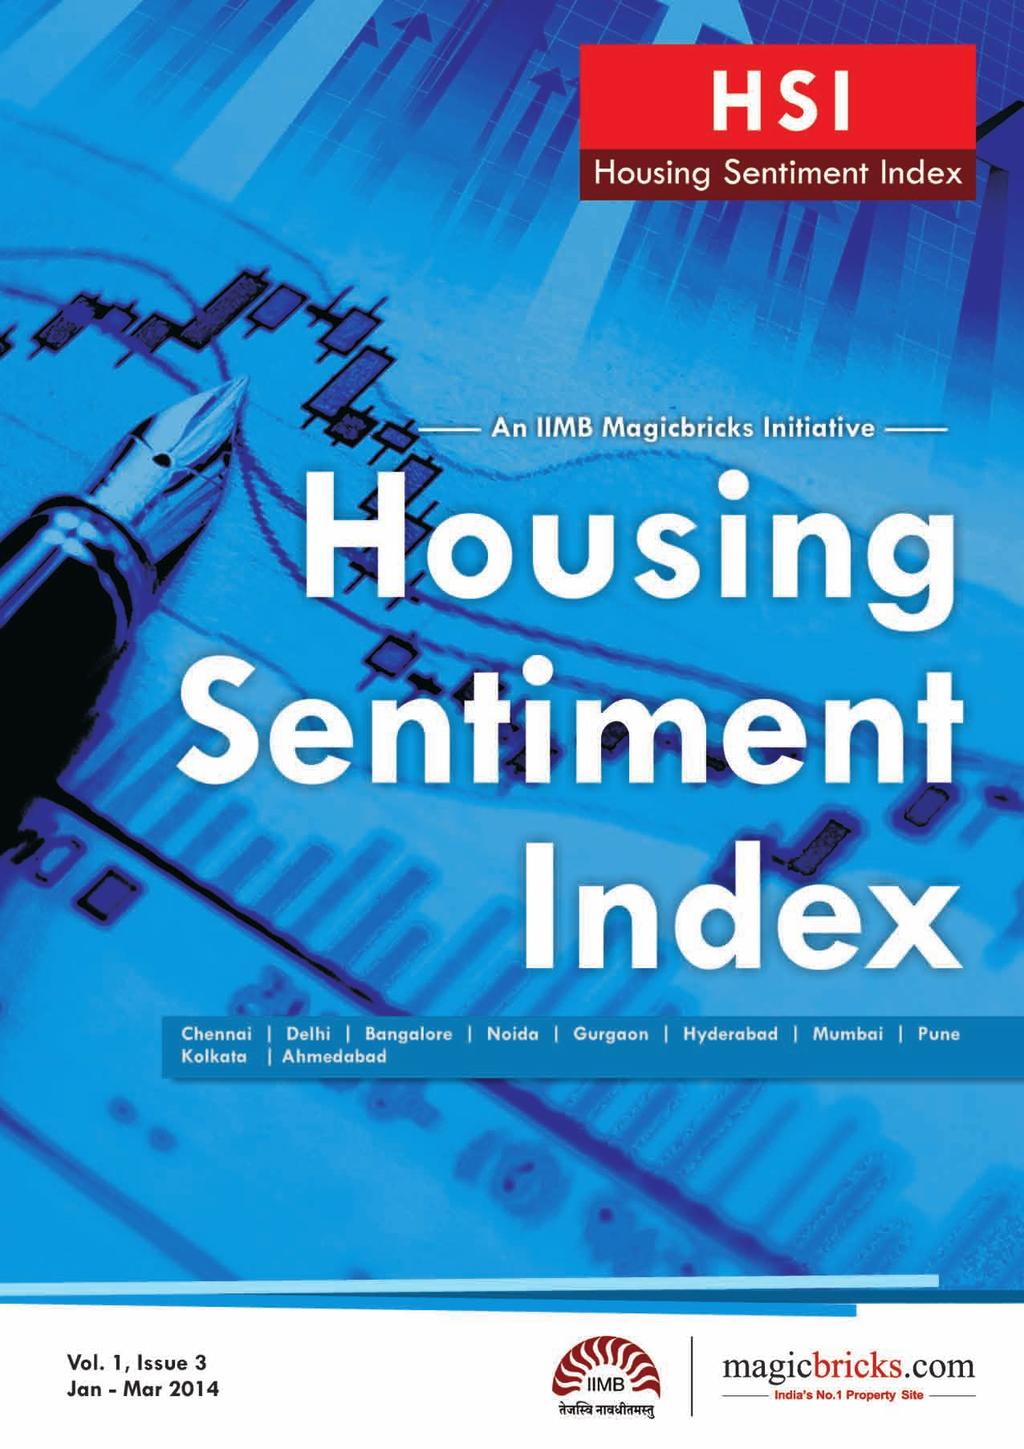
2 An IIMB Magicbricks Initiative Housing Sentiment Index (HSI) Jan Mar 2014 EXECUTIVE SUMMARY Home buyers across eight of the ten cities surveyed expect real estate prices to rise over the next six months with aggregate HSI at 108. The aggregate HSI number also includes Ahmedabad and Kolkata beginning this quarter. Overall, HSI numbers have been range bound as compared to the steep drop and rise witnessed in Q2 (Jul-Sep 2013) and Q3 (Oct-Dec 2013) respectively. There seems to be a wait-and-watch approach primarily motivated by the general elections. The seller index also rose by 5% this quarter to 164. Bangalore remained the first choice for sellers looking to invest their proceeds in property. A HSI of 100 suggests that buyers expect prices to remain at current levels, while values lower/greater than 100 suggest that buyers expect prices to fall/rise. Barring Hyderabad and Noida, all other cities posted an upward trend. Mumbai posted positive HSI of 106 for the first time in four quarters. Ahmedabad gained 22% this quarter (HSI 99) and Bangalore rose by another 15% to achieve an all time high HSI score of 140. Noida (NOI) which witnessed a steep increase of 33% last quarter fell by 4% (HSI 124). The survey recorded 51% buyers prefer to buy within the next six months. The average wait time dropped noticeably to 8.23 months compared to 9.32 months in the previous quarter. Some respondents (25%) opine that prices will increase by not more than 5% while 10% think that prices will decrease, at the most by 5%, with 43% bullish about a market increase of up to 10%.
3 HOUSING SENTIMENT INDEX (HSI) About RESI The Housing Sentiment Index (HSI) is jointly developed by IIM-Bangalore (IIMB) and Magicbricks (MB). The index is based on an online survey of prospective home buyers after careful screening by MB and IIMB. This quarter, two more cities, Ahmedabad and Kolkata were added to the buyer index. A seller survey was also launched across the nation to track buyer and seller preferences and sentiments from the last quarter. Results of both surveys are documented in this report. There has been a drop of almost 6% in the number of buyer respondents from the previous quarter. We will, however, monitor survey responses closely to ensure high data credibility. We also plan to verify the online survey data collected with samples collected periodically from property shows across cities to ensure that the sample data collected is representative of the true population. The survey questionnaire has been constructed to specifically capture buyer sentiment on house prices, the degree to which he/she thinks house prices will move, micro market preferences within each city and basic demographic information, including buyer preferences for type of property and financing methods. The HSI is one of the premier sentiment indices in the Indian real estate market that aims to capture buyer sentiment and serve as a lead indicator of the residential real estate market. The index is based on the Diffusion Index methodology that is widely used to capture market sentiments globally. HSI is calculated by taking the difference of the total positive and negative sentiments after adjusting the magnitude of neutral responses and other biases inherent in the survey-based work. The value of HSI can range from 0 to 200. A score of 100 represents neutrality, meaning people do not expect house prices to either increase or decrease. A score of 200 indicates that all respondents expect house prices to increase. A score of 0 indicates that all respondents expect house prices to decrease. BUYER AND SELLER SURVEY HIGHLIGHTS Buyer HSI Score: An aggregate HSI score of 117 for the 10 cities surveyed indicates expectation of a price rise over the next six months. Among cities, Bangalore, with an HSI of 140, leads the list followed by Kolkata with an HSI of 132. Noida, which experienced a 33% increase in HSI in the previous quarter, fell by 4% to 124. For the first time, Mumbai shifted to positive HSI of 106. Across cities, 72% were looking to buy property as residence for their family, 68% planned to finance it with a home loan and 71% want to buy a flat in a multi-storey apartment. Of the respondents, 48% earn less than Rs 10 lakh per annum, with property within Rs lakh being preferred by 31%. The survey also noted 31% respondents from the IT sector and 12% as self-employed. The average wait time reduced to 8.23 months compared to 9.32 months in the previous quarter. Seller HSI Score: Seller HSI in both quarters was 30%-40% above buyer HSI. Of the sellers, 78% were individual owners, 14% agents and the remaining builders/developers. Of these, 32% want to book profits while 31% want to move to a bigger accommodation. Of the respondents, 27% owned the property they hold for less than three years while another 28% held it for less than one year. Of the budget ranges, 22% owned property in the Rs lakh followed by 18% in the Rs lakh range. The survey showed 47% wanted to sell flats followed by 30% who wanted to sell land/plots.
4 MACROECONOMIC VIEW % Change INR-USD Spot Rate 10 Yr G-Sec Yield CPI GDP INR-USD Spot Rate MARKET CONDITIONS Global Markets: The S&P Index ended the quarter with a 1.8% gain with stocks initially falling but then surging to an all time high in Feb-Mar Signals from the Federal Reserve and shifts in monetary policy, earning results and the Ukraine tension contributed to the volatility. The MSCI Europe Index advanced 2% amid signs of improvement in Europe s weakest economies and the Euro climbed to its highest level against the dollar in February MSCI Japan declined 8% due to weak economic data and strengthening Yen. Emerging Markets ended the quarter flat due to concerns of slowing growth in China and the Ukraine crisis. Domestic Economy: Despite the depressed emerging market scenario, Indian markets posted an 8% gain primarily due to increased Foreign Institutional Investor (FII) inflow and rising hopes of a majority government coming to power in the centre post the general elections in May In line with expectations, the benchmark repo rate was retained at 8% by the Reserve Bank of India (RBI). Clamp on gold imports and fall in capital goods imports resulted in Current Account Deficit (CAD) improving with the Government hoping to bring down CAD to $35 billion. The rupee advanced over 3%, buoyed by policy measures to contain inflation and the improving CAD scenario. Real Estate: The Parliamentary Standing Committee submitted a report in February 2014 on the Real Estate (Regulation and Development) Bill introduced in August The report proposed extension of the Real Estate Regulatory Authority (RERA) mandate. Some proposals were to extend industrial and commercial real estate, include smaller projects built on 100 sq m area into the purview of the bill and registration of all real estate agents. The Maharashtra Housing (Regulation and Development) Act 2012 received presidential assent paving the way for the state to be the first in the country to boast of a real estate regulator body. The Allahabad High Court ordered realty firm Supertech to demolish two under construction apartment buildings in Noida due to violation of the State Apartment Act. In general, a wait and watch approach is being followed by many before the General Elections. Activity is bound to increase once a new government is formed at the centre. However, net office space absorption increased across most cites with some cities like Noida and Ahmedabad posting 3 times increase. Residential unit launches increased by 43%according to a Cushman and Wakefield report, with most developers hoping sales will pick up in the second quarter.
5 SENTIMENT BY BUYER REGION Buyer HSI Q1 Q3 Q1 Q3 Q1 Q3 Q3 Q1 Q3 Q1 Q3 Q1 Q3 Q1 Q3 Q1 Q3 Q3 DLH NOI GUR AHM MUM PUN BLR CHN HYD KOL North West South East % Change in HSI Q/Q DLH GUR MUM BLR HYD -40% -30% -20% -10% 0% 10% 20% 30% 40% KOL HYD CHN BLR PUN MUM Q4/Q3 2% -4% 4% 15% 9% 24% 22% 3% -4% 10% Q3/Q2 21% 15% 15% 23% 5% 22% 33% 4% Q2/Q1-34% -12% -23% -17% -13% -21% -20% -24% AHM GUR NOI DLH Bangalore (BLR) topped the list of cities with an HSI of 140, increasing by 15% in two consecutive quarters. Steady demand, manageable level of unsold inventory and affordable house prices compared to other cities ensured BLR is still the sought after destination. Mumbai (MUM), with an HSI of 106, rose 24% to record the first positive HSI score in four quarters. MUM was plagued by high level of unsold inventory over the last year. However, with the Navi Mumbai airport project getting a nod and some more villages accepting the compensation project to make way for the airport, things are finally looking up with all parts of the city witnessing increase in HSI this quarter. Noida (NOI), which increased by 33% in the previous quarter, fell by 4% to 124 while Hyderabad (HYD) fell by 4% to end at 97. Ahmedabad (AHM) is the only other city with an HSI below 100.
6 SENTIMENT BY AGE 18 to 24 years 25 to 29 years 30 to 39 years 40 to 49 years 50 years and Above 50 years and Above -30% -20% -10% 0% 10% 20% 30% 40 to 49 years 30 to 39 years 25 to 29 years 18 to 24 years Q4/Q3 7% -2% 9% 3% 10% Q3/Q2 11% 25% 21% 13% 15% Q2/Q1-20% -20% -25% -18% -5% Of the 10 cities surveyed, Ahmedabad with 8% buyers in the year age group (HSI 131) tops the list of youngest buyers. Kolkata, 19% buyers in the 50 years and above age group (HSI 131), tops the list of oldest buyers. Overall, 10% of respondents were females (HSI 125). Bangalore has the most (12%, HSI 146). HSI scores reduce with age, year olds at 161 and 50 years and above at 102. SENTIMENT BY INCOME Less than Rs 10 Lakh Rs 20 to 30 Lakh Rs 50 Lakh to Rs 1cr Above Rs 1 cr -100% -50% 0% 50% 100% 150% Rs 50 Lakh to Rs 1cr Rs 30 to 50 Lakh Rs 20 to 30 Lakh Rs 10 to 20 Lakh Less than Rs 10 Lakh Q4/Q3-14% -2% 22% 12% 6% 4% Q3/Q2 136% 66% 21% 28% 25% 7% Q2/Q1-56% -27% -25% -30% -26% -14% 48% buyers earn less than Rs 10 lakh per annum (HSI 119) while 79% buyers earn less than Rs 20 lakh. Although, HSI for those earning over Rs 1 crore dipped by 14% to 104 but in Gurgaon, 11% of the population earns over Rs 1 Crore. 62% of those earning less than Rs 10 lakh per annum (HSI 84) look to buy in Ahmedabad while 30% plan to buy in Gurgaon (HSI 144). SENTIMENT BY PROFESSION Edu Govt Pharma IT/ITES Manf/Eng Media NA - Retired Others Real Estate Retail Self Empl Telecom -30% -20% -10% 0% 10% 20% 30% 40% 50% 60%
7 31% of respondents were in the IT sector (HSI 124), followed by 15% in the Manufacturing sector (HSI 121). HSI for Real Estate respondents dropped by 20% (HSI 112) though they comprise only 4% of the total respondents. HSI of 107 for the self employed respondents at 12% was the lowest. Unsurprisingly, Bangalore has the maximum IT crowd (51%, HSI 141) while Ahmadabad has maximum self-employed (25%, HSI 92) and retirees (4%). SENTIMENT BY TIME HORIZON Change in HSI by Buyer Constraints 0% Buy within 6 Months Wait 6m-1 Year Wait an Year -21% -21% -21% -21% -10% -12% 0% 4% 3% 2% 10% 7% 20% 20% 18% 22% 30% 33% -30% -20% -10% 0% 10% 20% 30% 40% Q4/Q3 Personal Financial Constraint Q4/Q3 Market Conditions Constraint Q3/Q2 Personal Financial Constraint Q3/Q2 Market Conditions Constraint Q2/Q1 Personal Financial Constraint Q2/Q1 Market Conditions Constraint Interestingly, the HSI numbers for buyers who are waiting to buy due to their own personal financial constraints is positive across all three groups (Within 6 months: 123, between 6 months-1 year: 133, wait a year: 126) while those waiting due to current market conditions are not as optimistic (Within 6 months: 120, between 6 months-1 year: 88, wait a year: 79). Of all respondents, 51% want to buy within the next six months. Of these, 15% opine that prices will increase by 0%-5% while 9% think prices will rise between 5%-10%. Of those willing to wait a year 15% are think property prices will fall by 15%-20%. Of the respondents in Ahmadabad 58% prefer to buy within the next six months (HSI 102) while 30% respondents in Bangalore are willing to wait a year or more (HSI 136).
8 Q1 Q2 Q3 Q4 Constrained by Personal Financial Situation Constrained by Market Conditions SENTIMENT BY PROPERTY PREFERENCE Change in HSI by Property Type Flat in Multi-storey Apartment Complex Land/Plot Villa/Row Houses/Independent Houses -30% -25% -20% -15% -10% -5% 0% 5% 10% 15% 20% 25% Villa/Row Houses/Independent Houses Land/Plot Flat in Multi-storey Apartment Complex Q4/Q3-8% 8% 9% Q3/Q2 19% 9% 20% Q2/Q1-21% -16% -23% Of the prospective buyers 71% prefer apartments (HSI 116) while 14% prefer villas (HSI 105) and 12% prefer land/plot (HSI 128). Compared to the previous quarter, HSI for apartments has risen over 9%, while HSI for villas dropped by 7%. Of those who prefer flats, 75% intend to purchase for use as residence while 72% of villa buyers intend to purchase with the intention of staying with family. Of the land owners, 50% intend to purchase with the intention of residing with their families after construction of property on the land. 92% of residents in Mumbai intend to purchase flats (HSI 106), 30% of residents in Bangalore intend to purchase land (HSI 139) and 44% of Hyderabad residents intend to purchase villas (HSI 78).
9 In a rented household In own house With parentsrelatives 0% 5% 10% 15% 20% 25% With parentsrelatives In own house In a rented household Q4/Q3 13% 3% 6% Q3/Q2 9% 22% 18% 53% of prospective buyers live in rented accommodation (HSI 115), 30% live in their own house (HSI 115) and 16% live with parents/relatives (HSI 120). Over 51% of those living in their own houses intend to buy property for residential purpose, implying a move to a bigger/better residence. In Ahmedabad such respondents are 60% (HSI 83). 68% of respondents in Bangalore live in rented houses (HSI 135), the maximum among the 10 surveyed cities. 36% of Chennai residents living in their own house are looking to buy another property (HSI 108). SENTIMENT BY PRICE RANGE Change in HSI by Price Range Below Rs 20Lakh Rs 20Lakh to Rs 40Lakh Rs 40Lakh to Rs 60Lakh Rs 60 lakh to Rs 1.0 crore Rs 1.0 crore to Rs 2.0 crore Rs 2.0 crore to Rs 5 crore Rs 5.0 crore and Above -50% -40% -30% -20% -10% 0% 10% 20% 30% 40% Rs 5.0 crore and Above Rs 2.0 crore to Rs 5 crore Rs 1.0 crore to Rs 2.0 crore Rs 60 lakh to Rs 1.0 crore Rs 40Lakh to Rs 60Lakh Rs 20Lakh to Rs 40Lakh Below Rs 20Lakh Q4/Q3-3% 7% -4% 11% 9% 3% 9% Q3/Q2 24% 33% 28% 19% 22% 18% 0% Q2/Q1 5% -41% -24% -24% -22% -21% -9% HSI for properties above Rs 1 crore dipped by 4% (HSI 103). However, only 9% of respondents were looking for property above Rs 1 crore. HSI for the Rs lakh range rose by 9% to 119 while HSI for the Rs lakh group, comprising 31% of respondents, rose by 2% to 116. In Gurgaon, 25% of respondents are looking for property above Rs 1 crore with HSI for the Rs 1-2 crore properties dipping sharply by 37% (HSI 86). In Kolkata, 30% of respondents are looking for property below Rs 20 lakh (HSI 135) followed by 23% in Ahmadabad (HSI 108). In Bangalore, out of the 12% of female respondents, 48% are looking for property in the Rs lakh range (HSI 139). Hyderabad, Chennai and Bangalore are preferred destinations for villas although only Bangalore has shown an increase in HSI of 5% (HSI 129) in this segment.
10 HSI AND OTHER PROPERTY PRICE INDICES Q3/Q2 Comparison BLR CHN HYD MUM PUN DLH -5% 0% 5% 10% 15% 20% 25% DLH PUN MUM HYD CHN BLR Q3/Q2 H S I 4% 23% 5% 21% 15% 15% Q3/Q2 PropIndex -2% 2% 2% 0% 5% -4% Q3/Q2 RESIDEX 3% 7% 0% 6% 4% 4% Q2/Q1 Comparison BLR CHN HYD MUM PUN DLH -40% -30% -20% -10% 0% 10% 20% DLH PUN MUM HYD CHN BLR Q2/Q1 H S I -24% -17% -13% -34% -12% -23% Q2/Q1 PropIndex 4% 5% 3% 3% 3% 17% Q2/Q1 RESIDEX -5% 0% 0% 5% 5% -1% Analysing the last four quarters of the sentiment data and comparing this with RESIDEX, the index put out by the National Housing Board (NHB), buyer sentiment is expectedly a lot more volatile as compared to RESIDEX although both indexes seem to be correlated. The graphs above depict the percentage change Q/Q for the HSI, RESIDEX and PropIndex which tracks residential apartment prices. While the HSI decreased significantly in Q2, RESIDEX values in most cities either showed no change or posted marginal change in both directions. Similarly, in Q3, HSI numbers increased significantly while the RESIDEX values across most cities increased marginally. PropIndex values remained range bound in both quarters. We intend tracking all three indices closely to establish significant relationship but will require more data to arrive at effective conclusions.
11 SELLER SURVEY Book Profit Job Uncertainty Move closer to workplace Moving out of the city Purchase bigger accommodation Unable to service home loan 0% 2% 4% 6% 8% 10% 12% 14% 16% 18% 20% Overall, the seller HSI increased by 5% to 164 Q/Q. Of the sellers 30% are within years (HSI 158). Although 8% of are in the year group, 48% of them are in the real estate sector. 78% of sellers are individual owners (HSI 161), 14% are agents or brokers (HSI 167) and 8% are builders/developers (HSI 178). 10% of sellers are females (HSI 166) while HSI for male sellers is 163. The survey shows 67% sellers earn below Rs 10 lakh per annum (HSI 167). In this group, 77% of them are individual owners while 15% are agents/brokers and the remaining are builders/developers. Of the respondents, 38% want to sell a flat/multi-storey apartment while 36% want to sell land. 47% of sellers are looking to sell flats (HSI 160), 30% want to sell land (HSI 168) and 17% want to sell villas (HSI 171). Of the sellers, 32% would like to sell to book profits (HSI 171) followed by 31% who want to purchase a bigger accommodation (HSI 156), while 18% want to sell as they are moving out of the city (HSI 163), 8% want to move closer to work (HSI 168), 4% cite job uncertainty (HSI 167) and 5% want to sell as they are unable to service home loans (HSI 153). 22% of sellers are looking to sell property in the Rs lakh range (HSI 170), followed by 20% in the Rs 60 lakh to Rs 1 Crore range (HSI 157). 28% of sellers are in the real estate sector (HSI 165), 11% belong to the IT sector (HSI 157), 11% belong to the Manufacturing/Engineering sector (HSI 164) with the remaining spread across other sectors of the economy. 68% of sellers in Bangalore are looking for property within Bangalore while 32% of sellers from other cities are looking to buy in Bangalore. 24% of those wanting to sell have owned the property for less than a year (HSI 173), while another 25% for less than three years (HSI 153), 20% less than eight years (HSI 166), 13% less than 15 years (HSI 160) and 15% greater than 15 years (HSI 161).
12 MICRO MARKET SUMMARY - DELHI Change in HSI by Region East Delhi North Delhi South Delhi West Delhi -40% -30% -20% -10% 0% 10% 20% 30% 40% 50% West Delhi South Delhi North Delhi East Delhi Q4/Q3-14% 19% 44% 6% Q3/Q2-5% 20% -8% -14% Q2/Q1-19% -30% -19% -18% HSI rose by 10% when compared to an increase of 4% in the previous quarter (HSI 105). Of the respondents 14% are from North Delhi which witnessed a 44% surge (HSI 121). Sentiment by Buyer Age Group HSI decreases with age, year olds at 113 and 50 years and above at to 39 year old group forms the major portion with 31% falling in this age category (HSI 103). Sentiment by Buyer Constraint HSI of 114 for those who cite financial constraint (63%) is a lot higher than HSI of 88 for those who cite market constraints. HSI for those who cite market constraints has risen by 3% Q/Q as compared to a rise of 10% for those who cite financial constraints. Sentiment by Buyer Horizon Although HSI for those who want to buy within the next three months has fallen by 9% (HSI 97), the percentage of people wanting to buy within the next six months has increased by 13% Of those who can wait for a year or more 66% cite financial constraints as the reason for the wait. Sentiment by Buyer Property Preference Of the respondents, 77% are end users (HSI 109) while the remaining are looking to enter as investors (HSI 89). Flats in multi-storey apartments are preferred property type (60%, HSI 84) followed by villas (15%, HSI 156) Of those who already live in their own house (HSI 98) 35% are looking to buy while 43% currently live in rented accommodation (HSI 92) and 22% live with parents-relatives (HSI 135). Sentiment by Buyer Budget The survey recorded 35% of buyers are looking at properties within Rs lakh range (HSI 109) followed by 22% in the Rs 60 lakh to Rs 1 crore range (HSI 96). Buyers working in IT/ITES/BPO profession (19%, HSI 96) are pessimistic while the self-employed that comprise 16% are optimistic (HSI 129).
13 MICRO MARKET SUMMARY - NOIDA Change in HSI by Region Greater-Noida Expressway New Developing Sectors Old Noida -60% -40% -20% 0% 20% 40% 60% 80% Old Noida New Developing Sectors Greater-Noida Expressway Q4/Q3-42% 10% -7% Q3/Q2 52% 12% 59% Q2/Q1-4% -16% -28% HSI fell by 4% when compared to a rise of 33% in the previous quarter (HSI 124). Old Noida, comprising 17% of respondents, witnessed a 42% decrease in HSI when compared to the previous quarter. Sentiment by Buyer Age Group: Age wise the year olds comprise 54% of the respondents (HSI 114) followed by the year olds (21%, HSI 151). HSI steadily decreases with age, year olds at 144 as compared to year olds at 115. Sentiment by Buyer Constraint Of the respondents, 51% cite financial reasons (HSI 121) while the rest (HSI 127) cite market conditions for their property purchase decisions. Sentiment by Buyer Horizon Only 26% want to wait for a year or more as compared to 42% last quarter (HSI 95) while 58% want to buy within the next six months (HSI 129). Of those who can wait for a year or more 58% cite financial constraints as the reason for the wait. Sentiment by Buyer Property Preference Of the buyers, 71% are end users (HSI 121) while the rest are looking to enter as investors (HSI 131). 83% prefer flats (HSI 141) followed by 12% who prefer land (HSI 44). HSI for those who prefer land dropped sharply by 60% when compared to the previous quarter. Of those who already live in their own house (HSI 124) 21% are looking to buy while 57% of respondents currently live in rented accommodation (HSI 132). Sentiment by Buyer Budget Of the buyers 38% are looking at properties within Rs lakh range (HSI 156) while another 30% are looking to buy property within Rs lakh range (HSI 108). Buyers working in Government (7%, HSI 94) and Pharma (5%, HSI 67) are pessimistic about property prices in Noida. Of the respondents 30% from the IT sector are optimistic about house prices (HSI 155).
14 MICRO MARKET SUMMARY - GURGAON Dwarka Expway Golf Course Road New Gurgaon Others (Include sector 70 to 80) Change in HSI by Region -100% -50% 0% 50% 100% 150% Sohna Road Others (Include sector 70 to 80) Old Gurgaon New Gurgaon New Developing Sectors Golf Course Road Golf Course Extension Road Dwarka Expway Q4/Q3 17% 33% -75% 121% 11% -29% -17% -25% Q3/Q2-7% 52% 27% -5% 33% 66% 38% 28% Q2/Q1 0% -56% 63% -34% -33% -11% -17% -20% HSI rose by 3% when compared to a rise of 22% in the previous quarter (HSI 112). New Gurgaon, comprising 13% of respondents, witnessed an increase of 121% in HSI (173) while Old Gurgaon, comprising 4% of respondents, witnessed a 75% drop in HSI (40). Sentiment by Buyer Age Group: The year olds comprise 49% of the respondents (HSI 112) followed by year olds (18%, HSI 136). The year olds are pessimistic (80) while the year olds are most optimistic (136). Sentiment by Buyer Constraint The survey showed 48% citing financial reasons (HSI 115) while the rest (HSI 109) cite market conditions for their property purchase decisions. Sentiment by Buyer Horizon Of the respondents 22% want to wait for a year or more (HSI 87) while 52% want to buy within the next six months (HSI 118). Of those who cite market reasons 62% want to buy property within the next six months (HSI 115). Sentiment by Buyer Property Preference HSI of 135 for those who are planning to buy property as an investment is 23% more than those who plan to buy as a place of residence for their own family. The survey recorded 74% end users (HSI 104) while the rest are investors (HSI 135). Of the respondents 69% prefer flats (HSI 118) followed by 14% who prefer land (HSI 95). Of those who already live in their own house (HSI 102) 32% are looking to buy while 55% currently live in rented accommodation (HSI 112). Of those living in their own house 58% are looking for property for residential purpose. Sentiment by Buyer Budget Of the buyers 31% are looking at properties within Rs 60 lakh to Rs 1 crore range (HSI 95) while 22% are looking to buy property within Rs lakh range (HSI 131) and 25% are looking for property priced over Rs 1 crore, the highest among all cities surveyed. Buyers working in the IT sector comprise 20% of respondents with an HSI of 100. Of the respondents 21% are self-employed with an HSI of 53.
15 MICRO MARKET SUMMARY - MUMBAI Change in HSI by Region Central Line Mumbai Navi Mumbai Western Suburbs Mumbai -60% -40% -20% 0% 20% 40% 60% 80% 100% 120% 140% Western Suburbs Mumbai Thane Mumbai South Mumbai Navi Mumbai Harbour Line Mumbai Central Mumbai Central Line Mumbai Q4/Q3 10% 25% 6% 21% 1% 129% 34% Q3/Q2 7% 4% -8% 37% 28% -44% -3% Q2/Q1-10% -14% 20% -36% 15% 83% -8% HSI rose by 24% when compared to a rise of 5% in the previous quarter (HSI 106). The HSI for Mumbai rose above 100 for the first time in four quarters. Of the respondents 37% are from Western Suburbs (HSI 97) that witnessed a 10% increase in HSI Q/Q. The Central Line, comprising 14% of respondents, witnessed a 34% increase in HSI (96). Navi Mumbai witnessed a 21% increase in HSI (121) and also posted a 130% increase in respondents, attributed to progress in the Navi Mumbai Airport talks and also due to the upcoming Trans Harbour Link. No significant change in HSI was noted for the city inspite of controlling this increased response rate. Sentiment by Buyer Age Group: The year olds comprise 41% of the respondents (HSI 107) followed by year olds (23%, HSI 121). The 50 years and above group comprising 10% of the respondents is pessimistic with an HSI of 74. Sentiment by Buyer Constraint Of the respondents 48% cite financial reasons (HSI 120) while the rest (HSI 92) cite market conditions for their property purchase decisions. Sentiment by Buyer Horizon Of the buyers 25% want to wait for a year or more (HSI 89) while 54% want to buy within the next six months (HSI 114). Of those who cite market reasons 52% want to buy within the next six months (HSI 148). Sentiment by Buyer Property Preference HSI for those who are planning to buy property as an investment is 132 while HSI for those who plan to buy property as a place of residence (72%) is 97. Of the buyers 92% prefer flats (HSI 106) followed by 5% who prefer villas/row-houses (HSI 96). Of the respondents 34% of those who already live in their own house (HSI 109) are looking to buy while 46% of respondents currently live in rented accommodation (HSI 99). Sentiment by Buyer Budget Of the buyers 25% are looking at properties within Rs lakh range (HSI 119) while 24% are looking to buy property within Rs 60 lakh to Rs 1 crore. (HSI 102). The self-employed who comprise 13% of the respondents are pessimistic with an HSI of 87. IT sector makes up another 20% of respondents who are optimistic with an HSI of 138.
16 MICRO MARKET SUMMARY - PUNE Change in HSI by Region Central Pune East Pune North Pune South Pune West Pune -40% -30% -20% -10% 0% 10% 20% 30% 40% 50% 60% 70% West Pune South Pune North Pune East Pune Central Pune Q4/Q3-7% 14% 52% 24% Q3/Q2 37% 60% 12% -5% 22% Q2/Q1-16% -27% -25% -15% -4% HSI rose by 9% when compared to an increase of 23% in the previous quarter (HSI 121). Of the respondents 38% are from West Pune (HSI 110), dropped by 7% Q/Q, 32% from East Pune with an HSI of 119 while North Pune comprising 39% of the respondents witnessed 52% rise (HSI 152). Sentiment by Buyer Age Group: The year olds comprise 48% of the respondents (HSI 121) followed by year olds (29%, HSI 113). The year olds are optimistic with an HSI of 164 although they comprise only 3% of respondents. Sentiment by Buyer Constraint Of the respondents 43% cite financial reasons (HSI 140) while the rest (HSI 107) cite market conditions for their property purchase decisions. Sentiment by Buyer Horizon Of the buyers 50% want to buy within the next six months (HSI 141) while 27% can wait for a year or more (HSI 98). Sentiment by Buyer Property Preference HSI for those planning to buy property as an investment (31%) is 130 while HSI for those who plan to buy as a place of residence is 117. Of the respondents 78% prefer flats (HSI 115) followed by 11% who prefer land (HSI 166). Of those who already live in their own house (HSI 131) 34% are looking to buy while 54% currently live in rented accommodation (HSI 118). Sentiment by Buyer Budget Of the buyers 36% are looking at properties within Rs lakh range (HSI 120) while 29% are looking to buy property within Rs lakh range (HSI 114). Of the respondents 45% belong to the IT sector (HSI 108) while 20% are from the manufacturing sector (HSI 146).
17 MICRO MARKET SUMMARY - BANGALORE Change in HSI by Region CBD and off CBD - Bangalore East & South East Bangalore North & North East Bangalore South Bangalore West and North West Bangalore -60% -40% -20% 0% 20% 40% 60% 80% 100% 120% 140% West and North West Bangalore South Bangalore North & North East Bangalore East & South East Bangalore CBD and off CBD - Bangalore Q4/Q3 14% 11% 8% 21% 115% Q3/Q2 15% 7% 15% 24% 7% Q2/Q1-17% -19% -15% -33% -36% HSI rose by another 15% this quarter to 140. Of the respondents 33% are from South Bangalore which saw an 11% increase in HSI (133) while 28% are from East and South-East Bangalore which witnessed a 21% rise in HSI (144). HSI for Bangalore CBD rose by 155%, but it comprises 1% of the total respondents. North Bangalore, comprising 29% of respondents also witnessed an increase of 8% in HSI (142). Sentiment by Buyer Age Group: The year olds are 58% of the respondents (HSI 129) followed by year olds (17%, HSI 163). The year olds, comprising only 3% of the population, are highly optimistic with an HSI of 171. Sentiment by Buyer Constraint Of the buyers 61% cite financial reasons (HSI 147) while the rest (HSI 128) cite market conditions for their property purchase decisions. Sentiment by Buyer Horizon Of the buyers 44% want to buy within the next six months (HSI 142) while 30% can wait for a year or more (HSI 136). Of the respondents 66% are waiting for a year or more (HSI 113) due to financial reasons. Sentiment by Buyer Property Preference HSI for those planning to buy property as an investment (28%) is 143 while HSI for those who plan to buy as a place of residence is 138. Of the buyers 52% prefer flats (HSI 143) followed by 30% who prefer land (HSI 139). The remaining 19% prefer villas (HSI 129). 22% of those living in their own house (HSI 153) are looking to buy while 69% of respondents currently live in rented accommodation (HSI 136) while 9% live with parents/relatives (HSI 135). Sentiment by Buyer Budget Of the buyers 30% are looking at properties within Rs lakh range (HSI 130) while 34% are looking to buy property within Rs lakh range (HSI 143). Of the respondents 51% belong to the IT sector (HSI 141) while 9% are from the manufacturing sector (HSI 124)
18 MICRO MARKET SUMMARY - CHENNAI Change in HSI by Region Central Chennai North Chennai South Chennai West Chennai -60% -40% -20% 0% 20% 40% 60% 80% 100% 120% West Chennai South Chennai North Chennai Central Chennai Q4/Q3 43% 9% -6% -28% Q3/Q2-14% 13% -10% 95% Q2/Q1-6% -8% -6% -37% HSI rose by 4% when compared to a rise of 15% in the previous quarter (HSI 116). Of the respondents 65% are from South Chennai (HSI 122) while 14% from North Chennai (HSI 100). Central Chennai, comprising 13% of respondents saw a decline of 28% in HSI (94). Sentiment by Buyer Age Group: The year olds comprise 39% of the respondents (HSI 121) followed by year olds (29%, HSI 97), the only group that is pessimistic. Sentiment by Buyer Constraint Of the buyers 53% cite financial reasons (HSI 118) while the rest (HSI 113) cite market conditions for their property purchase decisions. Sentiment by Buyer Horizon 23% are ready to wait for a year or more (HSI 103) while 46% want to buy within six months (HSI 129). Sentiment by Buyer Property Preference HSI for those who are planning to buy property as an investment (38%) is 124 while HSI for those who plan to buy as a place of residence is 111. Of the buyers 48% prefer flats (HSI 116) followed by 23% who prefer villas (HSI 112) and 18% prefer land (HSI 130). Of those who already live in their own house (HSI 109) 36% are looking to buy while 52% currently live in rented accommodation (HSI 118) and 12% live with parents/relatives (HSI 124). Sentiment by Buyer Budget Of the buyers 41% are looking at properties that are less than Rs lakh range (HSI 120) while 22% are looking to buy property within Rs lakh range (HSI 121). Of the respondents 29% belong to the IT sector (HSI 123) while 20% belong to the manufacturing sector (HSI 94).
19 MICRO MARKET SUMMARY - HYDERABAD Change in HSI by Region Central Hyderabad East Hyderabad North Hyderabad South Hyderabad -60% -40% -20% 0% 20% 40% 60% South Hyderabad North Hyderabad East Hyderabad Central Hyderabad Q4/Q3-2% -2% -5% -3% Q3/Q2 24% 53% 3% 6% Q2/Q1-39% -39% -19% -31% HSI declined by 4% when compared to an increase of 21% in the previous quarter (HSI 97). Of the respondents 30% are from Central Hyderabad (HSI 86) while 31% are from South Hyderabad (HSI 89). East and North Hyderabad are optimistic (HSI 107, 120 respectively) while Central and South Hyderabad are pessimistic (HSI 87, 89 respectively). The Telengana issue continues to weigh on Hyderabad sentiments. Sentiment by Buyer Age Group: The year olds comprise 52% of the respondents (HSI 105) followed by year olds (22%, HSI 106). The 50 year and above who comprise 9% of respondents are pessimistic with an HSI score of 56. Sentiment by Buyer Constraint Of the respondents 38% cite financial reasons (HSI 119) while the rest (HSI 85) cite market conditions for their property purchase decisions. Sentiment by Buyer Horizon Of the buyers 53% want to purchase property within the next six months (HSI 95) while 17% are ready to wait a year or more (HSI 93). Sentiment by Buyer Property Preference HSI for those planning to buy property as an investment (32%) is 108 while HSI for those who plan to buy property as a place of residence is 92. Of the buyers 45% prefer flats (HSI 113) followed by 44% who prefer villas (HSI 78). Of the respondents 27% already live in their own house (HSI 93) and are looking to buy while 64% currently live in rented accommodation (HSI 97) and 9% live with parents/relatives (HSI 117). Sentiment by Buyer Budget Of the buyers 41% are looking at properties that are less than Rs lakh range (HSI 86) while 27% are looking to buy property within Rs lakh range (HSI 108). Properties below Rs 20 lakh (HSI 107) comprise 8% of total respondents. Of the respondents 47% belong to the IT sector (HSI 100) while 11% belong to the manufacturing sector (HSI 109).
20 MICRO MARKET SUMMARY - KOLKOTA Change in HSI by Region East Kolkata North Kolkata South Kolkata West Kolkata -25% -20% -15% -10% -5% 0% 5% 10% 15% 20% West Kolkata South Kolkata North Kolkata East Kolkata Q4/Q3 0% 14% 2% -20% HSI increased by 2% to 132. Of the respondents 48% are from South Kolkota (HSI 143) while 25% are from East Kolkota (HSI 108). Another 24% are from North Kolkota (HSI 136) while only 3% are from West Kolkota (HSI 100). Sentiment by Buyer Age Group: The year olds comprise 40% of the respondents (HSI 141) followed by year olds (21%, HSI 106). The 50 year and above group comprise 19% of respondents, the highest in this age group among all cities surveyed (HSI 131). Sentiment by Buyer Constraint Of the buyers 58% cite financial reasons (HSI 140) while the rest (HSI 120) cite market conditions for their property purchase decisions. Sentiment by Buyer Horizon Of the respondents 46% want to purchase property within the next six months (HSI 145) while 27% are ready to wait a year or more (HSI 110). Sentiment by Buyer Property Preference HSI for those planning to buy property as an investment (24%) is 131 while HSI for those who plan to buy as a place of residence is 132. Of the buyers 80% prefer flats (HSI 135) followed by 7% who prefer villas (HSI 109). Of the respondents 30% already living in their own house (HSI 123) are looking to buy while 49% currently live in rented accommodation (HSI 138) and 21% live with parents/relatives (HSI 130). Sentiment by Buyer Budget Of the buyers 35% are looking at properties that are less than Rs lakh range (HSI 128) while 23% are looking to buy property within Rs lakh range (HSI 135). Properties below Rs 20 lakh (HSI 135) comprise 31% of respondents, the highest percentage among the surveyed cities that fall in this property range. Of the respondents 15% belong to the IT sector (HSI 118) while 15% are self employed (HSI 124).
21 MICRO MARKET SUMMARY - AHMEDABAD HSI increased by 22% to 99. Sentiment by Buyer Age Group: The year olds comprise 35% of the respondents (HSI 89) followed by year olds (26%, HSI 104). Sentiment by Buyer Constraint Of the buyers 40% cite financial reasons (HSI 98) while the rest (HSI 100) cite market conditions for their property purchase decisions. Sentiment by Buyer Horizon Of the buyers 59% want to purchase property within the next six months (HSI 102) while 22% are ready to wait a year or more (HSI 105). Sentiment by Buyer Property Preference HSI for those who are planning to buy property as an investment (24%) is 136 while HSI for those who plan to buy as a place of residence is 89. Of the respondents 71% prefer flats (HSI 95) followed by 16% who prefer villas (HSI 91). Of those already living in their own house (HSI 96) 28% are looking to buy property while 45% of respondents currently live in rented accommodation (HSI 102) with 27% living with parents/relatives (HSI 96). Sentiment by Buyer Budget Of the buyers 41% are looking at properties that are less than Rs lakh range (HSI 79) while 23% are looking to buy property below Rs 20 lakh (HSI 108). Of the respondents 25% are self employed (HSI 92), the highest among all cities surveyed to fall into this category while 17% are from the IT sector (HSI 93).
22 EXPLANATORY NOTE ON SURVEY A total of approximately 3,000 buyers are surveyed every quarter in an online survey across 10 cities Mumbai, Delhi, Hyderabad, Pune, Noida, Gurgaon, Bangalore, Chennai, Ahmedabad and Kolkata (the last two cities added in Q3 2013). The aggregate HSI includes Ahmedabad and Kolkata beginning this quarter. The survey was conducted online in the month of Jul, Oct, Dec of 2013 and Mar The fiscal year calendar is being followed for the quarterly notations. Going forward this survey will be conducted. The sample size was smaller by 6% when compared to the previous quarter. Mumbai city witnessed 62% increase in the sample size. The respondent survey rates will be tracked closely and the findings will be documented with every survey. Beginning last quarter a seller survey was also rolled out across the country to track seller sentiments and compare these with the buyer sentiments. The questionnaire is similar to the buyer survey and tries to capture movement patterns across the country apart from the basic demographics and housing sentiments. The Seller survey will be rolled out along with the buyer survey each quarter. A standard questionnaire was mailed out electronically to select members of the Magicbricks portal based on rigorous criteria. The respondents include people from different backgrounds, income levels and have shown their intent about purchasing a house in the next 12 months. The survey is thus representative of the overall Indian residential real estate industry. Respondents assess relative market conditions based on common knowledge and form price expectations for the next six months. Sampling differences, difference in question wording and differences in response scaling make measuring based on surveys an inexact science, particularly when ordinal scales are used. Nevertheless, it appears that results, in general, fairly track other key results over the period observed. As more data is expected to be collected, it will be explored whether some of the survey s key metrics might serve as predictors of consumer behavior and as leading indicators of housing market conditions. INDEX METHODOLOGY The IIMB-CRERI Magicbricks Index fills the critical gap in identifying and measuring changes in potential home owners expectations and decision making in the residential housing sector by quantifying their sentiments and tracking the results on a quarterly basis. The credibility of the study is enhanced given that it is being conducted by an independent third party research unit. Diffusion Index methodology is used to compute the index. A score of 100 denotes neutral sentiment. A score above 100 denotes optimism and a score below 100 denotes pessimism. The scores can range from 0 to 200. This quarterly barometer is expected to capture the changing opinions of potential home buyers regarding housing prices. The index provides early information on potential homebuyers expectations and views regarding near term home price movements and their decision to buy.
23 FUTURE AGENDA Given the encouraging response rates so far, it is planned to introduce buyer surveys to additional cities in the future quarters. The increased interest in the real estate sector is evident in the launch of some very innovative indices recently, case in point being the Housing Start-up Index recently launched by RBI and the Ministry of Housing and Urban Poverty Alleviation (MHUPA). It is planned to study the correlation among the various housing indices and derive interesting insights in the real estate sector that is on the path to attaining structure and logic. Home buying not only involves the buyer and seller but also a host of other forces including financial institutions, local governments, central banks and global macro movements. The process of quantifying sentiments using Diffusion Index methodology leads to quick comparison across markets and buyer demographics. The ultimate aim is the hope that this study will lead to optimal policy making that will aid home buyers and sellers and ensure a smooth transaction process in the residential real estate space. ABOUT IIMB-CRERI Indian Institute of Management Bangalore-Century Real Estate Research Initiative (IIMB-CRERI) was set up through a grant from the Century Real Estate who is one of the oldest and most respected companies in the real estate space in India. It is a dedicated research initiative to pursue scientific research on Indian real estate industry. It partners with the industry/government organizations to collect data and develop research projects that are aimed to improve understanding of this vital sector of the economy. The initiative complements work at IIMB's other leading Centres such as the Centre for Public Policy. As a leading international management school in India, IIMB has strong linkages to the corporate sector, CSOs and the government. Its rigorous research projects are defined by structured analytical processes and constant engagement with market participants. IIMB CRERI Team Dr Venkatesh Panchapagesan (Chief Faculty Coordinator) Mr Ramana Tadepalli (Chief Operating Officer) Dr Madalasa Venkataraman (Lead Researcher) Ms Uma Sitaraman (Senior Research Associate) ABOUT MAGICBRICKS Magicbricks.com is India's No 1 Property portal. With monthly traffic exceeding 6 million visits and with an active base of over 5 lakh property listings, Magicbricks provides the biggest platform for buyers and sellers of property to connect with each other in a clear and transparent manner. Our vision is to be a 1-stop shop for property buyers and sellers. With this in mind, we have innovated on launching several product features, content and research services and in building of the largest audience pool. We are part of the Times of India Group, India's biggest Media Conglomerate. HSI Team Mr Sudhir Pai, Business Head, Magicbricks.com Ms E Jayashree Kurup, Head Content & Research, Magicbricks.com Mr Rishab Jain, Manager, Content & Research, Magicbricks.com

24
Housing Sentiment Index (HSI)
") An IIMB Magicbricks Initiative Housing Sentiment Index (HSI) Q1 2014 (April June 2014) EXECUTIVE SUMMARY l Home buyers across nine of the ten cities surveyed expect real estate prices to rise over the
An IIMB Magicbricks Initiative Housing Sentiment Index (HSI) Q1 2014 (April June 2014) EXECUTIVE SUMMARY l Home buyers across nine of the ten cities surveyed expect real estate prices to rise over the
Housing Sentiment Index (HSI)
") HOUSING An IIMB SENTIMENT Magicbricks INDEX Initiative (HSI) Housing Sentiment Index (HSI) 20 (Oct Dec 20) EXECUTIVE SUMMARY Sentiment plunged by 29% to 81 turning sharply negative for the first time in
HOUSING An IIMB SENTIMENT Magicbricks INDEX Initiative (HSI) Housing Sentiment Index (HSI) 20 (Oct Dec 20) EXECUTIVE SUMMARY Sentiment plunged by 29% to 81 turning sharply negative for the first time in
JANUARY 2018 CONSUMER SENTIMENT REPORT. What does 2018 have in store for Indian Real Estate?
 JANUARY 2018 CONSUMER SENTIMENT REPORT What does 2018 have in store for Indian Real Estate? While real estate has grown significantly in recent years, it has been largely unregulated which led to lack
Economy & Glance
 ECONOMIC RESEARCH Knight Frank Economy & Realty @ Glance June 2013 National Capital Region ECONOMY & REALTY @ glance Market Overview Among the various segments of the real estate market, office, retail
INDIAN REALESTATE MARKET OVERVIEW
 INDIAN REALESTATE MARKET OVERVIEW 2013-14 INDIA AT A GLANCE Capital States Area Coastline : New Delhi : 28 States and 7 U.T. : 3.28 million Sq. Km : 7,516 km Population : 1.27 Billion (aprox.) Major Cities
ECONOMIC CURRENTS. Vol. 4, Issue 3. THE Introduction SOUTH FLORIDA ECONOMIC QUARTERLY
 ECONOMIC CURRENTS THE Introduction SOUTH FLORIDA ECONOMIC QUARTERLY Vol. 4, Issue 3 Economic Currents provides an overview of the South Florida regional economy. The report presents current employment,
REAL ESTATE SENTIMENT INDEX 1 st Quarter 2016
 About Real Estate Sentiment Index (RESI) The Real Estate Sentiment Index (RESI) is jointly developed by the Real Estate Developers Association of Singapore (REDAS) and the Department of Real Estate (DRE),
COMMERCIAL PROPERTY PRICES REMAIN IN SLOWDOWN PATTERN AS MARKET REACTS TO INVESTOR PULLBACK
 CCRSI RELEASE MARCH 2016 (With data through February 2016) COMMERCIAL PROPERTY PRICES REMAIN IN SLOWDOWN PATTERN AS MARKET REACTS TO INVESTOR PULLBACK DESPITE DECLINE IN PROPERTY PRICING, LEASING ACTIVITY
Property. Mashreq. Economic Overview. Wealth Gauge
 Wealth Gauge Volume 23 November 2015 Economic Overview In spite of the dip in Global Oil prices the GDP for 2015 grew at 3.5. The UAE economic growth is expected to slow down and grow at 2.9 in 2016 driven
BUILDER SURVEY REPORT
 BUILDER SURVEY REPORT December 2017 The Indian real estate industry is fetching the benefits of a reformdriven environment that is improving investor confidence while preparing the grounds for a more organised
ECONOMIC CURRENTS. Vol. 3, Issue 1. THE SOUTH FLORIDA ECONOMIC QUARTERLY Introduction
 ECONOMIC CURRENTS THE SOUTH FLORIDA ECONOMIC QUARTERLY Introduction Economic Currents provides an overview of the South Florida regional economy. The report contains current employment, economic and real
REAL ESTATE SENTIMENT INDEX 2 nd Quarter 2018
 About Real Estate Sentiment Index (RESI) The Real Estate Sentiment Index (RESI) is jointly developed by the Real Estate Developers Association of Singapore (REDAS) and the Department of Real Estate (DRE),
TOP 10 CITIES IN THE INDIAN REAL ESTATE MARKET [MAY 2015] PROPEQUITY Creating Investor Intelligence TOP 10 CITIES IN THE INDIAN REAL ESTATE MARKET
![TOP 10 CITIES IN THE INDIAN REAL ESTATE MARKET [MAY 2015] PROPEQUITY Creating Investor Intelligence TOP 10 CITIES IN THE INDIAN REAL ESTATE MARKET](/thumbs/74/69905039.jpg "TOP 10 CITIES IN THE INDIAN REAL ESTATE MARKET [MAY 2015] PROPEQUITY Creating Investor Intelligence TOP 10 CITIES IN THE INDIAN REAL ESTATE MARKET") TOP 10 CITIES IN THE INDIAN REAL ESTATE MARKET [MAY 2015] PROPEQUITY Creating Investor Intelligence TOP 10 CITIES IN THE INDIAN REAL ESTATE MARKET FOREWORD This year, only 2 major economies have been given
TOP 10 CITIES IN THE INDIAN REAL ESTATE MARKET [MAY 2015] PROPEQUITY Creating Investor Intelligence TOP 10 CITIES IN THE INDIAN REAL ESTATE MARKET FOREWORD This year, only 2 major economies have been given
1 February FNB House Price Index - Real and Nominal Growth
 1 February 2017 MARKET ANALYTICS AND SCENARIO FORECASTING UNIT JOHN LOOS: HOUSEHOLD AND PROPERTY SECTOR STRATEGIST 087-328 0151 john.loos@fnb.co.za THEO SWANEPOEL: PROPERTY MARKET ANALYST 087-328 0157
MARKET STRATEGY VIEWPOINT U.S. Housing Decelerating
 Jan-01 Oct-01 Jul-02 Apr-03 Jan-0 Oct-0 Jul-05 Apr-0 Jan-07 Oct-07 Jul-08 Apr-09 Jan-10 Oct-10 Jul-11 Apr-12 Jan-13 Oct-13 Jul-1 Apr-15 Jan-1 Oct-1 Jul-17 Apr-18 U.S. Housing Decelerating August 27, 2018
Why residential property prices never fell in cities
 Why residential property prices never fell in cities Amit Shanbaug & Sakina Babwani, ET Bureau Jan 16, 2012, 10.23AM IST The last time Bharat Sharma went looking for a house that fit his budget of Rs 40
ARLA Members Survey of the Private Rented Sector
 Prepared for The Association of Residential Letting Agents ARLA Members Survey of the Private Rented Sector Second Quarter 2014 Prepared by: O M Carey Jones 5 Henshaw Lane Yeadon Leeds LS19 7RW June, 2014
1 June FNB House Price Index - Real and Nominal Growth MAY FNB HOUSE PRICE INDEX FINDINGS
 1 June 2016 MARKET ANALYTICS AND SCENARIO FORECASTING UNIT JOHN LOOS: HOUSEHOLD AND PROPERTY SECTOR STRATEGIST 087-328 0151 john.loos@fnb.co.za THEO SWANEPOEL: PROPERTY MARKET ANALYST 087-328 0157 tswanepoel@fnb.co.za
6 April 2018 KEY POINTS
 6 April 2018 MARKET ANALYTICS AND SCENARIO FORECASTING UNIT JOHN LOOS: HOUSEHOLD AND PROPERTY SECTOR STRATEGIST 087-328 0151 john.loos@fnb.co.za THULANI LUVUNO: STATISTICIAN 087-730 2254 thulani.luvuno@fnb.co.za
Property. Mashreq. Economic Overview. Wealth Gauge.
 Economic Overview United Arab Emirates has continued to benefit from surging confidence, safeheaven status, rising population and stable world class real estate market opportunities. The macroeconomic
Residential property in 4 out of the 5 most-preferred international markets earned positive returns over 5 years
 Indians spends on overseas homes swell manifolds: Knight Frank-IREX report Buying international homes cheaper today vis-à-vis 2016 Residential property in 4 out of the 5 most-preferred international markets
ECONOMIC CURRENTS. Vol. 5 Issue 2 SOUTH FLORIDA ECONOMIC QUARTERLY. Key Findings, 2 nd Quarter, 2015
 ECONOMIC CURRENTS THE Introduction SOUTH FLORIDA ECONOMIC QUARTERLY Economic Currents provides an overview of the South Florida regional economy. The report presents current employment, economic and real
Economy & Strategy. Quick Insight. Urban Residential Real Estate - No signs of pick-up yet AMBIT INSIGHTS. Analysis Meeting Note News Impact
 Economy & Strategy Urban Residential Real Estate - No signs of pick-up yet In our July 2015 note, we said that a combination of supply-side and demand-side factors have led to a broad-based real estate
Profile of International Home Buyers in Florida
 Profile of International Home Buyers in Florida Research Division National Association of REALTORS 2009 Prepared for the Florida Association of REALTORS 2009 National Association of REALTORS Profile of
REAL ESTATE SENTIMENT INDEX 1 st Quarter 2014
 About Real Estate Sentiment Index (RESI) The Real Estate Sentiment Index (RESI) is jointly developed by the Real Estate Developers Association of Singapore (REDAS) and the Department of Real Estate (DRE),
BRISBANE HOUSING MARKET STUDY
 BRISBANE HOUSING MARKET 2018 STUDY Executive Summary Brisbane s residential market, especially the detached houses segment has risen steadily over the last year due to the rise in population, falling unemployment
REAL ESTATE IN INDIA 2017
 Now Available REAL ESTATE IN INDIA 2017 Segment Analysis, Outlook and Opportunities Report (PDF) Data-set (Excel) India Infrastructure Research Real Estate in India 2017 Table of Contents SECTION I: MARKET
Released: April 8, 2011
 Released: April 8, 2011 Commentary 2 The Numbers That Drive Real Estate 3 Special Report 9 Brought to you by: KW Research Commentary The housing market continues on a relatively stable and balanced track.
Linkages Between Chinese and Indian Economies and American Real Estate Markets
 Linkages Between Chinese and Indian Economies and American Real Estate Markets Like everything else, the real estate market is affected by global forces. ANTHONY DOWNS IN THE 2004 presidential campaign,
14 September 2015 MARKET ANALYTICS AND SCENARIO FORECASTING UNIT. JOHN LOOS: HOUSEHOLD AND PROPERTY SECTOR STRATEGIST
 14 September 2015 MARKET ANALYTICS AND SCENARIO FORECASTING UNIT JOHN LOOS: HOUSEHOLD AND PROPERTY SECTOR STRATEGIST 087-328 0151 john.loos@fnb.co.za THEO SWANEPOEL: PROPERTY MARKET ANALYST 087-328 0157
REAL ESTATE SENTIMENT INDEX 3 rd Quarter 2014
 About Real Estate Sentiment Index (RESI) The Real Estate Sentiment Index (RESI) is jointly developed by the Real Estate Developers Association of Singapore (REDAS) and the Department of Real Estate (DRE),
Property. Mashreq. Economic Overview. Wealth Gauge.
 Economic Overview The UAE economy has registered a growth of 5.2 in 2013. In spite of the dip in Oil prices globally the economy is expected to have registered a GDP growth between 4.7-4.8 in 2014. The
ANNUAL HOUSE PRICE GROWTH RISES TO 4.5%
 ANNUAL HOUSE PRICE GROWTH RISES TO 4.5% 07/11/2017 +4.5% Annual change +0.3% Monthly change +2.3% Quarterly change 225,826 Average Price House prices in the last three months (August-October) were 2.3%
Hamilton s Housing Market and Economy
 Hamilton s Housing Market and Economy Growth Indicator Report November 2016 hamilton.govt.nz Contents 3. 4. 5. 6. 7. 7. 8. 9. 10. 11. Introduction New Residential Building Consents New Residential Sections
Housing and Construction Quarterly
 New Zealand Housing and Construction Quarterly March 2015 Contents 2 Quarterly Highlights Housing Market 3 House Values by Region 4 Rents by Region 5 Rents by Bedroom and Region 6 Price and Rent Comparisons
Housing Price Forecasts. Illinois and Chicago PMSA, January 2018
 Housing Price Forecasts Illinois and Chicago PMSA, January 2018 Presented To Illinois Realtors From R E A L Regional Economics Applications Laboratory, Institute of Government and Public Affairs University
DUNA HOUSE BAROMETER. July month issue THE LATEST PROPERTY MARKET INFO FROM DUNA HOUSE NETWORK
 DUNA HOUSE BAROMETER 73. issue July month 2017 THE LATEST PROPERTY MARKET INFO FROM DUNA HOUSE NETWORK www.dh.hu PRIVACY POLICY Statistical information and estimates published in the Duna House Barometer
Released: June 7, 2010
 Released: June 7, 2010 Commentary 2 The Numbers That Drive Real Estate 3 Recent Government Action 9 Topics for Home Buyers, Sellers, and Owners 11 Brought to you by: KW Research Commentary The housing
Bargara Property Factsheet
 Bargara Property Factsheet 1st Half 2018 OVERVIEW Bargara* is located in the Bundaberg Region of south-east Queensland, approximately 384km north of Brisbane s CBD. Over the last 7 years the population
THE REAL ESTATE BOARD OF NEW YORK REAL ESTATE BROKER CONFIDENCE INDEX THIRD QUARTER 2016
 THE REAL ESTATE BOARD OF NEW YORK REAL ESTATE BROKER CONFIDENCE INDEX THIRD QUARTER 2016 EXECUTIVE SUMMARY REAL ESTATE BROKER CONFIDENCE INDEX THIRD QUARTER 2016 The Real Estate Board of New York s (REBNY)
IL&FS-Milestone Fund -
 A Yield Driven Real Estate Fund January - March 2015 Dear Investors IL&FS-Milestone Fund - We are pleased to present the Fund Update for the period ending March 31st 2015 for the IL&FS Milestone Fund II
METROPOLITAN TRACT PERFORMANCE REPORT For the Quarter Ended March 31, 2008
 F-5 METROPOLITAN TRACT PERFORMANCE REPORT For the Quarter Ended March 31, 2008 Finance, Audit & Facilities Committee June 12, 2008 CONSOLIDATED METROPOLITAN TRACT PROPERTIES Quarterly Summary Quarterly
Rating Rationale Artsy Homes Real Estate Private Limited 4 Jun Coup on. Maturi ty Date. 29-Jun Zero
 Rating Rationale Artsy Homes Real Estate Private Limited 4 Jun 2018 Brickwork Ratings reaffirms the rating for the Non-Convertible Debentures of. 25,16,00,008/- by Artsy Homes Real Estate Private Limited
ECONOMIC CURRENTS. Vol. 3, Issue 3 SOUTH FLORIDA ECONOMIC QUARTERLY. Introduction
 ECONOMIC CURRENTS THE Introduction SOUTH FLORIDA ECONOMIC QUARTERLY Economic Currents provides an overview of the South Florida regional economy. The report presents current employment, economic and real
Inner Perth Residential Market Report
 Inner Perth Residential Market Report MARCH QUARTER 2014 Inner Perth Residential Market Market Highlights While Western Australia will experience slowed short term growth as the state transitions from
Residential Commentary Sydney Apartment Market
 Residential Commentary Sydney Apartment Market April 2017 Executive Summary Sydney Apartment Market: Key Indicators 14,200 units are currently under construction in Inner Sydney with completion expected
Rightmove House Price Index
 Rightmove House Price Index The largest monthly sample of residential property prices January 2018 London edition Asking prices down 1.4% in London this month as sellers tempt New Year buyers New-to-market
San Francisco Bay Area to Napa County Housing and Economic Outlook
 San Francisco Bay Area to 019 Napa County Housing and Economic Outlook Bay Area Economic Forecast Summary Presented by Pacific Union International, Inc. and John Burns Real Estate Consulting, LLC On Nov.
Residential September 2010
 Residential September 2010 Karl L. Guntermann Fred E. Taylor Professor of Real Estate Adam Nowak Research Associate For the first time since March, house prices turned down slightly in August (-2 percent)
NAB COMMERCIAL PROPERTY SURVEY Q4 2017
 EMBARGOED UNTIL 11.30 AM WEDNESDAY 21 FEBRUARY 2018 NAB COMMERCIAL PROPERTY SURVEY Q4 2017 Date February 2018 NAB Behavioural & Industry Economics KEY FINDINGS The NAB Commercial Property Index (a measure
DUBAI HOUSING MARKET STUDY 2017
 DUBAI HOUSING MARKET STUDY 217 Executive Summary Dubai residential market has been a story of increased supply and unsold stock resulting in declining prices over the last three years. Soft price corrections
June 12, 2018 I Research. Real Estate: Yearly Update and Outlook
 Real Estate: Yearly Update and Outlook Contact: Madan Sabnavis Chief Economist madan.sabnavis@careratings.com 91-22-67543489 Ashish K Nainan Research Analyst ashish.nainan@careratings.com 91-22-67543443
Creswick Property Factsheet
 Creswick Property Factsheet 1st Half 2018 OVERVIEW Creswick, located 129km north west of Melbourne is 430m above sea level. A population of 3,170 was recorded in the 2016 ABS census. The area provides
2017 Land Market Survey
 2017 Land Market Survey Presented By National Association of REALTORS Research Division Lawrence Yun, Ph.D. Senior Vice President & Chief Economist Danielle Hale, MS, Managing Director, Housing Research
STABLE OCCUPANCY DESPITE RAMPED UP SUPPLY
 COLLIERS QUARTERLY RESIDENTIAL MANILA Q3 2018 20 NOVEMBER 2018 Joey Roi Bondoc Manager Research Philippines +(632) 858 9057 Joey.Bondoc@colliers.com STABLE OCCUPANCY DESPITE RAMPED UP SUPPLY Summary &
Estimating National Levels of Home Improvement and Repair Spending by Rental Property Owners
 Joint Center for Housing Studies Harvard University Estimating National Levels of Home Improvement and Repair Spending by Rental Property Owners Abbe Will October 2010 N10-2 2010 by Abbe Will. All rights
16 April 2018 KEY POINTS
 16 April 2018 MARKET ANALYTICS AND SCENARIO FORECASTING UNIT JOHN LOOS: HOUSEHOLD AND PROPERTY SECTOR STRATEGIST FNB HOME LOANS 087-328 0151 john.loos@fnb.co.za THULANI LUVUNO: STATISTICIAN 087-730 2254
Economy. Denmark Market Report Q Weak economic growth. Annual real GDP growth
 Denmark Market Report Q 1 Economy Weak economic growth In 13, the economic growth in Denmark ended with a modest growth of. % after a weak fourth quarter with a decrease in the activity. So Denmark is
Monthly Indicators + 7.3% + 6.6% + 8.3% Single-Family Market Overview Condo Market Overview New Listings Pending Sales.
 Monthly Indicators 2018 The three most prominent national market trends for residential real estate are the ongoing lack of abundant inventory, the steadily upward movement of home prices and year-over-year
MONTHLY REALTY WATCH NORTH & EAST INDIA - APR Confidential for Private Circulation Only
 MONTHLY REALTY WATCH NORTH & EAST INDIA - APR 2016 Confidential for Private Circulation Only Key Insights Across North & East cities of the country, new launches during March witnessed a decline of ~79%
RP Data - Nine Rewards Consumer housing market sentiment survey Released: Thursday 24 October, 2013
 National Media Release RP Data - Nine Rewards Consumer housing market sentiment survey Released: Thursday 24 October, 2013 Housing market confidence dips in October 1,045 Australian residents respond to
nd Quarter Market Report
 2015 2 nd Quarter Market Report The voice of real estate in Central Virginia CAAR Member Copy Expanded Edition Charlottesville Area 2 nd Quarter 2015 Highlights: Closed sales in the Greater Charlottesville
Corridor of growth. Corridor Description and Rating UNDRI - PISOLI. Areas Included: Undri, Pisoli, Handewadi and Mohammedwadi
 Corridor of growth Corridor Description and Rating Areas Included: Undri, Pisoli, Handewadi and Mohammedwadi UNDRI - PISOLI Fig 1: Map of the corridor 02 About the Corridor Introduction The Undri Corridor
San Francisco Bay Area to Marin, San Francisco, and San Mateo Counties Housing and Economic Outlook
 San Francisco Bay Area to 019 Marin, San Francisco, and San Mateo Counties Housing and Economic Outlook Bay Area Economic Forecast Summary Presented by Pacific Union International, Inc. and John Burns
Appendix 1: Gisborne District Quarterly Market Indicators Report April National Policy Statement on Urban Development Capacity
 Appendix 1: Gisborne District Quarterly Market Indicators Report April 2018 National Policy Statement on Urban Development Capacity Quarterly Market Indicators Report April 2018 1 Executive Summary This
Table of Contents. Company Overview. About Collateral Risk Management (CRM)
") Table of Contents 1 Company Overview P.E. Analytics (PropEquity) Services and Products Some Key Clients Pan India Coverage 40 Cities PropEquity The Brand 2 About Collateral Risk Management (CRM) Salient
Table of Contents 1 Company Overview P.E. Analytics (PropEquity) Services and Products Some Key Clients Pan India Coverage 40 Cities PropEquity The Brand 2 About Collateral Risk Management (CRM) Salient
September bounce in house price sentiment
 Knight Frank/Markit House Price Sentiment Index (HPSI) SEPTEMBER 2012 September bounce in house price sentiment Key headlines for September UK households perceive that the value of their home declined
BONDREPORT QTR BONDNEWYORK.COM
 BONDREPORT QTR 4 2018 BONDREPORT QTR 4 2018 WELCOME TO THE 23RD EDITION OF THE BOND REPORT Looking back on 2018, the year can perhaps best be described as a consistent movement towards corrections. After
PROPINSIGHT A Detailed Property Analysis Report
 PROPINSIGHT A Detailed Property Analysis Report 40,000+ Projects 10,000+ Builders 1,200+ Localities Report Created On - 7 Oct, 2015 Price Insight This section aims to show the detailed price of a project
Kalyan-Dombivli. Locality Report. Overview. Fig: Kalyna-Dombivli political map (Source: Google Maps)
") Locality Report Kalyan-Dombivli Overview Fig: Kalyna-Dombivli political map (Source: Google Maps) Kalyan-Dombivli is a twin city on the outskirts of Thane. It is governed by the Kalyan-Dombivli Municipal
Locality Report Kalyan-Dombivli Overview Fig: Kalyna-Dombivli political map (Source: Google Maps) Kalyan-Dombivli is a twin city on the outskirts of Thane. It is governed by the Kalyan-Dombivli Municipal
Housing Market Cycles
 MEGA AGENT Market Update Gary Keller and Jay Papasan 2 The U.S. Housing Market Keller Williams Realty, Inc. Housing Market Cycles 4 The U.S. Housing Market Housing Market Cycles 5 The U.S. Housing Market
2018 Housing Market Outlook. Central Coast Realty Group Business Symposium February 22, 2018 Oscar Wei Senior Economist
 2018 Housing Market Outlook Central Coast Realty Group Business Symposium February 22, 2018 Oscar Wei Senior Economist Overview Economic Update California Housing Market Outlook Regional Housing Market
Housing market moving into a renewed up-cycle
 214 Housing market moving into a renewed up-cycle The growth in asking prices for property accelerated in the third quarter, up 3.1 per cent on the previous quarter, and 4.7 per cent on a year earlier
RESIDENTIAL PROPERTY PRICE INDEX (RPPI)
") EUROSYSTEM RESIDENTIAL PROPERTY PRICE INDEX (RPPI) 2018 Q1 The residential property price index is still on an upward trend 1 The RPPI 1 (houses and apartments) increased by 0,6% in 2018Q1. This was the
EUROSYSTEM RESIDENTIAL PROPERTY PRICE INDEX (RPPI) 2018 Q1 The residential property price index is still on an upward trend 1 The RPPI 1 (houses and apartments) increased by 0,6% in 2018Q1. This was the
UDIA WA PROPERTY MARKET STATISTICS
 UDIA WA PROPERTY MARKET STATISTICS APRIL 218 1 IN THIS ISSUE KEY TRENDS INDUSTRY UPDATE ECONOMY RESIDENTIAL LAND DEVELOPMENT RESIDENTIAL PROPERTY SETTLEMENTS RESIDENTIAL PROPERTY MARKET RESIDENTIAL CONSTRUCTION
ARLA Members Survey of the Private Rented Sector
 Prepared for The Association of Residential Letting Agents & the ARLA Group of Buy to Let Mortgage Lenders ARLA Members Survey of the Private Rented Sector Fourth Quarter 2010 Prepared by: O M Carey Jones
PROPINSIGHT A Detailed Property Analysis Report
 PROPINSIGHT A Detailed Property Analysis Report 40,000+ Projects 10,000+ Builders 1,200+ Localities Report Created On - 7 Oct, 2015 Price Insight This section aims to show the detailed price of a project
Q B O S T O N M A R K E T R E P O R T
 Q 3 2 1 7 B O S T O N M A R K E T R E P O R T Introducing the Compass Q3 217 Greater Boston Market Report Page 2 Page 3 Page 5 Page 7 Page 8 Map of Coverage Area Single Family Overview Condo Overview Time
UDIA WA PROPERTY MARKET STATISTICS
 UDIA WA PROPERTY MARKET STATISTICS OCTOBER 217 1 IN THIS ISSUE KEY TRENDS INDUSTRY UPDATE 3 4 ECONOMY RESIDENTIAL LAND DEVELOPMENT RESIDENTIAL PROPERTY SETTLEMENTS RESIDENTIAL PROPERTY MARKET RESIDENTIAL
THE AGGREGATETM 4TH QUARTER 2015
 THE AGGREGATETM 4TH QUARTER INTRODUCTION 4TH QUARTER Welcome to The Aggregate, the quarterly residential market report published by TOWN Residential. As New York s leading fully-integrated residential
Q Cap Rate Report
 RESEARCH Q1 2018 CALKAIN RESEARCH 12930 Worldgate Dr Suite 150 Herndon, VA 20170 703.787.4714 calkain.com Q1 2018 Overview A counter-intuitive trend marked cap rate movement in the first quarter of 2018.
August 2012 Design by Anderson Norton Design
 August 2012 Design by Anderson Norton Design 020 7336 6992 Property Data Report 2012 Introduction 1 Commercial property by comparison UK commercial property s value in 2011 reached 717 billion, helped
TOP-TIER REAL ESTATE REPORT
 TOP-TIER REAL ESTATE REPORT JAN 1 - JUN 30, 2015 TOP-TIER REAL ESTATE REPORT TABLE OF CONTENTS INTRODUCTION 3 NATIONAL SUMMARY 4 VANCOUVER 7 Vancouver Market Summary 8 Overall Market 11 Condominiums 13
AFFORDABLE HOUSING. April 2018 I Volume 32
 AFFORDABLE HOUSING April 2018 I Volume 32 1 01 02 03 04 05 06 07 2 April 2018 I Volume 32 April 2018 I Volume 32 3 4 April 2018 I Volume 32 Change in Housing Prices Prices rose in 32 of 50 cities in the
TOP-TIER REAL ESTATE REPORT 2014 YEAR END REPORT
 TOP-TIER REAL ESTATE REPORT 2014 YEAR END REPORT TOP-TIER REAL ESTATE REPORT TABLE OF CONTENTS INTRODUCTION 3 NATIONAL SUMMARY 4 VANCOUVER MARKET SUMMARY 7 Overall Market 11 Condominiums 13 Attached Homes
2012 Profile of Home Buyers and Sellers Texas Report
 2012 Profile of Home and Sellers Report Prepared for: Association of REALTORS Prepared by: NATIONAL ASSOCIATION OF REALTORS Research Division December 2012 2012 Profile of Home and Sellers Report Table
Housing Price Forecasts. Illinois and Chicago PMSA, March 2018
 Housing Price Forecasts Illinois and Chicago PMSA, March 2018 Presented To Illinois Realtors From R E A L Regional Economics Applications Laboratory, Institute of Government and Public Affairs University
BACKGROUND & METHODOLOGY Introducing the Housing Affordability Sentiment Index... 3 THE HASI The final HASI score... 6
 1 CONTENTS BACKGROUND & METHODOLOGY... 4 Introducing the Housing Affordability Sentiment Index... 3 BACKGROUND & METHODOLOGY... 4 THE HASI... 5 The final HASI score... 6 THE HASI WHEEL... 7 Other demographics
Housing Price Forecasts. Illinois and Chicago PMSA, December 2015
 Housing Price Forecasts Illinois and Chicago PMSA, December 2015 Presented To Illinois Association of Realtors From R E A L Regional Economics Applications Laboratory, Institute of Government and Public
House prices fall in June, but households in most regions optimistic about price rises over next 12 months
 Knight Frank/Markit House Price Sentiment Index (HPSI) JUNE 2012 House prices fall in June, but households in most regions optimistic about price rises over next 12 months Key headlines for June UK households
Value of Building Work Put in Place: March 2013 quarter
 Value of Building Work Put in Place: March 2013 quarter Embargoed until 10:45am 05 June 2013 Key facts For the March 2013 quarter, after price changes and seasonal variations are removed: Residential building
Performance of the Private Rental Market in Northern Ireland
 Summary Research Report July - December Performance of the Private Rental Market in Northern Ireland Research Report July - December 1 Northern Ireland Rental Index: Issue No. 8 Disclaimer This report
HOUSING MARKET REPORT BERLIN 2018: NO END IN SIGHT TO PRICE UPTREND. - Asking rents for apartments rise 8.8 percent to 9.79 per sq m and month in 2017
 PRESS RELEASE HOUSING MARKET REPORT BERLIN 2018: NO END IN SIGHT TO PRICE UPTREND - Asking rents for apartments rise 8.8 percent to 9.79 per sq m and month in 2017 - Focus of new construction shifts from
REAL ESTATE MARKET OVERVIEW 1 st Half of 2015
 REAL ESTATE MARKET OVERVIEW 1 st Half of 2015 With Comparisons to the 2 nd Half of 2014 September 4, 2015 Prepared for: First Bank of Wyoming Prepared by: Ken Markert, AICP MMI Planning 2319 Davidson Ave.
MonthlyStatistics OCTOBER 2018
 MonthlyStatistics OCTOBER 2018 FOR IMMEDIATE RELEASE November 1, 2018 Prices Continue Rising Despite Moderating Sales NANAIMO, BC Sales of single-family homes in October were 11 per cent higher than in
Reveals National Economy Hurting Local Commercial Markets
 Latest SIOR Index Reveals National Economy Hurting Local Commercial Markets Lawrence Yun is Senior Vice President and Chief Economist at the NATIONAL ASSOCIATION OF REALTORS. He writes regular columns
Alexandria Property Factsheet
 Alexandria Property Factsheet 1st Half 2018 OVERVIEW Alexandria is an inner-eastern Sydney suburb located approx. 4km south of the Sydney CBD. Formerly recognised as an industrial suburb, it is now growing
San Francisco Bay Area to Santa Clara & San Benito Counties Housing and Economic Outlook
 San Francisco Bay Area to 019 Santa Clara & San Benito Counties Housing and Economic Outlook Bay Area Economic Forecast Summary Presented by Pacific Union International, Inc. and John Burns Real Estate
Economic Spotlight September 1, 2009
 Economic Spotlight September 1, 29 Update on Alberta s Housing Market Summary Alberta s housing market is beginning to show signs of recovery. Housing starts have rebounded from March lows and activity
MONTHLY STATISTICS PACKAGE
 MONTHLY STATISTICS PACKAGE FEBRUARY 2019 FOR IMMEDIATE RELEASE March 1, 2019 Guideline B-20 Continues to Dampen Housing Sales NANAIMO, BC Sales of single-family homes in February board-wide dipped by 28