PROPERTY BAROMETER FNB Area Value Band House Price Indices
|
|
|
- Hester Bruce
- 6 years ago
- Views:
Transcription
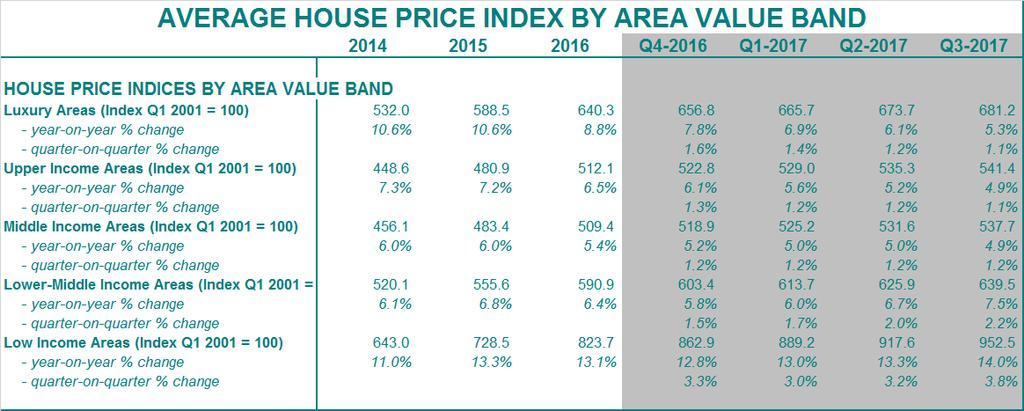
1 PROPERTY BAROMETER FNB Area Value Band House Price Indices The Luxury Area Value Band has seen the most noticeable price growth slowdown since 2014, while the Lower End has done a little better of late. FNB AREA VALUE BAND HOUSE PRICE INDEX PERFORMANCES 17 October 2017 We compile 5 FNB Area Value Band House Price Indices (see note at the end of this report regarding the methodology). These indices group areas according to their average home transaction values, using deeds data, and include all cities and towns in South Africa. The 5 indices are the Luxury Area House Price Index (Average Price = R2.271 million), the Upper Income Area House Price Index (Average Price = R1.231 million), the Middle Income Area House Price Index (Average Price = R873,238), the Lower Middle Income Area House Price Index (Average Price = R569,505), and the Low Income Area House Price Index (Average Price = R345,208) The 3 rd quarter 2017 results show some further slowing in the year-on-year house price growth rates of the 3 highest priced area value bands, but some acceleration in the growth of the 2 lowest priced ones. The Low Income Area House Price Index was the strongest performer in terms of year-on-year house price growth, recording 14%% year-on-year for the 3 rd quarter. This is an acceleration on the prior quarter s revised 13.3%. We must caution, however, about major potential distortions in this index. This index includes the subsidized housing component, and new homes in this category, which are not sold to their new owners, are registered at a value with the deeds office which does not reflect any market value. Over the years, there have also been periodic sell-offs of rental stock by councils which have not necessarily taken place at market value. Such distortions mean that in a repeat sales index for Low Income Areas, many homes prices come of a very low base not reflective of market values, and show major price inflation when resold at market value at a later stage. We are thus very careful as to how we interpret the results in this Low Income Area Value Band. Moving 1 value band up, however, we also see some acceleration in the Lower Middle Income Area Value Band s year-on-year house price growth, from a 2 nd quarter 6.7% to 7.5% in the 3 rd quarter. This value band now boasts the 2 nd highest average house price growth. In the 3 area value bands above this, however, year-on-year house price growth slowed in the 3 rd quarter of 2017, the Middle Income Area Value Band from 5% in the 2 nd quarter to 4.9%, the Upper Income Area Value Band from 5.2% to 4.9%, and the Luxury Area Value Band from 6.1% to 5.3%. Therefore, while not yet having the slowest year-on-year house price growth, the Luxury Area Valua Band s rate has slowed the most noticeably in the 3 rd quarter of 2017.

2 (with all the above-mentioned warnings) at 3.8%. On a quarter-on-quarter basis, a better indicator of recent price growth momentum than the year-on-year calculation, there has been a strong convergence of the 3 highest priced area value bands. The Luxury and Upper Income Area Value Bands both showed quarter-on-quarter growth of 1.1% in the 3 rd quarter, with Middle Income Areas slightly higher at 1.2%. Noticeably higher growth was seen in the Lower Middle Income Area Value Band, to the tune of 2.2%, and Low Income Areas This, in short, all points to superior performance at the lower-priced end of the market where average process are well-below R1m. The most significant year-on-year house price growth slowing in recent years has been in the Luxury Area Value Band, from an 11.1% high back in the final quarter of 2014 to the most recent 5.3%, followed by the Upper Income Value Band whose growth has slowed from 7.5% at the end of 2014 to 4.9%. FNB S VALUERS HAVE ALSO PERCEIVED A MORE NOTICEABLE HIGH END WEAKENING OFF A HIGHER BASE The more significant softening off a higher growth base by the higher end appears to tie in with what FNB s Valuers perceive about the market. year. In the FNB Valuers Market Strength Indices (MSI) by Income Areas (selfdefined by the valuers), the Upper Income Area MSI has weakened the most, from a multi-year high of at the end of 2015 to in the 3 rd quarter of By comparison, the Middle Income Area MSI has declined slightly from in the 3 rd quarter of 2015 to in the 3 rd quarter of 2017, while the Lower Income Area MSI has only shown a more recent very slight decline from in the 3 rd quarter of 2016 to by the 3 rd quarter of this As yet, however, the valuers as a group have not perceived a strengthening at the Lower Income Area End. The High End of the market thus appears to have led the slowdown of recent years
3 FNB ESTATE AGENT SURVEY ALSO POINTS TO MORE NOTICEABLE SLOWING AT UPPER END SINCE 2014 segments on the other hand. JOHN LOOS: HOUSEHOLD AND PROPERTY SECTOR STRATEGIST MARKET ANALYTICS AND SCENARIO FORECASTING UNIT: FNB HOME LOANS Tel: The information in this publication is derived from sources which are regarded as accurate and reliable, is of a general nature only, does not constitute advice and may not be applicable to all circumstances. Detailed advice should be obtained in individual cases. No responsibility for any error, omission or loss sustained by any person acting or refraining from acting as a result of this publication is accepted by Firstrand Group Limited and / or the authors of the material. First National Bank a division of FirstRand Bank Limited. An Authorised Financial Services provider. Reg No. 1929/001225/06 The more significant upper end slowing has also been apparent in the FNB Estate Agent Survey in recent years. Upper End homes tend to naturally stay on the market for a longer time on average prior to sales than is the case at the lower priced end. However, from 2015 onward we began to notice a widening in the gap in average time of homes on the market between the Luxury (High Net Worth) and Upper Income Area segments on the one hand, and the Middle and Lower Income Area We must just mention that our agent survey s income areas are self-defined by agents, so average home values per segment differ markedly from our own area value band segmentations. In 2014, the Lower Income Area segment (average value = R1.26 million) showed an average time of homes on the market of weeks. This average time has shortened to an 8.81 week average for the 1 st 3 quarters of Middle Income Areas (average price = R1.60 million) saw average time on market go slightly higher from weeks average in 2014 to weeks in the 1 st 3 quarters of The increase in average time on the market in the Upper Income Area segment (average price = R3.44 million) was more significant, from weeks in 2014 to weeks in the 1 st 3 quarters of But the most significant increase in average time on the market was to be found in the High Net Worth Areas (average value = R7.07 million), rising from weeks in 2014 to weeks in the 1 st 3 quarters of In short, since 2014, the higher up the income area ladder we go the more significant the rise in average time of homes on the market appears to have been. Although the FNB Estate Agent Survey Income Areas are very different to our own area value band house price index segmentations, this picture broadly ties in with the FNB Area Value Band House Price Index picture, where the Luxury Area Value Band has shown the most significant slowing off a higher price growth base. IN CONCLUSION The house price growth differential between the 3 highest priced FNB Area Value Band House Price Indices has near completely converged, with all 3 of these segments having shown recent growth slowing. However, the Lower Middle Income and Low Income Area Value Bands have shown some recent renewed acceleration in price growth. This does not come as too much of a surprise, given the financially constrained household sector in a weak economy, and multi-year weakness in consumer confidence. The result is, on average, a more financially cautions household searching for greater home affordability, which should mean some shift in demand towards the more affordable areas of the market.
4 Note: The FNB Area Value Band House Price Indices are derived from Deeds Office Data, utilizing only property transactions by individuals ( natural persons ). There are 5 Area Value Band Indices. The areas are grouped into quintiles according to their average transaction price over the 5 years from 2012 to A quintile does not represent 20% of all areas, but rather a group of areas whose transaction volume (also over the 5 year period 2012 to 2016) accounts for 20% of total transaction volume. For example, Quintile 1, named the Luxury Area Value Band, is the group of areas with the highest transaction price averages in South Africa, making up 20% of the total volume of property transactions by individuals. The indices are named as follows: Quintile 1 Luxury Area Value Band House Price Index Quintile 2 Upper Income Area Value Band House Price Index Quintile 3 Middle Income Area Value Band House Price Index Quintile 4 Lower Middle Income Area Value Band House Price Index Quintile 5 Low Income Area Value Band House Price Index The index methodology used is a repeat sales methodology Given that deeds data is a different dataset to our monthly FNB National House Price Index, and more dated than our own FNB data, the Area Value Band Indices are not exactly comparable with it. Note on the FNB Valuers Market Strength Index: *When an FNB valuer values a property, he/she is required to provide a rating of demand as well as supply for property in the specific area. The demand and supply rating categories are a simple good (100), average (50), and weak (0). From all of these ratings we compile an aggregate demand and an aggregate supply rating, which are expressed on a scale of 0 to 100. After aggregating the individual demand and supply ratings, we subtract the aggregate supply rating from the demand rating, add 100 to the difference, and divide by 2, so that the FNB Valuers Residential Market Strength Index is also depicted on a scale of 0 to 100 with 50 being the point where supply and demand are equal.
5
1 February FNB House Price Index - Real and Nominal Growth
 1 February 2017 MARKET ANALYTICS AND SCENARIO FORECASTING UNIT JOHN LOOS: HOUSEHOLD AND PROPERTY SECTOR STRATEGIST 087-328 0151 john.loos@fnb.co.za THEO SWANEPOEL: PROPERTY MARKET ANALYST 087-328 0157
PROPERTY BAROMETER FNB Mining Towns House Price Indices
 PROPERTY BAROMETER FNB Mining Towns House Price Indices A return to positive growth in Mining production from the latter stages of 2016 and into 2017 appears to be providing some improved support to Mining
PROPERTY BAROMETER FNB House Price Index Early signs of the positive national sentiment shift impacting on national house price trends
 5 June 2018 MARKET ANALYTICS AND SCENARIO FORECASTING UNIT JOHN LOOS: HOUSEHOLD AND PROPERTY SECTOR STRATEGIST 087-328 0151 john.loos@fnb.co.za THULANI LUVUNO: ANALYST 087-730 2254 thulani.luvuno@fnb.co.za
1 June FNB House Price Index - Real and Nominal Growth MAY FNB HOUSE PRICE INDEX FINDINGS
 1 June 2016 MARKET ANALYTICS AND SCENARIO FORECASTING UNIT JOHN LOOS: HOUSEHOLD AND PROPERTY SECTOR STRATEGIST 087-328 0151 john.loos@fnb.co.za THEO SWANEPOEL: PROPERTY MARKET ANALYST 087-328 0157 tswanepoel@fnb.co.za
PROPERTY BAROMETER FNB House Price Index Year-on-year house price growth appears to be approaching a mini-peak, at 4.
 2 October 2017 MARKET ANALYTICS AND SCENARIO FORECASTING UNIT JOHN LOOS: HOUSEHOLD AND PROPERTY SECTOR STRATEGIST 087-328 0151 john.loos@fnb.co.za LIZE ERASMUS: STATISTICIAN 087-335 6664 lize.erasmus@fnb.co.za
6 April 2018 KEY POINTS
 6 April 2018 MARKET ANALYTICS AND SCENARIO FORECASTING UNIT JOHN LOOS: HOUSEHOLD AND PROPERTY SECTOR STRATEGIST 087-328 0151 john.loos@fnb.co.za THULANI LUVUNO: STATISTICIAN 087-730 2254 thulani.luvuno@fnb.co.za
2 July 2018 FNB HOUSE PRICE INDEX RESULTS FOR JUNE 2018 ACCELERATION, BUT FOR HOW LONG?
 2 July 2018 MARKET ANALYTICS AND SCENARIO FORECASTING UNIT JOHN LOOS: HOUSEHOLD AND PROPERTY SECTOR STRATEGIST 087-328 0151 john.loos@fnb.co.za THULANI LUVUNO: ANALYST 087-730 2254 thulani.luvuno@fnb.co.za
PROPERTY BAROMETER Residential Property Affordability Review The recently improving Housing Affordability trend stalled in the 1 st quarter of 2017
 21 June 2017 MARKET ANALYTICS AND SCENARIO FORECASTING UNIT JOHN LOOS: HOUSEHOLD AND PROPERTY SECTOR STRATEGIST FNB HOME LOANS 087-328 0151 john.loos@fnb.co.za LIZE ERASMUS: STATISTICIAN 087-335 6664 lize.erasmus@@fnb.co.za
14 September 2015 MARKET ANALYTICS AND SCENARIO FORECASTING UNIT. JOHN LOOS: HOUSEHOLD AND PROPERTY SECTOR STRATEGIST
 14 September 2015 MARKET ANALYTICS AND SCENARIO FORECASTING UNIT JOHN LOOS: HOUSEHOLD AND PROPERTY SECTOR STRATEGIST 087-328 0151 john.loos@fnb.co.za THEO SWANEPOEL: PROPERTY MARKET ANALYST 087-328 0157
16 April 2018 KEY POINTS
 16 April 2018 MARKET ANALYTICS AND SCENARIO FORECASTING UNIT JOHN LOOS: HOUSEHOLD AND PROPERTY SECTOR STRATEGIST FNB HOME LOANS 087-328 0151 john.loos@fnb.co.za THULANI LUVUNO: STATISTICIAN 087-730 2254
FNB-TPN RESIDENTIAL YIELDS REVIEW
 FNB-TPN RESIDENTIAL YIELDS REVIEW 17 November 2015 John Loos, Household and Property Sector Strategist Tel: (087) 328 0151 Cell:083-453 8096 E-mail: john.loos@fnb.co.za Website: http://blog.fnb.co.za/category/economics/
3 November rd QUARTER FNB SEGMENT HOUSE PRICE REVIEW. Affordability of housing
 3 November 2011 3 rd QUARTER FNB SEGMENT HOUSE PRICE REVIEW JOHN LOOS: HOUSEHOLD AND PROPERTY SECTOR STRATEGIST 011-6490125 John.loos@fnb.co.za EWALD KELLERMAN: PROPERTY MARKET ANALYST 011-6320021 ekellerman@fnb.co.za
3 October 2017 KEY POINTS
 3 October 2017 FNB HOME LOANS: MARKET ANALYTICS AND SCENARIO FORECASTING UNIT JOHN LOOS: HOUSEHOLD AND PROPERTY SECTOR STRATEGIST 087-328 0151 John.loos@fnb.co.za THEO SWANEPOEL: PROPERTY MARKET ANALYST
Smoothed Weighted National Housing Index (base = January 2008)
") HOUSING INDEX April 2013 Moderating House Prices 1 1 1 120 Smoothed Weighted National Housing Index (base = January 8) 174.2 119.9 Value Index Volume Index The FNB House Price Index regained some lost
HOUSING INDEX April 2013 Moderating House Prices 1 1 1 120 Smoothed Weighted National Housing Index (base = January 8) 174.2 119.9 Value Index Volume Index The FNB House Price Index regained some lost
Smoothed Weighted National Housing Index (base = January 2008)
") HOUSING INDEX November 2012 New Housing Supply Soften House Prices 200 180 160 140 120 100 80 Smoothed Weighted National Housing Index (base = January 2008) 164.1 143.0 60 40 Value Index Volume Index Data
HOUSING INDEX November 2012 New Housing Supply Soften House Prices 200 180 160 140 120 100 80 Smoothed Weighted National Housing Index (base = January 2008) 164.1 143.0 60 40 Value Index Volume Index Data
Residential building statistics 17 May 2018
 Compiled by Jacques du Toit Property Analyst Absa Home Loans 15 Troye Street Johannesburg 21 PO Box 7735 Johannesburg 2 South Africa Tel +27 ()11 35 7246 jacques@absa.co.za www.absa.co.za Explanatory note:
Smoothed Weighted National Housing Index (base = January 2008)
") HOUSING INDEX January 2014 Rising Volumes Decelerate House Prices For Now 220 200 180 160 1 120 100 80 60 Smoothed Weighted National Housing Index (base = January 2008) Value Index Volume Index Although
HOUSING INDEX January 2014 Rising Volumes Decelerate House Prices For Now 220 200 180 160 1 120 100 80 60 Smoothed Weighted National Housing Index (base = January 2008) Value Index Volume Index Although
Filling the Gaps: Active, Accessible, Diverse. Affordable and other housing markets in Johannesburg: September, 2012 DRAFT FOR REVIEW
 Affordable Land and Housing Data Centre Understanding the dynamics that shape the affordable land and housing market in South Africa. Filling the Gaps: Affordable and other housing markets in Johannesburg:
Residential building statistics 15 February 2018
 Compiled by Jacques du Toit Property Analyst Absa Home Loans 15 Troye Street Johannesburg 21 PO Box 7735 Johannesburg 2 South Africa Tel +27 ()11 35 7246 jacques@absa.co.za www.absa.co.za Explanatory note:
Filling the Gaps: Stable, Available, Affordable. Affordable and other housing markets in Ekurhuleni: September, 2012 DRAFT FOR REVIEW
 Affordable Land and Housing Data Centre Understanding the dynamics that shape the affordable land and housing market in South Africa. Filling the Gaps: Affordable and other housing markets in Ekurhuleni:
Smoothed Weighted National Housing Index (base = January 2008)
") HOUSING INDEX February 2013 House Prices Remain Stubbornly High 1 1 1 120 Smoothed Weighted National Housing Index (base = January 8) 178.6 102.2 Value Index Volume Index The FNB House Price Index fell
HOUSING INDEX February 2013 House Prices Remain Stubbornly High 1 1 1 120 Smoothed Weighted National Housing Index (base = January 8) 178.6 102.2 Value Index Volume Index The FNB House Price Index fell
CITI HABITATS. Manhattan Residential Sales Market Report
 Manhattan Residential Sales Market Report Contents 4/7 12/17 3 8 9 10 Market Wide 4 Sales / Days on Market 5 / Months of Supply 6 7 Market Share Resale Co-ops Resale Condos New Developments 11 Luxury Neighborhoods
How Severe is the Housing Shortage in Hong Kong?
 (Reprinted from HKCER Letters, Vol. 42, January, 1997) How Severe is the Housing Shortage in Hong Kong? Y.C. Richard Wong Introduction Rising property prices in Hong Kong have been of great public concern
Smoothed Weighted National Housing Index (base = January 2008)
") HOUSING INDEX May 2013 Decelerating Real House Prices 1 1 1 120 Smoothed Weighted National Housing Index (base = January 8) 1.2 107.0 Value Index Volume Index The FNB House Price Index regained some lost
HOUSING INDEX May 2013 Decelerating Real House Prices 1 1 1 120 Smoothed Weighted National Housing Index (base = January 8) 1.2 107.0 Value Index Volume Index The FNB House Price Index regained some lost
DIFI-Report. Assessment of the Real Estate Financing Market. Germany 1 st Quarter 2019 Published in February 2019
 DIFI-Report Assessment of the Real Estate Financing Market Germany 1 st Quarter 2019 Published in February 2019 New version of DIFI remains in negative territory Bricks-and-mortar retail: recovery in sight?
Data Note 1/2018 Private sector rents in UK cities: analysis of Zoopla rental listings data
 Data Note 1/2018 Private sector rents in UK cities: analysis of Zoopla rental listings data Mark Livingston, Nick Bailey and Christina Boididou UBDC April 2018 Introduction The private rental sector (PRS)
Trends in Scottish Residential Lettings
 The Citylets Report Issue 1 Spring 2007 Trends in Scottish Residential tings A Tale of Three Cities Introduction citylets.co.uk is Scotland s original residential lettings portal advertising over 45,000
MANHATTAN MARKET REPORT
 MANHATTAN MARKET REPORT 2nd Quarter 2018 RESALE bhhsnyp.com 1 NOTE FROM THE PRESIDENT While temperatures and humidity levels have risen in New York City, consumers have continued to show apprehension this
Planning and Development Department Building and Development Permit Summary Report
 Planning and Development Department 21 Building and Development Permit Summary Report February 22, 21 2 21 Building and Development Permit Summary Table of Contents Introduction... 3 Building Permits...
NAB COMMERCIAL PROPERTY SURVEY Q4 2017
 EMBARGOED UNTIL 11.30 AM WEDNESDAY 21 FEBRUARY 2018 NAB COMMERCIAL PROPERTY SURVEY Q4 2017 Date February 2018 NAB Behavioural & Industry Economics KEY FINDINGS The NAB Commercial Property Index (a measure
PROPERTY BAROMETER FNB City of Cape Town House Price Indices
 13 November 2017 MARKET ANALYTICS AND SCENARIO FORECASTING UNIT JOHN LOOS: HOUSEHOLD AND PROPERTY SECTOR STRATEGIST 087-328 0151 john.loos@fnb.co.za LIZE ERASMUS STATISTICIAN 087-335 6664 lize.erasmus@@fnb.co.za
Housing as an Investment Greater Toronto Area
 Housing as an Investment Greater Toronto Area Completed by: Will Dunning Inc. For: Trinity Diversified North America Limited February 2009 Housing as an Investment Greater Toronto Area Overview We are
Performance of the Private Rental Market in Northern Ireland
 Summary Research Report July - December Performance of the Private Rental Market in Northern Ireland Research Report July - December 1 Northern Ireland Rental Index: Issue No. 8 Disclaimer This report
OFFICE MARKET ANALYSIS:
 OFFICE MARKET ANALYSIS: DAVID WEST RMLS Fellow Certificate of Real Estate Development Student Masters of Urban and Regional Planning Candidate While the Portland office market continues the slow recovery
Residential January 2010
 Residential January 2010 Karl L. Guntermann Fred E. Taylor Professor of Real Estate Adam Nowak Research Associate Another improvement to the ASU-RSI is introduced this month with new indices for foreclosure
Radian RATE Programme STAR Survey Results April 2017 to March 2018 All Residents Report April 2018
 Radian RATE Programme STAR Survey Results April 2017 to March 2018 All Residents Report April 2018 Executive summary This report summarises the results of the continuous STAR survey of Radian s residents,
Radian RATE Programme STAR Survey Results April 2017 to December 2017 All Residents Report February 2018
 Radian RATE Programme STAR Survey Results April 2017 to December 2017 All Residents Report February 2018 Executive summary This report summarises the results of the continuous STAR survey of Radian s residents,
2013 Arizona Housing Market Mid-Year Report
 2013 Arizona Housing Market Mid-Year Report This mid-year market report outlines the latest trends in Arizona real estate. The housing market hit bottom in mid to late 2011, and has been in recovery mode
Manhattan condo prices rose to
 Manhattan Market Report Q4 4 by the numbers +.8% StreetEasy Condo Price Index (QuarteroverQuarter) +.4% StreetEasy Condo Price Forecast (MonthoverMonth).7% Total (QuarteroverQuarter) +5.7% Number of Pending
REAL ESTATE MARKET OVERVIEW 1 st Half of 2015
 REAL ESTATE MARKET OVERVIEW 1 st Half of 2015 With Comparisons to the 2 nd Half of 2014 September 4, 2015 Prepared for: First Bank of Wyoming Prepared by: Ken Markert, AICP MMI Planning 2319 Davidson Ave.
MONTGOMERY COUNTY JANUARY 2019 MARKET IN A MINUTE A SUMMARY OF MARKET CONDITIONS FOR DECEMBER & 4TH QUARTER 2018
 STATPAK MONTGOMERY COUNTY JANUARY 2019 McEnearney.com MARKET IN A MINUTE A SUMMARY OF MARKET CONDITIONS FOR DECEMBER & 4TH QUARTER 2018 Contract activity in December 2018 was down 10.1% from December 2017
Estimating National Levels of Home Improvement and Repair Spending by Rental Property Owners
 Joint Center for Housing Studies Harvard University Estimating National Levels of Home Improvement and Repair Spending by Rental Property Owners Abbe Will October 2010 N10-2 2010 by Abbe Will. All rights
Las Vegas Valley Executive Summary
 ARROYO MARKET SQUARE Las Vegas Valley Executive Summary Retail Market 4th Quarter 2013 THE DISTRICT AT GREEN VALLEY RANCH January 23, 2014 Re: Commercial Real Estate Survey: 4th Quarter, 2013 Dear Reader,
MANHATTAN MARKET REPORT
 MANHATTAN MARKET REPORT Q1 MANHATTAN MARKET REPORT 1Q 2017 Manhattan s residential market is showing signs of improvement after a period of uncertainty leading up to the Presidential election, as it does
Housing Price Forecasts. Illinois and Chicago PMSA, January 2019
 Housing Price Forecasts Illinois and Chicago PMSA, January 2019 Presented To Illinois Realtors From R E A L Regional Economics Applications Laboratory, Institute of Government and Public Affairs University
Multifamily Market Commentary February 2018
 Multifamily Market Commentary February 2018 2018 Multifamily Affordable Market Outlook A Long Way to Go Momentum in the overall multifamily sector will likely slow in 2018 due to elevated levels of new
Residential December 2009
 Residential December 2009 Karl L. Guntermann Fred E. Taylor Professor of Real Estate Adam Nowak Research Associate Year End Review The dramatic decline in Phoenix house prices caused by an unprecedented
Housing Markets: Balancing Risks and Rewards
 Housing Markets: Balancing Risks and Rewards October 14, 2015 Hites Ahir and Prakash Loungani International Monetary Fund Presentation to the International Housing Association VIEWS EXPRESSED ARE THOSE
Construction Outlook: Major construction to further build on high base of activity
 SUNDAY 2 DECEMBER 2018 Construction Outlook: Major construction to further build on high base of activity Building on a high base, Australia s leading construction companies are projecting further expansion
The OeNB property market monitor of April 2015: Residential property price growth in Austria slowed down markedly in the second half of 2014
 The OeNB property market monitor of April : Residential property price growth in slowed down markedly in the second half of Martin Schneider, Karin Wagner, Walter Waschiczek Residential property price
New York City Market Update First Quarter sothebyshomes.com/nyc
 New York City Market Update First Quarter 217 MANHATTAN BROKERAGES Downtown 149 Fifth Avenue, 4 th Floor t: 212.431.244 East Side 38 East 61 st Street t: 212.66.766 West Side 2244 Broadway t: 212.579.93
Released: February 8, 2011
 Released: February 8, 2011 Commentary 2 The Numbers That Drive Real Estate 3 Recent Government Action 10 Topics for Home Buyers, Sellers, and Owners 13 Brought to you by: KW Research Commentary Gradual
PROPERTY BAROMETER FNB City of Cape Town House Price Indices
 19 July 2017 MARKET ANALYTICS AND SCENARIO FORECASTING UNIT JOHN LOOS: HOUSEHOLD AND PROPERTY SECTOR STRATEGIST 087-328 0151 john.loos@fnb.co.za LIZE ERASMUS STATISTICIAN 087-335 6664 lize.erasmus@@fnb.co.za
ON THE HAZARDS OF INFERRING HOUSING PRICE TRENDS USING MEAN/MEDIAN PRICES
 ON THE HAZARDS OF INFERRING HOUSING PRICE TRENDS USING MEAN/MEDIAN PRICES Chee W. Chow, Charles W. Lamden School of Accountancy, San Diego State University, 5500 Campanile Drive, San Diego, CA 92182, chow@mail.sdsu.edu
Economic and Market Outlook: SAN ANTONIO OFFICE Q1 2016
 Economic and Market Outlook: HOUSTON SAN ANTONIO AUSTIN Table 1. Key market indicators for Q1 2016, and their percent (%) change on a quarter-over-quarter (QoQ) and year-over-year (YoY) basis (Class A
Multifamily Market Commentary February 2017
 Multifamily Market Commentary February 2017 Affordable Multifamily Outlook Incremental Improvement Expected in 2017 We expect momentum in the overall multifamily sector to slow in 2017 due to elevated
The Impact of Market Rate Vacancy Increases Eight-Year Report
 The Impact of Market Rate Vacancy Increases Eight-Year Report January 1, 1999 - December 31, 2006 Santa Monica Rent Control Board March 2007 TABLE OF CONTENTS Summary 1 Units Rented at Market Rates Rates
Residential May Karl L. Guntermann Fred E. Taylor Professor of Real Estate. Adam Nowak Research Associate
 Residential May 2008 Karl L. Guntermann Fred E. Taylor Professor of Real Estate Adam Nowak Research Associate The use of repeat sales is the most reliable way to estimate price changes in the housing market
The Impact of Market Rate Vacancy Increases Eleven-Year Report
 The Impact of Market Rate Vacancy Increases Eleven-Year Report January 1, 1999 - December 31, 2009 Santa Monica Rent Control Board April 2010 TABLE OF CONTENTS Summary 1 Vacancy Decontrol s Effects on
MANHATTAN MARKET REPORT. 2nd Quarter 2017 RESALE
 MANHATTAN MARKET REPORT 2nd Quarter 2017 RESALE LETTER FROM THE PRESIDENT We are pleased to introduce the very first Berkshire Hathaway HomeServices New York Properties Manhattan Market Report, featuring
HOME Survey. Housing Opportunities and Market Experience. June National Association of REALTORS Research Group
 HOME Survey Housing Opportunities and Market Experience June 2018 National Association of REALTORS Research Group Introduction The Housing Opportunities and Market Experience (HOME) report was created
Residential March 2010
 Residential March 2010 Karl L. Guntermann Fred E. Taylor Professor of Real Estate Adam Nowak Research Associate The latest data for December 2009 reveals that overall house prices declined by 13 percent
Queens Rental Market Report November 2015 mns.com
 Queens Rental Market Report November 2015 TABLE OF CONTENTS 03 Introduction 04 A Quick Look 05 Mean Queens Rental Prices 10 Queens Price Trends 11 Neighborhood Price Trends 11 Long Island City 12 Astoria
THE REAL ESTATE BOARD OF NEW YORK REAL ESTATE BROKER CONFIDENCE INDEX THIRD QUARTER 2016
 THE REAL ESTATE BOARD OF NEW YORK REAL ESTATE BROKER CONFIDENCE INDEX THIRD QUARTER 2016 EXECUTIVE SUMMARY REAL ESTATE BROKER CONFIDENCE INDEX THIRD QUARTER 2016 The Real Estate Board of New York s (REBNY)
2016 Q3 PROPERTY MARKET REPORT
 2016 Q3 PROPERTY MARKET REPORT OVERVIEW After a tumultuous few months following the Brexit vote on 23 June, the UK economy seems to have rebounded and fallen into a more stable economic environment. Supply
Trends in Affordable Home Ownership in Calgary
 Trends in Affordable Home Ownership in Calgary 2006 July www.calgary.ca Call 3-1-1 PUBLISHING INFORMATION TITLE: AUTHOR: STATUS: TRENDS IN AFFORDABLE HOME OWNERSHIP CORPORATE ECONOMICS FINAL PRINTING DATE:
RESIDENTIAL MARKET ANALYSIS
 RESIDENTIAL MARKET ANALYSIS CLANCY TERRY RMLS Student Fellow Master of Real Estate Development Candidate Oregon and national housing markets both demonstrated shifting trends in the first quarter of 2015
YOUR LINK TO THE HOUSING MARKET
 H ousing now Gatineau YOUR LINK TO THE HOUSING MARKET www.cmhc.ca Very active third quarter for residential construction Canada Mortgage and Housing Corporation VOLUME 7, EDITION 3 Third Quarter 2 0 0
ECONOMIC AND MONETARY DEVELOPMENTS
 Box EURO AREA HOUSE PRICES AND THE RENT COMPONENT OF THE HICP In the euro area, as in many other economies, expenditures on buying a house or flat are not incorporated directly into consumer price indices,
1 Q M A NH AT TA N M A R K E T R E P O R T
 1Q2018 MANHATTAN M A R K E T R E P O R T INTRODUCTION M A N H A T T A N S A L E S R E P O R T Q 1 2 0 1 8 : THE NECESSITY OF BALANCE The first quarter of 2018 was a balancing act supported by declines
Manhattan Rental Market Report Year End 2012 mns.com
 Manhattan Rental Market Report Year End 2012 TABLE OF CONTENTS 03 Introduction 04 Notable Trends 06 Mean Manhattan Rental Prices 08 Neighborhood Price Trends 08 Battery Park City 08 Chelsea 08 East Village
Domain.com.au House Price Report December Quarter 2015
 Domain.com.au House Price Report December Quarter 2015 Dr Andrew Wilson Senior Economist for Domain.com.au Key findings Record drop in Sydney median house prices over the December quarter Melbourne and
Housing affordability in England and Wales: 2018
 Statistical bulletin Housing affordability in England and Wales: 2018 Brings together data on house prices and annual earnings to calculate affordability ratios for national and subnational geographies
Q M A N H A T T A N M A R K E T R E P O R T
 Q 4 2 0 1 7 M A N H A T T A N M A R K E T R E P O R T Introducing the Compass Q4 2017 Manhattan Market Report Page 02 Page 03 Page 05 Page 08 Page 10 Page 11 Coverage area Inventory Contracts signed Closings
2012 Profile of Home Buyers and Sellers New Jersey Report
 Prepared for: New Jersey Association of REALTORS Prepared by: Research Division December 2012 Table of Contents Introduction... 2 Highlights... 4 Conclusion... 7 Report Prepared by: Jessica Lautz 202-383-1155
Property Barometer Q2 2012
 Property Barometer Q2 2012 Measuring the Property Market Analysis by Annette Hughes, DKM Economic Consultants Contents 3 Introduction + Highlights 4 Market analysis 8 County by County Analysis: Market
MONTGOMERY COUNTY JULY 2018
 STATPAK MONTGOMERY COUNTY JULY 2018 McEnearney.com MARKET IN A MINUTE A SUMMARY OF MARKET CONDITIONS FOR JUNE & FIRST HALF 2018 Contract activity in June 2018 was up 1.2% from June 2017, solely because
Q New York City. Market Update. Web:
 Q3 2018 New York City Market Update Web: 00112551 All New York City Luxury Market 04 Market Overview 09 Luxury Market 05 Market Snapshot All Areas 06 Inventory Absorption Rate 07 Days on Market Listing
RESEARCH BRIEF TURKISH HOUSING MARKET: PRICE BUBBLE SEPTEMBER 2014 SUMMARY. A Cushman & Wakefield Research Publication OVERVIEW
 RESEARCH BRIEF TURKISH HOUSING MARKET: PRICE BUBBLE SEPTEMBER 2014 SUMMARY OVERVIEW Debates on the existence of a price bubble in the Turkish housing market have continued after numerous news releases
RENTAL MARKET REPORT. Manitoba Highlights* Highlight Box. Housing market intelligence you can count on
 H o u s i n g M a r k e t I n f o r m a t i o n RENTAL MARKET REPORT Manitoba Highlights* C a n a d a M o r t g a g e a n d H o u s i n g C o r p o r a t i o n Date Released: Spring 2011 Figure 1 Winnipeg
An Assessment of Recent Increases of House Prices in Austria through the Lens of Fundamentals
 An Assessment of Recent Increases of House Prices in Austria 1 Introduction Martin Schneider Oesterreichische Nationalbank The housing sector is one of the most important sectors of an economy. Since residential
The Manhattan real estate market
 Manhattan Market Report Q 04 by the numbers +.6% StreetEasy Condo Price Index (QuarteroverQuarter) 0.% StreetEasy Condo Price Forecast (MonthoverMonth) 6.0% Total (QuarteroverQuarter) 6.0% Number of Pending
THE MANHATTAN RENTAL MARKET REPORT
 TM THE MANHATTAN RENTAL MARKET REPORT JULY 2012 1 TABLE OF CONTENTS Introduction 3 A Quick Look 4 Mean Manhattan Rental Prices 8 Manhattan Price Trends 10 Neighborhood Price Trends Harlem 11 Upper West
L U X U R Y M A R K E T R E P O R T 2 Q
 L U X U R Y M A R K E T R E P O R T 2 Q 2 1 8 The quarterly Luxury Market Report provided by Trump International Realty is a resource compiling pertinent data and analytics to give you a pulse on the current
Addressing the Impact of Housing for Virginia s Economy
 Addressing the Impact of Housing for Virginia s Economy A REPORT FOR VIRGINIA S HOUSING POLICY ADVISORY COUNCIL NOVEMBER 2017 Appendix Report 2: Housing the Commonwealth's Future Workforce 2014-2024 Jeannette
PROPERTY BAROMETER FNB City of Cape Town House Price Indices
 16 February 2018 MARKET ANALYTICS AND SCENARIO FORECASTING UNIT JOHN LOOS: HOUSEHOLD AND PROPERTY SECTOR STRATEGIST 087-328 0151 john.loos@fnb.co.za THULANI LUVUNO STATISTICIAN 087-730 2254 thulani.luvuno@@fnb.co.za
Residential September 2010
 Residential September 2010 Karl L. Guntermann Fred E. Taylor Professor of Real Estate Adam Nowak Research Associate For the first time since March, house prices turned down slightly in August (-2 percent)
The Real Estate Market Report
 The Real Estate Report 3rd quarter 2011 Prepared by: Candace Adams, President, Prudential Connecticut Realty Terence Beaty, Director, New Homes & Land, Prudential Connecticut Realty Connecticut Segments
THE REAL ESTATE BOARD OF NEW YORK REAL ESTATE BROKER CONFIDENCE INDEX THIRD QUARTER 2014
 THE REAL ESTATE BOARD OF NEW YORK REAL ESTATE BROKER CONFIDENCE INDEX THIRD QUARTER 2014 EXECUTIVE SUMMARY REAL ESTATE BROKER CONFIDENCE INDEX THIRD QUARTER 2014 The Real Estate Board of New York s Real
Findings: City of Johannesburg
 Findings: City of Johannesburg What s inside High-level Market Overview Housing Performance Index Affordability and the Housing Gap Leveraging Equity Understanding Housing Markets in Johannesburg, South
Q Dubai Real Estate Market Overview
 Q2 2015 Dubai Real Estate Market Overview Dubai Market Summary Dubai s real estate market saw little change in the second quarter, with the slowdown in performance across all asset classes continuing,
What s Next for Commercial Real Estate Leveraging Technology and Local Analytics to Grow Your Commercial Real Estate Business
 What s Next for Commercial Real Estate Leveraging Technology and Local Analytics to Grow Your Commercial Real Estate Business - A PUBLICATION OF GROWTH MAPS- TABLE OF CONTENTS Intro 1 2 What Does Local
REAL ESTATE SENTIMENT INDEX 1 st Quarter 2016
 About Real Estate Sentiment Index (RESI) The Real Estate Sentiment Index (RESI) is jointly developed by the Real Estate Developers Association of Singapore (REDAS) and the Department of Real Estate (DRE),
ASSOCIATION OF RESIDENTIAL LETTING AGENTS PRIVATE RENTED SECTOR REPORT
 ASSOCIATION OF RESIDENTIAL LETTING AGENTS PRIVATE RENTED SECTOR REPORT August 2015 For further information: Association of Residential Letting Agents Press Office 020 7566 9777 propertyprofessionals@lansons.com
The Profile for Residential Building Approvals by Type and Geography
 The Profile for Residential Building Approvals by Type and Geography Key Points: ABS Building Approvals for Australia peaked back in October 2015. As we have frequently highlighted, approvals have subsequently
DATA FOR NOVEMBER Published December 20, Sales are down -9.3% month-overmonth. comparison is down -7.9%. ARMLS STAT NOVEMBER 2018
 Permission is granted only to ARMLS Subscribers for reproduction with attribution on to ARMLS COPYRIGHT 2018. For questions regarding this publication contact Brand@ARMLS.com. DATA FOR NOVEMBER 2018 -
Residential August 2009
 Residential August 2009 Karl L. Guntermann Fred E. Taylor Professor of Real Estate Adam Nowak Research Associate Summary The latest data for May 2009 reveals that house prices declined by 33 percent in
Sales Ratio: Alternative Calculation Methods
 For Discussion: Summary of proposals to amend State Board of Equalization sales ratio calculations June 3, 2010 One of the primary purposes of the sales ratio study is to measure how well assessors track
Housing market moving into a renewed up-cycle
 214 Housing market moving into a renewed up-cycle The growth in asking prices for property accelerated in the third quarter, up 3.1 per cent on the previous quarter, and 4.7 per cent on a year earlier
New policy for social housing rents
 New policy for social housing rents 1. Introduction The Essex Review of affordable housing policy carried out in 2008 pointed to the unfairness of the current system of rent setting for both social landlords