Industrial Market Report
|
|
|
- Juniper Woods
- 5 years ago
- Views:
Transcription


1 Industrial Market Report Greater Phoenix Q CONTACT NAI HORIZON N 44TH STREET, SUITE 200, PHOENIX, AZ


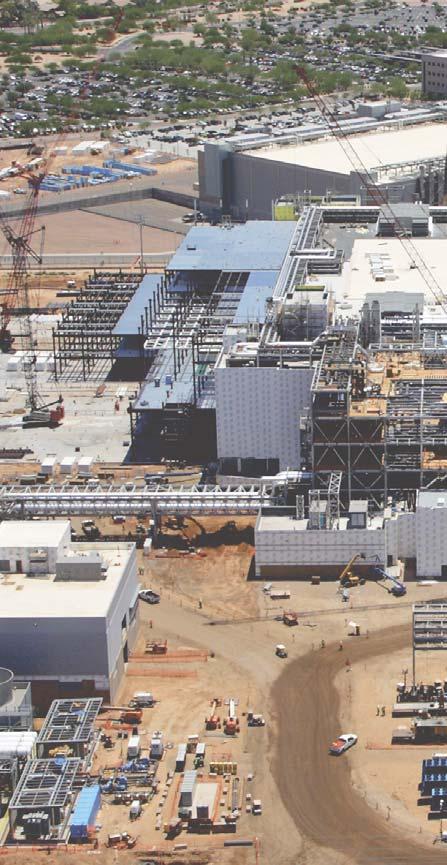
2 Building Momentum for a Positive 2013 The Phoenix Industrial Market transitioned into 2013 with positive indicators giving an outlook to a sustainable future. After two years of steady rebuilding of the market, not without its pitfalls, Q4 12 comes out solid with a strong positive net absorption, declining vacancy rates, and increased construction. With election year uncertainty behind us, the Phoenix CRE market has the chance to maintain this ground, brightening the mindset towards recovery from the lowest points of the recent recession. Metro Phoenix helped lead the way by adding the rapidly recovering housing market, it is only a matter of time for the positive momentum to impact the commercial market. While 2012 began with a negative net absorption, the market quickly recovered from this stumble, which turned out to be the only negative from the previous year, 2013 appears to continue the momentum of positive net absorption occurring during the last 2 years. Each of the In addition to the prolonged positive absorption run, vacancy continues its steady decline. With a similar vacancy rate not seen in the Phoenix industrial sector since midyear 2008, Q4 12 ended the year with a INDUSTRIAL SPECIALISTS with the lowest vacancy rate of 11.8%, while the Sky Harbor submarket showed the highest rate at 13.4%. Industrial building completions for Q4 12 added just over 2 million SF, more than doubling the delivered square footage for the previous three quarters of the year. The year-end total of 2,894,298 SF is an approximate 1.8 million SF increase of delivered space over One of the most notable of 2012; 3740 S Signal Butte Rd, a 1,328,075 SF facility that is now over 45% occupied. In addition to delivered space, future deliveries look positive with 15 industrial projects totaling 5,375,404 SF While these indicators show signs of the industrial market resurgence, areas for improvement remain. Rental rates held at $0.51 PSF for the third straight quarter. While overall more submarkets reversing their downward trend in rental rates, the Phoenix market still has hurdles to overcome until these rates return to pre-recession levels. While vacancy and absorption seem to show stamina, the rental rates remain stagnant. Adams Joe Cryan Industrial Senior Associate John Filli Richard Foss Vice President Hays joe.cryan@naihorizon.com rick.foss@naihorizon.com Page 2
 optimistic economic trends viewed in 2012 could begin to trickle down and show their effect on the CRE market.")


3 In addition to the prolonged positive absorption run, vacancy continues its steady decline. As economic conditions settle throughout 2013, Historical Industrial Rental Rate (nnn) optimistic economic trends viewed in 2012 could begin to trickle down and show their effect on the CRE market. The largest lease transaction recorded in Q4 12 was a 164,486 SF lease at 2550 N Nevada St in Chandler for the i/o Data Center. The largest sale transactions for the quarter were all a part of larger portfolio sales; W Buckeye was part of a $178 million, 13 state, 20 property Brennan Investment Group, while both 4201 N 45th Ave and 2555 N Nevada St were part of a $76 million, 3 property sale leaseback sold by the Hensley Beverage Company to Angelo, Gordon & Co., a privately-held registered investment advisor. Economic Outlook slightly improve economically and recover from halted business consumer spending is forecasted to inch upwards as things through While the impending economic Armageddon has been avoided for now and may brighten the short term outlook, the looming unknown may strike again as the March deadline for federal budget sequestrations approaches. The second continue to improve from the years of struggle that appear to be behind us. Rate $0.55 $0.50 $0.45 $0.40 4Q10 2Q11 4Q11 2Q12 4Q12 On a regional level, Arizona began 2012 with an unemployment rate of 8.7%, above the US rate of 8.3%. As of November, Arizona caught up with the US average and ended the year at 7.8%. This marks a four-year low for the state, which brought in 22,700 new jobs in November. Nationally, the US expects to see around 2 million jobs added in 2013, up slightly from the 1.84 million gained in While this increase shows sustainment, the pace of job creation will statistics to improve. Another positive throughout 2012 and continuing into the new year is Arizona s changing housing market. Phoenix area home prices are up 34% year-over-year with new home sales increasing by a staggering 85%. In addition to the growth, the plaguing effects of foreclosure seem to be improving. As continued on next page Chad Neppl Patrick Sheehan Isy Sonabend Mark Wilcke Tom Young Industrial Vice President, SIOR chad.neppl@naihorizon.com patrick.sheehan@naihorizon.com isy.sonabend@naihorizon.com mark.wilcke@naihorizon.com tom.young@naihorizon.com Page 3
4 Q4 12 Industrial Market Indicators Vacancy Net Absorption Construction Asking Rents FLAT of November, there were 34% less completed foreclosures year-over-year, and a 43% drop in overall supply of distressed properties. While still low in comparison to levels, residential permitting was up more than 60% in That trend is likely to continue into With construction and housing being the pulse of the Valley, the improving residential market provides a foundation for the commercial real estate toward a full recovery. Another factor that could help brighten the long term horizon for the Phoenix CRE market is the recent tax changes in California. A combination of increased income taxes, state sales taxes and multistate business taxes have created the perfect environment for businesses to further consider the Valley of the Sun as the next smart move. Arizona has spent the last few years making strong efforts to improve the business environment by lowering capital gains and corporate taxes, initiating business-friendly policies, and creating programs to support new or expanding businesses to excel in the Valley. GPEC (Greater Phoenix Economic Council) has created a California 100 program to bring interested CEOs to the city effort, combined with a market on the verge of full rebound, adds optimism to a year full of possibilities. Industrial Vacancy Rates Industrial Leasing Activity 18% # of Deals % % 12% % 500 8% 2Q11 4Q11 2Q12 4Q Q10 2Q11 4Q11 2Q12 4Q12 Economic Indicators Consumer Price Index Phoenix Metro Unemployment 30-Year Fixed Mortgage properties are analyzed. There were no stipulations on square footage, all sizes were included. Some information contained herein has been obtained from third party sources deemed reliable but has not been independently Page 4

5 2012 Q4 INDUSTRIAL MARKET BY THE NUMBERS Submarket Clusters Total RBA Direct Vacant SF Sublet Vacant SF Total Vacant SF Direct Vacant % Sublet Vacant % Total Vacant % Total Net Absorption RBA Delivered RBA Under Const. Average Rental Rate Sky Harbor Northeast Valley Northwest Valley Southeast Valley Southwest Valley Total Submarket Clusters 1 2 INDUSTRIAL SUBMARKETS Northwest Valley 1 2 Deer Valley/Pinnacle Peak, Glendale, Grand Avenue, N Glendale/Sun City Northeast Valley Central Phoenix, Scottsdale Airpark, Scottsdale/Salt River 3 Southwest Valley Goodyear, SW N of Buckeye Rd Sky Harbor North Airport, S Airport N of Roeser, S Airport S of Roeser, SC N of Salt River, SC S of Salt River Southeast Valley Chandler Airport, Chandler, Chandler N/ Gilbert, Falcon Field/Apache Junction, Mesa, Tempe E, Tempe NW, Tempe SW Page 5


6 Top Lease Transactions Q N Nevada St, Chandler Submarket: Chandler N/Gilbert Tenant: i/o Data Center Lease Type: Move-in Square Feet: 145,540 Bldg. Type: Manufacturing Buckeye Logistics Center 6825 W Buckeye Rd, Phoenix Submarket: Tolleson Tenant: Mor Furniture for Less Lease Type: Move-in Square Feet: 106,150 Bldg. Type: Distribution Papago Distribution Center 4802 W Polk St, Phoenix Submarket: SW N of Buckeye Tenant: Rugby Architectural Building Products Lease Type: Move-in Square Feet: 67,193 Bldg.Type: Distribution Top Sale Transactions Q N 45th Ave Phoenix, AZ Submarket: Grand Avenue Sale Date: Price: $47,000,000 Price PSF: $ Square Feet: 296,000 Bldg. Type: Distribution 2555 N Nevada St Chandler, AZ Submarket: Chandler N/Gilbert Sale Date: Price: $26,500,000 Price PSF: $ Square Feet: 231,167 Bldg Type: Distribution W Buckeye Rd Phoenix, AZ Submarket: Tolleson Sale Date: Price: $20,981,989 Price PSF: $ Square Feet: 171,332 Bldg. Type: Light Distribution REPORT PREPARED BY: Marissa Russo Marketing & Communications Manager GIS Specialist marissa.russo@naihorizon.com Andrew Starkman Marketing / Research andrew.starkman@naihorizon.com Connect with us online! NAI Horizon stays active on most social networking outlets including: Facebook, Twitter, LinkedIn, and our own blog. Like us, follow us, and subscribe to our RSS feed for continual updates on the CRE marketplace both locally and nationally and to stay up to date with our company into the future. Stephanie Van Dyken Marketing / Research stephanie.vandyken@naihorizon.com 2944 N 44th Street, Suite 200 Phoenix, AZ
Industrial Market Closes 2017 on an Upswing
 Research & Forecast Report GREATER PHOENIX INDUSTRIAL Industrial Market Closes on an Upswing Key Takeaways > > The Greater Phoenix industrial market finished off a year of robust tenant demand with a strong
Strong Absorption Drives Down Vacancy to Start 2017
 Research & Forecast Report GREATER PHOENIX INDUSTRIAL 2017 Strong Absorption Drives Down to Start 2017 Key Takeaways >> Industrial vacancy in Greater Phoenix dipped below 10 percent in the first quarter,
Vacancy Inches Higher, Despite Continued Absorption
 Research & Forecast Report GREATER PHOENIX OFFICE 1Q 2017 Vacancy Inches Higher, Despite Continued Absorption Key Takeaways > > Improving conditions in the Greater Phoenix office market took a pause in
Metro Phoenix Retail, Office & Industrial Recovery
 Metro Phoenix Retail, Office & Industrial Recovery By Gary Ringel, CGREA, Director (480) 483-1170 ~ GaryR@hhcpa.com Statistics Indicate Decreased Vacancy Rates, Increased Lease Rates & Positive Absorption
INDUSTRIAL QUICK STATS SUMMARY & OUTLOOK MARKET TRENDS VACANCY & NET ABSORPTION ECONOMIC STATS
 PHOENIX, ARIZONA INDUSTRIAL THIRD QUARTER 217 QUICK STATS Direct Vacancy 8.7% Overall Vacancy 9.% Lease Rate NNN $.54 Gross Absorption Under Construction MARKET TRENDS Current Quarter 5,991,128 SF 4,751,494
CoStar Industrial Statistics. T h i r d Q u a r t e r Phoenix Industrial Market
 CoStar Industrial Statistics T h i r d Q u a r t e r 2 0 1 7 Third Quarter 2017 Phoenix Table of Contents Table of Contents................................................................. A Methodology......................................................................
The CoStar Industrial Report. Y e a r - E n d Phoenix Industrial Market
 The CoStar Industrial Report Y e a r - E n d 2 0 1 5 Year-End 2015 Phoenix Table of Contents Table of Contents................................................................. A Methodology......................................................................
The CoStar Industrial Report. F i r s t Q u a r t e r Phoenix Industrial Market
 The CoStar Industrial Report F i r s t Q u a r t e r 2 0 1 6 First Quarter 2016 Phoenix Table of Contents Table of Contents................................................................. A Methodology......................................................................
CoStar Industrial Statistics. F i r s t Q u a r t e r Phoenix Industrial Market
 CoStar Industrial Statistics F i r s t Q u a r t e r 2 0 1 8 First Quarter 2018 Phoenix Table of Contents Table of Contents................................................................. A Methodology......................................................................
The CoStar Industrial Report. Y e a r - E n d Phoenix Industrial Market
 The CoStar Industrial Report Y e a r - E n d 2 0 1 4 Year-End 2014 Phoenix Table of Contents Table of Contents................................................................. A Methodology......................................................................
The CoStar Industrial Report
 The CoStar Industrial Report M I D - Y E A R 2 0 0 9 MID-YEAR 2009 PHOENIX Table of Contents Table of Contents.................................................................... A Methodology........................................................................
Market Research. Market Indicators
 colliers international LAS VEGAS, NV Market Research OFFICE Third Quarter 2009 Market Indicators Net Absorption Construction Rental Rate Q3-09 Q4-2009 Projected Clark County Economic Data Jul-09 Jul-08
Q PHOENIX INDUSTRIAL REPORT
 Q2 2018 PHOENIX INDUSTRIAL REPORT MARKET FUNDAMENTALS ANNUAL COMPARISON Q2 2018 Q2 2017 VACANCY 6.97% VACANCY 8.95% RENTAL RATES $0.59 RENTAL RATES $0.58 SF UNDER CONSTRUCTION 5.79 M SF UNDER CONSTRUCTION
Investment Activity Heating Up with Rents on the Rise
 Research & Forecast Report GREATER PHOENIX MULTIFAMILY 2 Investment Activity Heating Up with Rents on the Rise Key Takeaways > > The third quarter proved to be another period of healthy operating conditions
Residential August 2009
 Residential August 2009 Karl L. Guntermann Fred E. Taylor Professor of Real Estate Adam Nowak Research Associate Summary The latest data for May 2009 reveals that house prices declined by 33 percent in
An Analysis of Industrial Infill Development. Marty Busekrus, HFF Ed Harrington, CenterPoint Properties Cathy Thuringer, Trammell Crow
 An Analysis of Industrial Infill Development Marty Busekrus, HFF Ed Harrington, CenterPoint Properties Cathy Thuringer, Trammell Crow Marty Busekrus HFF Director with HFF focusing on the industrial capital
Rents Spike, Brightening the Second-Half Outlook
 Research & Forecast Report GREATER PHOENIX MULTIFAMILY Q2 217 Rents Spike, Brightening the Second-Half Outlook Key Takeaways > > The Greater Phoenix multifamily market recorded an active first half of
INDUSTRIAL QUICK STATS SUMMARY & OUTLOOK MARKET TRENDS VACANCY & NET ABSORPTION ECONOMIC STATS
 ORANGE COUNTY INDUSTRIAL FOURTH QUARTER 217 QUICK STATS Direct Vacancy 2.3% Overall Vacancy 2.7% Lease Rate NNN $.91 Gross Absorption Under Construction MARKET TRENDS Current Quarter 4,283,991 SF 963,138
OFFICE QUICK STATS SUMMARY & OUTLOOK MARKET TRENDS VACANCY & NET ABSORPTION ECONOMIC STATS
 VENTURA COUNTY OFFICE THIRD QUARTER 217 QUICK STATS Direct Vacancy 13.9% Overall Vacancy 14.3% Lease Rate FSG $2.25 Gross Absorption Under Construction MARKET TRENDS Current Quarter 34,43 SF 18,112 SF
With Vacancy Low, Rents Pushing Higher
 Research & Forecast Report GREATER PHOENIX MULTIFAMILY 3Q 2 With Low, Pushing Higher Key Takeaways > > The Greater Phoenix multifamily market strengthened somewhat during the third quarter, with vacancy
Rents and Sales Prices on the Rise to Start 2018
 Research & Forecast Report GREATER PHOENIX MULTIFAMILY 2 and Sales Prices on the Rise to Start 2 Key Takeaways > > The Greater Phoenix multifamily market got off to a hot start to 2. continues to retreat
OFFICE QUICK STATS SUMMARY & OUTLOOK MARKET TRENDS VACANCY & NET ABSORPTION ECONOMIC STATS
 LOS ANGELES CENTAL/SOUTHEAST OFFICE THIRD QUARTER 218 QUICK STATS Direct Vacancy 14.7% Overall Vacancy 15.2% Lease Rate FSG $3.16 Gross Absorption Under Construction MARKET TRENDS Change from Last Quarter
OFFICE QUICK STATS SUMMARY & OUTLOOK MARKET TRENDS VACANCY & NET ABSORPTION ECONOMIC STATS
 LOS ANGELES SAN GABRIEL VALLEY OFFICE SECOND QUARTER 218 QUICK STATS Direct Vacancy 11.1% Overall Vacancy 11.4% Lease Rate FSG $2.32 Gross Absorption Under Construction MARKET TRENDS Current Quarter 345,68
Monthly Market Snapshot
 SEPTEMBER 2018 Vacancy continues to fall. Nearing the end of the third quarter, the vacancy rate dropped 10 basis points to 6.4%, compared to this time last month at 6.5%. Occupancy of the 1.1 million
OFFICE QUICK STATS SUMMARY & OUTLOOK MARKET TRENDS VACANCY & NET ABSORPTION ECONOMIC STATS
 ORANGE COUNTY OFFICE THIRD QUARTER 217 QUICK STATS Direct Vacancy 12.1% Overall Vacancy 12.9% Lease Rate FSG $2.61 Gross Absorption Under Construction MARKET TRENDS Current Quarter 2,479,293 SF 379, SF
Market Report Q ///////// Orange County Industrial. ///////////////L o s A n g e l e s /////////////
 ///////////////L o s A n g e l e s ///////////// ///////////O r a n g e C o u n t y /////////// ////////////V e n t u r a ///////////////// ////////// I n l a n d E m p i r e //////////// Market Report
MARKET REPORT PHOENIX METRO OFFICE
 Q3 2018 MARKET REPORT PHOENIX METRO OFFICE Q3 Phoenix Office Market Overiew Key Takeaways * Compared To Last Quarter Total Vacancy 17.25% Q3 Net Absorption 999,900 SF Absorption/Vacancy 2008-2018 Average
OFFICE QUICK STATS SUMMARY & OUTLOOK MARKET TRENDS VACANCY & NET ABSORPTION ECONOMIC STATS
 INLAND EMPIRE OFFICE THIRD QUARTER 217 QUICK STATS Direct Vacancy 11.4% Overall Vacancy 11.7% Lease Rate FSG $1.83 Gross Absorption Under Construction MARKET TRENDS Current Quarter 529,634 SF 45,24 SF
Office Stays Positive
 Q2 2014 OFFICE LAS VEGAS NEVADA RESEARCH & FORECAST REPORT Office Stays Positive While it may not always be pretty, Southern Nevada s office market continues to improve. Net absorption increased in the
Office Market Continues to Improve
 Research & Forecast Report LAS VEGAS OFFICE Q3 2016 Office Market Continues to Improve > > Southern Nevada s office market is improving at a steady rate > > Net absorption has been positive in twelve of
Market Research. OFFICE First Quarter 2010
 colliers international LAS VEGAS, NV Market Research OFFICE First Quarter 2010 Market Indicators Net Absorption Construction Rental Rate Q1-10 Q2-2010 Projected Clark County Economic Data Jan-10 Jan-09
Soft Land Market in 2017
 Research & Forecast Report LAND Q4 217 Soft Land Market in 217 > > Land sales in 217 fell behind 216 > > A lack of large sales at Apex brought the average price per square foot up > > Strong development
Phoenix Real Estate Outlook. May 2015
 Phoenix Real Estate Outlook May 2015 General Economy 2 Arizona & US Nonfarm Employment YTY % Change 240,600 jobs lost 208,400 jobs gained (87%) Source: ADOA 3 Arizona Jobs Regained Since Bottom of Cycle
Residential May Karl L. Guntermann Fred E. Taylor Professor of Real Estate. Adam Nowak Research Associate
 Residential May 2008 Karl L. Guntermann Fred E. Taylor Professor of Real Estate Adam Nowak Research Associate The use of repeat sales is the most reliable way to estimate price changes in the housing market
Economic Overview DENVER INDUSTRIAL/FLEX MARKET MONITOR FIRST QUARTER Denver s industrial flex market vibrant during the first quarter.
 Economic Overview DENVER INDUSTRIAL/FLEX MARKET MONITOR FIRST QUARTER 2015 Denver s industrial flex market vibrant during the first quarter. The Denver industrial market has record high asking rental rates,
Market Research. Industrial Review. Industrial Third Quarter Market Indicators
 colliers international LAS VEGAS, NV Market Research Industrial Third Quarter 2009 Market Indicators Vacancy Net Absorption Construction Rental Rate Q3-09 Q4-2009 Projected Clark County Economic Data Jul-09
Residential December 2009
 Residential December 2009 Karl L. Guntermann Fred E. Taylor Professor of Real Estate Adam Nowak Research Associate Year End Review The dramatic decline in Phoenix house prices caused by an unprecedented
OFFICE QUICK STATS SUMMARY & OUTLOOK MARKET TRENDS VACANCY & NET ABSORPTION ECONOMIC STATS
 LOS ANGELES NORTH OFFICE FOURTH QUARTER 217 QUICK STATS Direct Vacancy 11.8% Overall Vacancy 12.5% Lease Rate FSG $2.75 Gross Absorption Under Construction MARKET TRENDS Current Quarter 1,6,941 SF 89,158
INDUSTRIAL QUICK STATS SUMMARY & OUTLOOK MARKET TRENDS VACANCY & NET ABSORPTION ECONOMIC STATS. Current Quarter. Direct Vacancy 2.
 ORANGE COUNTY INDUSTRIAL SECOND QUARTER 218 QUICK STATS Direct Vacancy 2.2% Overall Vacancy 2.5% Lease Rate NNN $.95 Gross Absorption Under Construction MARKET TRENDS Current Quarter 2,956,71 SF 1,367,18
RESEARCH & FORECAST REPORT
 Q2 2012 OFFICE LAS VEGAS NEVADA RESEARCH & FORECAST REPORT Recovery Without Job Growth? Despite office employment still trending downwards, Southern Nevada s office market posted positive net absorption
Residential September 2010
 Residential September 2010 Karl L. Guntermann Fred E. Taylor Professor of Real Estate Adam Nowak Research Associate For the first time since March, house prices turned down slightly in August (-2 percent)
The CoStar Office Report
 The CoStar Office Report T H I R D Q U A R T E R 2 0 1 2 THIRD QUARTER 2012 PHOENIX Table of Contents Table of Contents.................................................................... A Methodology........................................................................
MARKET WATCH SOUTHERN CALIFORNIA & PHOENIX
 SOUTHERN CALIFORNIA & PHOENIX COMMERCIAL REAL ESTATE MARKET FOURTH QUARTER 217 MARKET WATCH SOUTHERN CALIFORNIA & PHOENIX 1.888.659.DAUM WWW.DAUMCOMMERCIAL.COM D/AQ Corp. # 1129558 DAUM TABLE OF CONTENTS
2Q 17. Office Market Report
 2Q 17 Office Market Report Low vacancy rates and steady rental rates characterize the Portland office market Portland s office market has reached a level of strength not seen since the great recession.
For the Reno MSA employment has historically been based largely on construction and the leisure and hospitality industry. The construction industry
 For the Reno MSA employment has historically been based largely on construction and the leisure and hospitality industry. The construction industry has lost almost 15,000 construction jobs since 2006,
Market Research. Market Indicators
 colliers international LAS VEGAS, NV Market Research OFFICE Second Quarter 2009 Market Indicators Net Absorption Construction Rental Rate Q2-09 Q3-2009 Projected Clark County Economic Data UNEMPLOYMENT
Market Report Q ///////// Los Angeles Industrial. ///////////////L o s A n g e l e s /////////////
 ///////////////L o s A n g e l e s ///////////// ///////////O r a n g e C o u n t y /////////// ////////////V e n t u r a ///////////////// ////////// I n l a n d E m p i r e //////////// Market Report
INDUSTRIAL QUICK STATS SUMMARY & OUTLOOK MARKET TRENDS VACANCY & NET ABSORPTION ECONOMIC STATS
 VENTURA COUNTY INDUSTRIAL FOURTH QUARTER 217 QUICK STATS Direct Vacancy 2.1% Overall Vacancy 2.4% Lease Rate NNN $.7 Gross Absorption Under Construction MARKET TRENDS Current Quarter 1,332,957 SF 774,362
2013 Arizona Housing Market Mid-Year Report
 2013 Arizona Housing Market Mid-Year Report This mid-year market report outlines the latest trends in Arizona real estate. The housing market hit bottom in mid to late 2011, and has been in recovery mode
Time for Retail to Take Stock
 Q1 2013 RETAIL LAS VEGAS NEVADA RESEARCH & FORECAST REPORT Time for Retail to Take Stock It is heartening to say, after five years of a bad economy, that the first quarter of 2013 s 119,649 square feet
Market Report Q ///////// Los Angeles Industrial. ///////////////L o s A n g e l e s /////////////
 ///////////////L o s A n g e l e s ///////////// ///////////O r a n g e C o u n t y /////////// ////////////V e n t u r a ///////////////// ////////// I n l a n d E m p i r e //////////// Market Report
Residential January 2009
 Residential January 2009 Karl L. Guntermann Fred E. Taylor Professor of Real Estate Adam Nowak Research Associate Methodology The use of repeat sales is the most reliable way to estimate price changes
INDUSTRIAL QUICK STATS SUMMARY & OUTLOOK MARKET TRENDS VACANCY & NET ABSORPTION ECONOMIC STATS. Current Quarter. Direct Vacancy 2.
 LOS ANGELES NORTH INDUSTRIAL THIRD QUARTER 218 QUICK STATS Direct Vacancy 2.3% Overall Vacancy 2.6% Lease Rate NNN $1.1 Gross Absorption Under Construction MARKET TRENDS Current Quarter 1,632,564 SF 595,199
Residential October 2009
 Residential October 2009 Karl L. Guntermann Fred E. Taylor Professor of Real Estate Adam Nowak Research Associate Summary The latest data for July 2009 reveals that house prices declined by 28 percent
The CoStar Office Report
 The CoStar Office Report Y E A R - E N D 2 0 0 8 YEAR-END 2008 PHOENIX Table of Contents Table of Contents.................................................................... A Methodology........................................................................
INDUSTRIAL QUICK STATS SUMMARY & OUTLOOK MARKET TRENDS VACANCY & NET ABSORPTION ECONOMIC STATS
 INLAND EMPIRE INDUSTRIAL FOURTH QUARTER 217 QUICK STATS Direct Vacancy 5.1% Overall Vacancy 5.3% Lease Rate NNN $.57 Gross Absorption Under Construction MARKET TRENDS Current Quarter 9,23,744 SF 16,31,563
Residential March 2010
 Residential March 2010 Karl L. Guntermann Fred E. Taylor Professor of Real Estate Adam Nowak Research Associate The latest data for December 2009 reveals that overall house prices declined by 13 percent
Residential July 2010
 Residential July 2010 Karl L. Guntermann Fred E. Taylor Professor of Real Estate Adam Nowak Research Associate The Phoenix housing market overall continued to show gradual improvement through June but
Residential January 2010
 Residential January 2010 Karl L. Guntermann Fred E. Taylor Professor of Real Estate Adam Nowak Research Associate Another improvement to the ASU-RSI is introduced this month with new indices for foreclosure
Summary. Houston. Dallas. The Take Away
 Page Summary The Take Away The first quarter of 2017 was marked by continued optimism through multiple Texas metros as job growth remained positive and any negatives associated with declining oil prices
Las Vegas Valley Executive Summary
 ARROYO MARKET SQUARE Las Vegas Valley Executive Summary Retail Market 4th Quarter 2013 THE DISTRICT AT GREEN VALLEY RANCH January 23, 2014 Re: Commercial Real Estate Survey: 4th Quarter, 2013 Dear Reader,
Residential December 2010
 Residential December 2010 Karl L. Guntermann Fred E. Taylor Professor of Real Estate Adam Nowak Research Associate I The preliminary data for November shows that housing prices declined for another month
RESEARCH & FORECAST REPORT
 Q3 2012 OFFICE LAS VEGAS NEVADA RESEARCH & FORECAST REPORT Office Forges Ahead Southern Nevada s office market continued to post positive net absorption in the third quarter of 2012, despite weak employment
Q PHOENIX OFFICE REPORT
 Q2 2018 PHOENIX OFFICE REPORT MARKET FUNDAMENTALS ANNUAL COMPARISON Q2 2018 Q2 2017 VACANCY 16.47% VACANCY 16.93% RENTAL RATES $25.43 RENTAL RATES $24.76 SF UNDER CONSTRUCTION 2.76 M SF UNDER CONSTRUCTION
Second Quarter Industrial Market Report 2017
 Second Quarter Industrial Market Report 2017 03 04 04 04 05 06 08 09 10 11 13 Executive Summary National Economy Local Economy Oklahoma City Industrial Market Leasing Net Absorption and Inventory Rental
Homestretch: Office Market Set to Finish Strong
 Research & Forecast Report RENO OFFICE Q3 2016 Homestretch: Office Market Set to Finish Strong >> Vacancy drops significantly the largest drop quarter over quarter in 2016 >> Rental rates are not increasing
Washington DC Market Office Report
 Washington DC Market Office Report Market Overview The Office Market The Washington Office Market includes the District of Columbia and adjacent suburban submarkets in Maryland and Virginia. The Washington
INLAND EMPIRE REGIONAL INTELLIGENCE REPORT
 INLAND EMPIRE REGIONAL INTELLIGENCE REPORT June 2016 EMPLOYMENT After a slow start to 2016, the Inland Empire s labor market returned to form, in recent job figures. Seasonally adjusted nonfarm employment
FREESTANDING OLD TOWN SCOTTSDALE OFFICE BUILDING FOR SALE
 FREESTANDING OLD TOWN SCOTTSDALE OFFICE BUILDING FOR SALE 7447 E. EARLL DRIVE SCOTTSDALE, AZ 85251 GEOFF TURBOW 480.294.6019 gturbow@levrose.com ZAK KOTTLER 480.294.6003 zkottler@levrose.com JOE COSGROVE
VACANCY COMPLETIONS RENTAL RATE. *Projected $1.70. Vacancy Rate 14.9% 14.4% $1.60 $1.50 $1.40 $1.30 $1.20
 Research & Forecast Report RENO OFFICE Q4 A Good Year Overall > Building sale prices are significantly higher than. > Seven buildings over 40,000 sf sold in, more than in previous years. > Many large office
Phoenix, Central and Northern Arizona
 Phoenix, Central and Northern Arizona End of Year Housing Report 1-8-354-5664 LongRealty.com 217 End of Year Housing Report SALES & INVENTORY Housing market trends For the overall real estate market in
Second Quarter Retail Market Report 2017
 Second Quarter Retail Market Report 2017 03 04 04 04 04 05 06 07 08 10 Executive Summary National Economy Local Economy Oklahoma City Retail Market Leasing Net Absorption and Inventory Rental and Vacancy
Greater Phoenix Multifamily
 MARKET REPORT / Greater Phoenix Multifamily Apartment Rents Remain on an Upswing Highlights > > Conditions in the Phoenix multifamily market strengthened during the third quarter. Vacancy tightened and
Houston s industrial market continues to expand
 Research & Forecast Report HOUSTON INDUSTRIAL Q1 2017 Houston s industrial market continues to expand Lisa Bridges Director of Market Research Houston During the first quarter of 2017, 1.7M SF of Houston
Solid Fundamentals Keep Nashville Industrial Market Competitive in 1Q
 Research & Forecast Report NASHVILLE INDUSTRIAL 1st Quarter Solid Fundamentals Keep Nashville Industrial Market Competitive in 1Q 1Q Summary >> Nashville s industrial vacancy rate increased slightly in
Economic and Market Outlook: SAN ANTONIO OFFICE Q1 2016
 Economic and Market Outlook: HOUSTON SAN ANTONIO AUSTIN Table 1. Key market indicators for Q1 2016, and their percent (%) change on a quarter-over-quarter (QoQ) and year-over-year (YoY) basis (Class A
Medical Takes a Sick Quarter
 Research & Forecast Report LAS VEGAS MEDICAL OFFICE Q3 2015 Medical Takes a Sick Quarter > > After two quarters of growth, the medical real estate sector stalled in the third quarter of 2015 > > Asking
2Q 17. Long Island Market Report
 2Q 17 Long Island Market Report Long Island Office 2Q 217 Long Island 2Q17 Office Office Report The Long Island Office market ended the second quarter 217 with a vacancy rate of 7.2%. The vacancy rate
First Quarter Industrial Market Report 2017
 First Quarter Industrial Market Report 2017 03 04 04 04 05 06 08 09 10 11 13 Executive Summary National Economy Local Economy Oklahoma City Industrial Market Leasing Net Absorption and Inventory Rental
INDUSTRIAL MARKET ANALYSIS
 INDUSTRIAL MARKET ANALYSIS A. SYNKAI HARRISON Portland State University The National Real Estate Investor recently reported that 2014 saw the return speculative development in the industrial market in
Good Year, Poor Quarter
 Q4 2013 RETAIL LAS VEGAS NEVADA RESEARCH & FORECAST REPORT Good Year, Poor Quarter After nine quarters of positive net absorption, Southern Nevada s retail market fell into negative net absorption territory
Industrial Market Report
 Industrial Market Report West Michigan Q2 2018 Wisinski of West Michigan Office Industrial Retail Multi-Family GRAND RAPIDS The Market 1,058,079 Total Population 130+ International Companies $60,212 Average
MARKETBEAT INDUSTRIAL SNAPSHOT
 9.1 4.9 7.3 4.5 7. 1.3 8.1 1.3 1.7.3 msf MARKETBEAT INDUSTRIAL SNAPSHOT LAS VEGAS, NV A Cushman & Wakefield Alliance Research Publication Q1 215 ECONOMIC OVERVIEW The U.S. economy continued to add jobs
Industrial Market Report
 Industrial Market Report West Michigan Q4 - Year End 017 Wisinski of West Michigan Commercial Real Estate Services, Worldwide. 100 Grandville Ave SW Suite 100 Grand Rapids, MI 49503 616. 776. 0100 www.naiwwm.com
Suburban Boston Industrial MarketView
 Suburban Boston Industrial MarketView CBRE Global Research and Consulting U.S. UNEMPLOYMENT 7.6% MA UNEMPLOYMENT 7.0% OCCUPIED SF 122.5M AVAILABILITY 19.7% SUBLEASE SF 2.6M UNDER CONSTRUCTION 170K *Arrows
245 W. Lodge Drive Tempe, AZ 85283
 245 W. Lodge Drive Tempe, AZ 85283 Prepared For: Kevin Czerwinski Nicholaus Fischer Prepared By: Stein Koss, SIOR skoss@leearizona.com 602.912.3520 & Tom Louer, SIOR tlouer@leearizona.com 602.954.3779
2Q 16. Long Island Market Report
 2Q 16 Long Island Market Report Long Island Office 2Q 216 Long Island 2Q16 Office Office Report The Long Island Office market ended the second quarter 216 with a vacancy rate of 7.5%. The vacancy rate
Market Report Q ///////// Inland Empire Industrial. ///////////////L o s A n g e l e s /////////////
 ///////////////L o s A n g e l e s ///////////// ///////////O r a n g e C o u n t y /////////// ////////////V e n t u r a ///////////////// ////////// I n l a n d E m p i r e //////////// Market Report
The Office Market Feels The Heat in Q2
 Research & Forecast Report RENO OFFICE Q2 2017 The Office Market Feels The Heat in Q2 >>All major office submarkets have decreased vacancy and positive absorption this quarter >>The overall vacancy decreased
Chicago s industrial market thrives during the third quarter.
 CHICAGO INDUSTRIAL MARKET MONITOR THIRD QUARTER 2015 Chicago s industrial market thrives during the third quarter. Demand across the Chicago industrial market remains high sending absorption up and vacancy
Miami-Dade County Office Market Report 4Q Real Capital Partners Real Estate Services. *Data Source CoStar Miami-Dade County Office Market Report
 Miami-Dade County Office Market Report 4Q 216 Real Capital Partners Real Estate Services *Data Source CoStar Miami-Dade County Office Market Report 4Q 216 Miami-Dade County Office Market Report Overview
1Q 17. Long Island Market Report
 1Q 17 Long Island Market Report Long Island Office 1Q 217 Long Island 1Q17 Office Office Report The Long Island Office market ended the first quarter 217 with a vacancy rate of 7.1%. The vacancy rate was
Has The Office Market Reached A Peak? Vacancy. Rental Rate. Net Absorption. Construction. *Projected $3.65 $3.50 $3.35 $3.20 $3.05 $2.90 $2.
 Research & Forecast Report OAKLAND METROPOLITAN AREA OFFICE Q1 Has The Office Market Reached A Peak? > > Vacancy remained low at 5. > > Net Absorption was positive 8,399 in the first quarter > > Gross
Low Vacancy Stimulates New Developments
 Research & Forecast Report LAS VEGAS MULTIFAMILY Q3 2015 Low Vacancy Stimulates New Developments > > Multifamily vacancy dipped below 5 percent in the third quarter of 2015 ELECTRIC Meter Hookups NEW HOME
>> Orange County Market Gains Positive Momentum
 Research & Forecast Report ORANGE COUNTY OFFICE Accelerating success. >> Orange County Market Gains Positive Momentum Key Takeaways > The Orange County office market saw positive demand for third quarter
Office Market Analysis & Forecast Peoria, Arizona
 Office Market Analysis & Forecast Peoria, Arizona Prepared for: City of Peoria August 2015 Prepared by: Elliott D. Pollack & Company 7505 East 6 th Avenue, Suite 100 Scottsdale, Arizona 85251 Table of
Strong Industry and Robust Development Benefit Industrial Market at Mid-Year 2016
 Research & Forecast Report NASHVILLE INDUSTRIAL 2nd Quarter 2016 Strong Industry and Robust Development Benefit Industrial Market at Mid-Year 2016 2Q 2016 Summary > > The tightening market coupled with
3Q 17. Wichita Market Report
 3Q 17 Wichita Market Report Wichita Office 3Q 2017 Wichita 3Q17 Office Office Report The Wichita Office market ended the third quarter of 2017 with a vacancy rate of 19.6%. The vacancy rate was slightly
Federal Spending: The Road to Recovery
 MARKET REPORT NORTHERN VIRGINIA OFFICE First Quarter 2017 Federal Spending: The Road to Recovery As federal spending growth and the Northern Virginia economy generates new jobs, the office market continued
MARKETBEAT Columbus. Office Q1 2018
 COLUMBUS OFFICE Economic Indicators Q1 17 Q1 18 Unemployment 4.1% 3.8% Ohio Unemployment 5.1% 4.6% U.S. Unemployment 4.7% 4.1% Market Indicators (Overall, All Classes) Q1 17 Q1 18 Overall Vacancy 12.2%