Industrial Market Report
|
|
|
- Cassandra Lyons
- 5 years ago
- Views:
Transcription

1 Industrial Market Report West Michigan Q Wisinski of West Michigan Office Industrial Retail Multi-Family


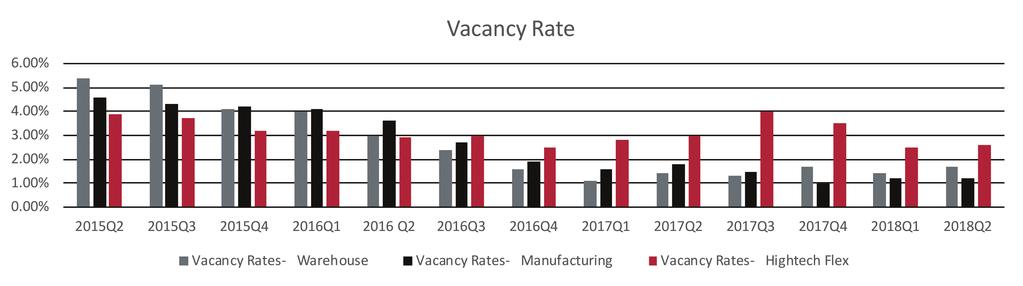
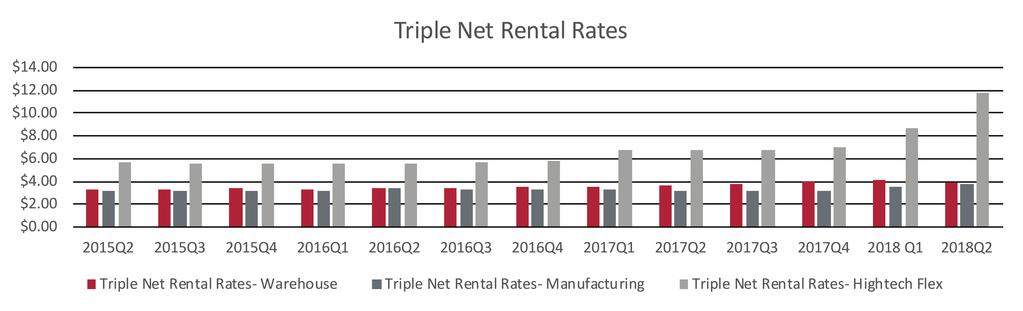
2 GRAND RAPIDS The Market 1,058,079 Total Population 130+ International Companies $60,212 Average Household Income 35.7 Median Age Industrial Market Trends It is hard to believe that over half of 2018 is already in the books and we are rapidly charging into the third quarter of the year. The first six months of 2018 saw continued and robust activity in the Industrial Real Estate Sector. Vacancies remain at an all-time low while construction and existing for sale product pricing was at an all-time high. More and more speculative product is beginning to find its way into the market with rents now being supportive of the new construction prices. Many of the new speculative construction buildings are experiencing immediate interest from tenants in the market and many of them are being built with signed leases already in place for a portion of the space. The vast majority of the speculative development has been on the southeast side of town, but there is some rumbling of potential new product hitting the market in other areas of West Michigan as well. The construction firms remain busy and lead times for new projects remain high. Planning is paramount in importance when looking forward at potential space acquisition. It is anticipated that the balance of 2018 will continue the trend we have seen over the first two quarters of this year. While interest rates are trending upwards, that does not seem to be dampening the appetite for industrial real estate in the West Michigan market. It remains to be seen what impact the tariff talk from Washington has on our market, but to date, demand continues to push the supply to uncomfortably low levels. Creative approaches to real estate solutions are ultimately what it is taking to meet clients real estate demands. This is where the creativity of the Broker, and their local market knowledge, is the difference maker in creating space solutions for today s users. 3.5% Unemployment Rate Stu Kingma, SIOR, Associate Broker/Industrial Grand Rapids-Wyoming, MI Metropolitan Statistical Data. Source: U.S. Census Bureau, The Right Place Cover Feature: Industrial Space For Lease 2710 Northridge Dr. NW


3 Industrial Sales & Leases Q SOLD 88 54th St. SW Buyer: Clyde Park Holdings 20,830 SF SOLD 3070 Shaffer Ave. SE 120,600 SF LEASED th St. SW Tenant: Camp Bow Wow 8,250 SF LEASED 5758 Vinton Ave. NW, Suite 2 Tenant: Weekes Forest Products 34,906 SF SOLD Lake Montcalm Rd. W 68,500 SF LEASED 2601 Elmridge Dr. NW Tenant: Ridgefield Company 42,786 SF Market Activity Ventra Ionia, a maker of auto parts, is planning to expand into a new building adjacent to their current location. This 48,000 square-foot expansion will allow for a new Ford Ranger bumper program to occupy the space. 109 jobs will be created, as well as, $4.85 million in capital investment. All-Phase Electric Supply Co and Axis Company are both leasing space at 1810 Turner Ave NW, in Grand Rapids. The new 70,160 SF industrial building will now be the main locations for both companies. Visser Development also plans to build another 135,000 SF building on the property soon. Amazon has recently announced their plan to open an 855,000 SF sortation and fulfillment center in Gaines Township. The $150 million investment will sit on 100 acres and provide over 1,000 full time jobs.
4 West Michigan Industrial Submarket Statistics 2018 Q2 Industrial Snapshot Submarket Total RBA Vacant Available SF Vacancy Rate *Disclaimer: Historical data figures are subject to change based upon the timing of when CoStar receives market information. NAIWWM uses the numbers available at the time each quarterly report is published. Total Average NNN Rate ($/SF/ Yr) Total Net Absorption (SF) Lakeshore Warehouse 11,055, , % $ ,440 Manufacturing 23,413, , % $ ,070 Hightech Flex 1,778, , % $5.50 4,430 Total 36,246, , % $ ,080 Northeast Warehouse 5,462,579 5, % $ Manufacturing 7,034,679 11, % $4.01 9,511 Hightech Flex 565, % $ Total 13,062,864 16, % $4.93 9,511 Northwest Warehouse 5,166, , % $ ,620 Manufacturing 12,600, , % $ ,513 Hightech Flex 1,215, % $ Total 18,982, , % $ ,133 Southeast Warehouse 22,777, , % $ ,096 Manufacturing 26,075, , % $4.29-9,552 Hightech Flex 3,038,832 37, % $ ,600 Total 51,891, , % $ ,944 Southwest Warehouse 9,186,611 64, % $ ,260 Manufacturing 21,903,802 69, % $ ,269 Hightech Flex 768, % $ Total 31,858, , % $ ,529 Total Overall 152,042,600 2,374, % $ ,037 Industrial Statistical Changes Year-over-Year and Quarter-over-Quarter 2Q17 vs. 2Q18 NET ABSORPTION VACANCY RATE CONSTRUCTION ASKING RATES 1Q18 vs. 2Q18 NET ABSORPTION VACANCY RATE CONSTRUCTION ASKING RATES
5 Industrial Overall Market Report C 2

6 Methodology Definitions Submarket Map Northwest Northeast Downtown Southwest Southeast Absorption (Net) The change in occupied space in a given time period. Available Square Footage Net rentable area considered available for lease; excludes sublease space. Average Asking Rental Rate Rental rate as quoted from each building s owner/management company. For office space, a full service rate was requested; for retail, a triple net rate requested; for industrial, a NN basis. Building Class Class A Product is office space of steel and concrete construction, built after 1980, quality tenants, excellent amenities & premium rates. Class B product is office space built after 1980, fair to good finishes & wide range of tenants. RBA Rentable Building Area - Mainly used for office and industrial. SF/PSF Square foot/per square foot, used as a unit of measurement. Under Construction Buildings in a state of construction, up until they receive their certificate of occupancy. In order for CoStar to consider a building under construction, the site must have a concrete foundation in place. Deliveries Buildings that have their certificate of occupancy and are allowed to be moved into by the tenant/ purchaser. Vacancy Rate All physically unoccupied lease space, either direct or sublease.


7 NAI Wisinski of West Michigan was formed in the spring of 2011 when NAI West Michigan merged with The Wisinski Group. This merger brought together two successful, reputable companies to form what is now the largest independently owned commercial real estate firm in West Michigan. Our focus is simple: building client relationships for life. We do this by utilizing the rich diversity of skills and specialties of our agents and staff, actively listening to our clients, offering market appropriate advice, providing access to the industry s most current and proven technologies, and delivering the best possible service to each and every client. NAI Wisinski of West Michigan is headquartered in Grand Rapids, MI and maintains a second location in Kalamazoo, MI. Our company provides all facets of commercial real estate services, including brokerage and property management, throughout the entire West Michigan region. Through our relationship with NAI Global, we have access to over 400 affiliate offices throughout the world. NAI Wisinski of West Michigan: Local Knowledge, Global Reach, Achieve More. By The Numbers Industrial Specialists Jim Badaluco, SIOR jimb@naiwwm.com Dane Davis daned@naiwwm.com Joshua Jacobs joshuaj@naiwwm.com Stu Kingma, SIOR skingma@naiwwm.com Kurt Kunst, CCIM, SIOR kurtk@naiwwm.com Chris Prins chrisp@naiwwm.com Kara Schroer karas@naiwwm.com Dave Smies, CCIM, SIOR daves@naiwwm.com Doug Taatjes, CCIM, SIOR dougt@naiwwm.com Cameron Timmer cameront@naiwwm.com Marc Tourangeau, MBA marct@naiwwm.com Jeremy Veenstra jeremyv@naiwwm.com Chadwick Versluis, SIOR chadv@naiwwm.com Stan Wisinski, CCIM, SIOR sjw@naiwwm.com Office Industrial Retail Multifamily Investment Property Management


8 facebook.com/naiwwm nai-wisinski-of-west-michigan Wisinski of West Michigan 100 Grandville Ave SW Suite 100 Grand Rapids, MI *Also serving the Kalamazoo & Southwest Michigan areas from our Kalamazoo office*
Industrial Market Report
 Industrial Market Report West Michigan Q4 - Year End 017 Wisinski of West Michigan Commercial Real Estate Services, Worldwide. 100 Grandville Ave SW Suite 100 Grand Rapids, MI 49503 616. 776. 0100 www.naiwwm.com
Retail Market Report. West Michigan Q4 - Year End Wisinski of West Michigan. Office Industrial Retail Multifamily Investment
 Retail Market Report West Michigan Q4 - Year End 2018 Wisinski of West Michigan Office Industrial Retail Multifamily Investment GRAND RAPIDS The Market 1,066,195 Total Population 130+ International Companies
Retail Market Report. West Michigan Q4 - Year End Wisinski of West Michigan. Office Industrial Retail Multi-Family
 Retail Market Report West Michigan Q4 - Year End 2017 Wisinski of West Michigan 100 Grandville Ave SW Suite 100 Grand Rapids, MI 49503 616.776.0100 www.naiwwm.com *Also serving the Kalamazoo & Southwest
Wisinski of West Michigan. Market Report. Greater Kalamazoo Q Office Industrial Retail Multi-Family
 Wisinski of West Michigan Market Report Greater Kalamazoo Q2-2017 Office Industrial Retail Multi-Family KALAMAZOO, MI The Market 262,866 Population $47,695 Median Household Income 35.1% Workforce with
4Q 16. Columbus Market Report. 605 S Front St Suite 200 Columbus OH
 4Q 16 Columbus Market Report 605 S Front St Suite 200 Columbus OH 43215 www.ohioequities.com 614 224 2400 Columbus Table of Contents 01 Office Market Report 02 Retail Market Report 03 Industrial Market
2Q 17. Columbus Market Report. 605 S Front St Suite 200 Columbus OH
 2Q 17 Columbus Market Report 605 S Front St Suite 200 Columbus OH 43215 www.ohioequities.com 614 224 2400 MARKET REPORT Columbus Table of Contents 01 Office Market Report 02 Retail Market Report 03 Industrial
3Q 17. Columbus Market Report. 605 S Front St Suite 200 Columbus OH
 3Q 17 Columbus Market Report 605 S Front St Suite 200 Columbus OH 43215 www.ohioequities.com 614 224 2400 Columbus Table of Contents 01 Office Market Report 02 Retail Market Report 03 Industrial Market
First Quarter Industrial Market Report 2017
 First Quarter Industrial Market Report 2017 03 04 04 04 05 06 08 09 10 11 13 Executive Summary National Economy Local Economy Oklahoma City Industrial Market Leasing Net Absorption and Inventory Rental
Year End 17. Office Market Report
 Year End 17 Office Market Report INDIANAPOLIS, INDIANA The Market Our Year End Market Report shows continued velocity in the office market. However, there has been a significant decline in net absorption
Upstate, SC 2Q17. Industrial Market Report. Q2 Industrial. Upstate Economy in 2Q17* Industrial Sector in 2Q17. Trends for 2Q17
 Upstate, SC 2Q17 Industrial Market Report The industrial market for the Upstate of South Carolina saw continued growth for the second quarter of 217. While there was a positive net absorption of 67,53
Upstate, SC 1Q16. Industrial Market Report. Industrial. Upstate Economy in 1Q16* Industrial Sector in 1Q16. Trends for 1Q16
 Market Report The industrial market for the Upstate of South Carolina saw continued growth for the first quarter of 2016. While there was a positive net absorption of 1,024,708/SF, the Upstate industrial
2Q 16. Long Island Market Report
 2Q 16 Long Island Market Report Long Island Office 2Q 216 Long Island 2Q16 Office Office Report The Long Island Office market ended the second quarter 216 with a vacancy rate of 7.5%. The vacancy rate
Tenant: Address: Size (SF): Submarket: NYK Logistics (Americas), Inc Victor Hill Road 100,000 Spartanburg
: Submarket: NYK Logistics (Americas), Inc Victor Hill Road 100,000 Spartanburg") NAI Earle MEMBER Furman, NAME LLC Industrial Office Report Report First Second Quarter Quarter 2007 2009 Upstate Market TRENDS: STATISTICS: Vacancy Rate Net Absorption Construction Number of Buildings...3,910
NAI Earle MEMBER Furman, NAME LLC Industrial Office Report Report First Second Quarter Quarter 2007 2009 Upstate Market TRENDS: STATISTICS: Vacancy Rate Net Absorption Construction Number of Buildings...3,910
Bakersfield 4Q18 Office Market Trends
 Bakersfield the higher cost of leasing in the submarket is unlikely to hinder demand as CRC s lease expirations create more available inventory within the University Centre Submarket. Mark J. Smith, SIOR
2Q 17. Long Island Market Report
 2Q 17 Long Island Market Report Long Island Office 2Q 217 Long Island 2Q17 Office Office Report The Long Island Office market ended the second quarter 217 with a vacancy rate of 7.2%. The vacancy rate
1Q17: 418,421 SF -128,634 SF in 4Q16. $3.52 $3.43 in 4Q % Down from 7.5% in 4Q16. $4.05 $3.90 in 4Q16. Columbia Industrial Market Report
 1Q17: Columbia Industrial Market Report VACANCY 8.1% 3,919,507 SF of vacant industrial space NET ABSORPTION 418,421 SF -128,634 SF in 4Q16 AVERAGE RENTAL RATE $3.43 in 4Q16 VACANCY: CLASS A 0.4% Down from
Strong Absorption Drives Down Vacancy to Start 2017
 Research & Forecast Report GREATER PHOENIX INDUSTRIAL 2017 Strong Absorption Drives Down to Start 2017 Key Takeaways >> Industrial vacancy in Greater Phoenix dipped below 10 percent in the first quarter,
Houston s industrial market continues to expand
 Research & Forecast Report HOUSTON INDUSTRIAL Q1 2017 Houston s industrial market continues to expand Lisa Bridges Director of Market Research Houston During the first quarter of 2017, 1.7M SF of Houston
3 RD QUARTER 2015 RICHMOND INDUSTRIAL MARKET REPORT
 3 RD QUARTER FORECAST As the U.S. economy continued to show positive economic growth through the third quarter, the Richmond, VA Industrial market saw demand for warehouse and flex properties increase
MARKET WATCH SOUTHERN CALIFORNIA & PHOENIX
 SOUTHERN CALIFORNIA & PHOENIX COMMERCIAL REAL ESTATE MARKET FOURTH QUARTER 217 MARKET WATCH SOUTHERN CALIFORNIA & PHOENIX 1.888.659.DAUM WWW.DAUMCOMMERCIAL.COM D/AQ Corp. # 1129558 DAUM TABLE OF CONTENTS
HOUSTON INDUSTRIAL MARKET
 REAL ESTATE OUTLOOK HOUSTON INDUSTRIAL MARKET FIRST QUARTER 217 Industrial Sector Continues Push Forward Flex Market Softening under Pressure from Office Market Availability OV E R V I E W Industrial gains
Second Quarter Industrial Market Report 2017
 Second Quarter Industrial Market Report 2017 03 04 04 04 05 06 08 09 10 11 13 Executive Summary National Economy Local Economy Oklahoma City Industrial Market Leasing Net Absorption and Inventory Rental
Madison Market Recap 2017 Q3
 Madison Market Recap 2017 Q3 INDUSTRIAL OFFICE RETAIL NAI MLG COMMERCIAL 608 663 6000 4602 S BILTMORE LANE, SUITE 117, MADISON, WI 53718 MLGCOMMERCIAL.COM M A D I S O N, W I Market Recap 2017 Q3 Office
Strong Industry and Robust Development Benefit Industrial Market at Mid-Year 2016
 Research & Forecast Report NASHVILLE INDUSTRIAL 2nd Quarter 2016 Strong Industry and Robust Development Benefit Industrial Market at Mid-Year 2016 2Q 2016 Summary > > The tightening market coupled with
Monthly Market Snapshot
 SEPTEMBER 2018 Vacancy continues to fall. Nearing the end of the third quarter, the vacancy rate dropped 10 basis points to 6.4%, compared to this time last month at 6.5%. Occupancy of the 1.1 million
2Q 17. Office Market Report
 2Q 17 Office Market Report Low vacancy rates and steady rental rates characterize the Portland office market Portland s office market has reached a level of strength not seen since the great recession.
CHICAGO CBD OFFICE INVESTMENT PROPERTIES GROUP
 CHICAGO CBD OFFICE INVESTMENT PROPERTIES GROUP SECOND QUARTER NEWSLETTER 216 HOT TOPICS Capital markets remain a focus with 14 assets either under contract or sold totaling $2.6 billion, which includes
1Q 17. Long Island Market Report
 1Q 17 Long Island Market Report Long Island Office 1Q 217 Long Island 1Q17 Office Office Report The Long Island Office market ended the first quarter 217 with a vacancy rate of 7.1%. The vacancy rate was
NAI FMA Realty Market Report First Half 2009 Lincoln, Nebraska
 Lincoln, Nebraska First Half 2009 Office TRENDS Vacancy Rate Asking Rents OFFICE OVERVIEW As the national economy continued to contract during the first six months of the 2009, Lincoln followed the trend.
RETAIL MARKET ANALYSIS
 RETAIL MARKET ANALYSIS Portland State University Despite the doom and gloom warnings of a retail apocalypse, the national story for retail is that things are stable. Nationwide vacancy is at 5.2 percent
INDUSTRIAL MARKET REPORT. San Antonio. 4th Quarter Q4 Market Trends 2016 by Xceligent, Inc. All Rights Reserved
 INDUSTRIAL MARKET REPORT San Antonio 4th Quarter 2015 Table of Contents/ Methodology of Tracked Set Xceligent is a leading provider of verified commercial real estate information which assists real estate
3 RD QUARTER 2016 RICHMOND INDUSTRIAL MARKET REPORT
 3 RD QUARTER 2016 RICHMOND INDUSTRIAL MARKET REPORT FORECAST The Richmond Industrial market continued trending in the positive direction in the third quarter, with the absorption of over 320,000 square
First Half 2018 Market Report
 Market Report Individual Members of: NAI FMA Realty OVERALL MARKET Direct Vacancy Absorption Asking Rent Overall Market Historical Vacancy 12.0% 10.0% 8.0% 6.0% 4.0% 2.0% 0.0% 11.1% 5.6% 2.4% 10.5% 5.0%
Second Quarter Retail Market Report 2017
 Second Quarter Retail Market Report 2017 03 04 04 04 04 05 06 07 08 10 Executive Summary National Economy Local Economy Oklahoma City Retail Market Leasing Net Absorption and Inventory Rental and Vacancy
Miami-Dade County Retail Market Report 3Q Real Capital Partners Real Estate Services. *Data Source CoStar Miami-Dade County Retail Market Report
 Miami-Dade County Retail Market Report 3Q 216 Real Capital Partners Real Estate Services *Data Source CoStar Miami-Dade County Retail Market Report 3Q 216 Miami-Dade County Retail Market Report Overview
INDUSTRIAL QUICK STATS SUMMARY & OUTLOOK MARKET TRENDS VACANCY & NET ABSORPTION ECONOMIC STATS
 PHOENIX, ARIZONA INDUSTRIAL THIRD QUARTER 217 QUICK STATS Direct Vacancy 8.7% Overall Vacancy 9.% Lease Rate NNN $.54 Gross Absorption Under Construction MARKET TRENDS Current Quarter 5,991,128 SF 4,751,494
Indianapolis MARKETBEAT. Office Q Economy. Market Overview INDIANAPOLIS OFFICE
 INDIANAPOLIS OFFICE Economic Indicators Market Indicators (Direct, All Classes) Direct Net Absorption/Direct Asking Rent 4-QTR TRAILING AVERAGE Direct Vacancy Q3 17 Q3 18 MSA Employment 1.05M 1.07M MSA
Mid Year 15. Office Market Report
 Mid Year 15 Office Market Report INDIANAPOLIS, INDIANA The Market With the year half over, it is time to recap the commercial office market. We continue to see a transition underway of fewer employees
Office Market Continues to Improve
 Research & Forecast Report LAS VEGAS OFFICE Q3 2016 Office Market Continues to Improve > > Southern Nevada s office market is improving at a steady rate > > Net absorption has been positive in twelve of
Miami-Dade County Office Market Report 4Q Real Capital Partners Real Estate Services. *Data Source CoStar Miami-Dade County Office Market Report
 Miami-Dade County Office Market Report 4Q 216 Real Capital Partners Real Estate Services *Data Source CoStar Miami-Dade County Office Market Report 4Q 216 Miami-Dade County Office Market Report Overview
CoStar Office Statistics. Y e a r - E n d Denver Office Market
 CoStar Office Statistics Y e a r - E n d 2 0 1 6 Year-End 2016 Denver Table of Contents Table of Contents................................................................. A Methodology......................................................................
Boulder, CO 2nd Quarter 2015 INDUSTRIAL. Market Trends COMMERCIAL REAL ESTATE INFORMATION
 Boulder, CO 2nd Quarter 2015 INDUSTRIAL Market Trends COMMERCIAL REAL ESTATE INFORMATION Table of Contents/Methodology of Tracked Set Table of Contents/Methodology of Tracked Set 2 Boulder Industrial Market
Metropolitan Milwaukee Office Market Report Third Quarter 2015
 Metropolitan Milwaukee Office Market Report Third Quarter 2015 RETAIL OFFICE INDUSTRIAL LAND INVESTMENT NAI MLG COMMERCIAL 414 347 9400 757 N BROADWAY, SUITE 700, MILWAUKEE, WI 53202 MLGCOMMERCIAL.COM
CoStar Office Statistics. M i d - Y e a r Denver Office Market
 CoStar Office Statistics M i d - Y e a r 2 0 1 7 Mid-Year 2017 Denver Table of Contents Table of Contents................................................................. A Methodology......................................................................
CoStar Office Statistics. Y e a r - E n d Portland Office Market
 CoStar Office Statistics Y e a r - E n d 2 0 1 7 Year-End 2017 Portland Table of Contents Table of Contents................................................................. A Methodology......................................................................
Picked Over. ALBUQUERQUE, NM Q Industrial. Research & Forecast Report. Key Takeaways. Market Indicators Relative to prior period
 Research & Forecast Report ALBUQUERQUE, NM Q4 20 Industrial Picked Over Key Takeaways > > Owner user acquisitions strong > > Supply tightens > > New construction projects gaining more momentum The appetite
Miami-Dade County Retail Market Report 4Q Real Capital Partners Real Estate Services. *Data Source CoStar Miami-Dade County Retail Market Report
 Miami-Dade County Retail Market Report 4Q 216 Real Capital Partners Real Estate Services *Data Source CoStar 4Q 216 Miami-Dade County s Vacancy Decreases to 4.% Net Absorption Positive 1,155,8 SF in the
First Half 2017 Market Report
 First Half Market Report Individual Members of: Wells Fargo Center 1248 O Street, Suite 550 Lincoln, NE 68508 402 441 5800 naifmarealty.com NAI FMA Realty First Half Tom Ball Chairman Scott Vyskocil Senior
101 E Washington Street, Ste 400 Greenville, SC Q 18. Market Report
 101 E Washington Street, Ste 400 Greenville, SC 29601 2Q 18 Market Report GREENVILLE/SPARTANBURG 2Q18 OFFICE REPORT * MARKET SUMMARY The Greenville Spartanburg Office market remained fairly steady at the
Industrial Market Report
 Industrial Market Report Greater Phoenix Q4 2012 CONTACT NAI HORIZON 602.955.4000 2944 N 44TH STREET, SUITE 200, PHOENIX, AZ 85018 WWW.NAIHORIZON.COM Building Momentum for a Positive 2013 The Phoenix Industrial
Office Stays Positive
 Q2 2014 OFFICE LAS VEGAS NEVADA RESEARCH & FORECAST REPORT Office Stays Positive While it may not always be pretty, Southern Nevada s office market continues to improve. Net absorption increased in the
2.8% 2.0% $811M. 2017: A Solid Year for the Metro Denver Office Sector HIGHLIGHTED METRO DENVER OFFICE. Market Report Q ECONOMIC TRENDS
 Market Report METRO DENVER OFFICE Q4 2017 2017: A Solid Year for the Metro Denver Office Sector MARKET OVERVIEW Denver s office market finished 2017 with strong positive absorption during the fourth quarter
Metro Milwaukee Industrial Market Review 2018 Q3
 Metro Milwaukee Industrial Market Review RETAIL OFFICE INDUSTRIAL LAND INVESTMENT NAI MLG COMMERCIAL 414 347 9400 757 N BROADWAY, SUITE 700, MILWAUKEE, WI 53202 MLGCOMMERCIAL.COM Metro Milwaukee Industrial
Las Vegas Valley Executive Summary
 ARROYO MARKET SQUARE Las Vegas Valley Executive Summary Retail Market 4th Quarter 2013 THE DISTRICT AT GREEN VALLEY RANCH January 23, 2014 Re: Commercial Real Estate Survey: 4th Quarter, 2013 Dear Reader,
No Where To Grow. ALBUQUERQUE, NM Q Retail. Research & Forecast Report. Key Takeaways. Market Indicators Relative to prior period
 Research & Forecast Report ALBUQUERQUE, NM Q2 20 Retail No Where To Grow Key Takeaways > > Supply of anchor spaces becoming scarce > > Renovations help to alleviate lack of new projects > > New projects
+48.6 million sf office inventory
 Research Market Report METROPOLITAN MILWAUKEE OFFICE 2018 Quarter 1 Research Wisconsin Introduction Following a strong second half of 2017, 2018 had a slow start. Despite an increase in vacancy and negative
The CoStar Industrial Report
 The CoStar Industrial Report M I D - Y E A R 2 0 1 0 Houston Industrial Market Houston Industrial Market MID-YEAR 2010 HOUSTON Table of Contents Table of Contents....................................................................
Industrial Market Closes 2017 on an Upswing
 Research & Forecast Report GREATER PHOENIX INDUSTRIAL Industrial Market Closes on an Upswing Key Takeaways > > The Greater Phoenix industrial market finished off a year of robust tenant demand with a strong
Sarasota-Manatee, FL 3rd Quarter 2015 INDUSTRIAL. Market Trends COMMERCIAL REAL ESTATE INFORMATION
 Sarasota-Manatee, FL 3rd Quarter 2015 INDUSTRIAL Market Trends COMMERCIAL REAL ESTATE INFORMATION Table of Contents/Methodology of Tracked Set Table of Contents/Methodology of Tracked Set Sarasota-Manatee
2017 FORT WAYNE, INDIANA OFFICE MARKET SURVEY
 2017 FORT WAYNE, INDIANA OFFICE MARKET SURVEY 2017 REVIEW 2018 FORECAST PREPARED WITH THE ASSISTANCE OF Overall, the market conditions have stabilized. The most significant development for the Fort Wayne
NAI FMA Realty Market Report Second Half 2011 Lincoln, Nebraska
 Lincoln, Nebraska Construction Sites of Future Pinnacle Bank Arena (back left) and Courtyard Marriott (right) Second Half Individual Members of: 402.441.5800 www.naifmarealty.com Office OFFICE OVERVIEW
The CoStar Office Report
 The CoStar Office Report Y E A R - E N D 2 0 0 8 YEAR-END 2008 PHOENIX Table of Contents Table of Contents.................................................................... A Methodology........................................................................
INDUSTRIAL MARKET ANALYSIS
 INDUSTRIAL MARKET ANALYSIS A. SYNKAI HARRISON Portland State University The National Real Estate Investor recently reported that 2014 saw the return speculative development in the industrial market in
MAR KET GLANCE SAN DIEGO OFFICE MARKET REPORT PROPERTY SERVICES DEVELOPMENT INVESTMENT FOURTH QUARTER 2015 PROPERTY SERVICES DEVELOPMENT INVESTMENT
 AT A SAN DIEGO OFFICE MARKET REPORT FOURTH QUARTER 215 AT A NEW SUPPLY PUSHES VACANCY RATES HIGHER San Diego s regional economy has been buzzing and added a net total of 37,8 jobs in the 12 months ending
CoStar Industrial Statistics. Y e a r - E n d McAllen/Edinburg/Pharr Industrial Market
 CoStar Industrial Statistics Y e a r - E n d 2 0 1 7 McAllen/Edinburg/Pharr Industrial Market Year-End 2017 McAllen/Edinburg/Pharr Table of Contents Table of Contents.................................................................
MARKET SUMMARY MICHIGAN, METRO DETROIT AREA FOURTH QUARTER 2016 P LAN T E M OR AN CRES A. pmcresa.com
 FOURTH QUARTER 2016 MICHIGAN, METRO DETROIT AREA MARKET SUMMARY P LAN T E M OR AN CRES A 26300 NORTHWESTERN HIGHWAY SOUTHFIELD, MI 48076 248.223.3500 pmcresa.com Connect with us for more information: Subscribe
Homestretch: Office Market Set to Finish Strong
 Research & Forecast Report RENO OFFICE Q3 2016 Homestretch: Office Market Set to Finish Strong >> Vacancy drops significantly the largest drop quarter over quarter in 2016 >> Rental rates are not increasing
Vacancy Rates Hit All-Time Low in Northern Nevada
 Research & Forecast Report RENO INDUSTRIAL Q3 2018 Vacancy Rates Hit All-Time Low in Northern Nevada > > Vacancy is at an all-time low for the market at 4.86% > > A strong quarter for gross and net absorption
The CoStar Office Report
 The CoStar Office Report T H I R D Q U A R T E R 2 0 1 2 THIRD QUARTER 2012 PHOENIX Table of Contents Table of Contents.................................................................... A Methodology........................................................................
3Q 17. Wichita Market Report
 3Q 17 Wichita Market Report Wichita Office 3Q 2017 Wichita 3Q17 Office Office Report The Wichita Office market ended the third quarter of 2017 with a vacancy rate of 19.6%. The vacancy rate was slightly
First Quarter Multi-Family Market Report 2018
 First Quarter Multi-Family Market Report 2018 03 04 04 05 05 06 07 07 08 10 Executive Summary National Economy Local Economy OKC Multi-Family Market Leasing by Class and Unit Mix OKC Multi-Family Market
Oklahoma City Retail Market Leasing. OKC Retail Market Information by Submarket. Construction, Delivery, Net Absorption and Vacancy Rate
 03 04 04 04 05 05 07 07 08 09 11 Executive Summary National Economy Local Economy Oklahoma City Retail Market Leasing Net Absorption and Inventory Rental and Vacancy Rates OKC Retail Market Information
Fourth Quarter Multi-Family Market Report 2017
 Fourth Quarter Multi-Family Market Report 2017 03 04 04 05 05 06 07 07 08 10 Executive Summary National Economy Local Economy OKC Multi-Family Market Leasing by Class and Unit Mix OKC Multi-Family Market
Offering memorandum. El Cajon
 Offering memorandum El Cajon 1083 N o r t h C u y a m a c a s t r e e t 1083 north Cuyamaca street el Cajon, CA 92020 Offering Memorandum I. Executive summary The Overview & Valuation Summary...1 II. The
Softening demand and new supply lifts vacancy
 Q1 2009 Q2 2009 Q3 2009 Q4 2009 Q1 2010 Q2 2010 Q3 2010 Q4 2010 Q2 2011 Q3 2011 Q4 2011 Q2 2012 Q3 2012 Q4 2012 Q2 2013 Q3 2013 Q4 2013 Q2 2014 Q3 2014 Q4 2014 Q1 2015 Calgary Office, Q1 2015 Softening
The CoStar Office Report. T h i r d Q u a r t e r Greensboro/Winston-Salem Office Market
 The CoStar Office Report T h i r d Q u a r t e r 2 0 1 4 Greensboro/Winston-Salem Office Market Third Quarter 2014 Greensboro/Winston-Salem Table of Contents Table of Contents.................................................................
Vacancy Inches Higher, Despite Continued Absorption
 Research & Forecast Report GREATER PHOENIX OFFICE 1Q 2017 Vacancy Inches Higher, Despite Continued Absorption Key Takeaways > > Improving conditions in the Greater Phoenix office market took a pause in
MARKET WATCH. Market Highlights
 MARKET WATCH Market Highlights Office Total Inventory 363,526,845 SF Total Vacancy Rate 13.40% Average Rate $25.11 PSF YTD Net Absorption 405,481 SF Industrial Total Inventory 812,881,868 SF Total Vacancy
LEHIGH VALLEY COMMERCIAL REAL ESTATE REPORT OFFICE & INDUSTRIAL MARKETS
 www.lehighvalley.org LEHIGH VALLEY COMMERCIAL REAL ESTATE REPORT OFFICE & INDUSTRIAL MARKETS ISSUE #015 Q3 2018 One of the core principles of the Economic Development Corporation (LVEDC) is to serve as
Southeast Florida. Commercial Markets: Q Independent Valuations for a Variable World Q
 www. October 2016 In This Issue Current Statistics Retail Office Industrial Multifamily Cap Rates Commercial Sales Home Sale/Price Trends Building Permit Data SEFL Market Participant Survey Summary Data
The CoStar Office Report
 The CoStar Office Report Y E A R - E N D 2 0 0 9 YEAR-END 2009 SALT LAKE CITY Table of Contents Table of Contents.................................................................... A Methodology........................................................................
CoStar Office Statistics. M i d - Y e a r Portland Office Market
 CoStar Office Statistics M i d - Y e a r 2 0 1 7 Mid-Year 2017 Portland Table of Contents Table of Contents................................................................. A Methodology......................................................................
The Office Market Feels The Heat in Q2
 Research & Forecast Report RENO OFFICE Q2 2017 The Office Market Feels The Heat in Q2 >>All major office submarkets have decreased vacancy and positive absorption this quarter >>The overall vacancy decreased
CoStar Industrial Statistics. Y e a r - E n d Brownsville/Harlingen Industrial Market
 CoStar Industrial Statistics Y e a r - E n d 2 0 1 7 Brownsville/Harlingen Industrial Market Brownsville/Harlingen Industrial Market Year-End 2017 Brownsville/Harlingen Table of Contents Table of Contents.................................................................
COLUMBUS 2018 Q4 MARKET TRENDS. 605 S Front St Suite 200 Columbus OH
 2018 Q4 MARKET TRENDS 605 S Front St Suite 200 Columbus OH 43215 www.ohioequities.com 614 224 2400 OFFICE OVERVIEW Vacancy Rate 7.0 % + Positive Absorption Rental Rate Increased 4 Buildings Delivered Totaling
100% OCCUPIED - 2 TENANT INDUSTRIAL INVESTMENT. Sun MCLEOD BUSINESS CENTER E. Post Road, Las Vegas, Nevada Commercial Real Estate, Inc.
 0% OCCUPIED - TENANT INDUSTRIAL INVESTMENT Sun Commercial Real Estate, Inc. MCLEOD BUSINESS CENTER 70 E. Post Road, Las Vegas, Nevada 890 Contact Team Lisa Hauger Senior Vice President 70-968-7333 LisaH@suncommercialre.com
Boston starts the year slowly, but has plenty in store
 Boston Downtown Office, Q1 2017 Boston starts the year slowly, but has plenty in store Vacancy 8.6% Availability 13.9% Quarterly Absorption (67,890) SF Sublease 1.3% Under Construction 1.8 MSF Figure 1:
Solid Fundamentals Keep Nashville Industrial Market Competitive in 1Q
 Research & Forecast Report NASHVILLE INDUSTRIAL 1st Quarter Solid Fundamentals Keep Nashville Industrial Market Competitive in 1Q 1Q Summary >> Nashville s industrial vacancy rate increased slightly in
The Market Is Energized By Increased Development In Hollywood
 OFFICE CENTRAL LOS ANGELES MARKET REPORT The Market Is Energized By Increased Development In Hollywood MARKET OVERVIEW MARKET INDICATORS - VACANCY 20.5% NET ABSORPTION 24,100 CONSTRUCTION 574,000 RENTAL
San Antonio 4th Quarter 2014 INDUSTRIAL. Market Trends COMMERCIAL REAL ESTATE INFORMATION
 San Antonio 4th Quarter 2014 INDUSTRIAL Market Trends COMMERCIAL REAL ESTATE INFORMATION Table of Contents/Methodology of Tracked Set Table of Contents/Methodology of Tracked Set 2 San Antonio Market Map
Boulder, CO 2nd Quarter 2015 OFFICE. Market Trends COMMERCIAL REAL ESTATE INFORMATION
 Boulder, CO 2nd Quarter 2015 OFFICE Market Trends COMMERCIAL REAL ESTATE INFORMATION Table of Contents/Methodology of Tracked Set Table of Contents/Methodology of Tracked Set 2 Boulder Office Market Map
MARKET WATCH. Market Highlights
 MARKET WATCH Market Highlights Office Total Inventory 362,968,225 SF Total Vacancy Rate 14.10% Average Rate $24.32 PSF YTD Net Absorption 2,081,326 SF Industrial Total Inventory 804,891,880 SF Total Vacancy
Quick Absorption of Newly Constructed Office Buildings
 Research & Forecast Report CHARLESTON, SC OFFICE Q3 2016 Quick Absorption of Newly Constructed Office Buildings Bryana Mistretta Research Coordinator South Carolina Key Takeaways >> The Interstate 526
INDUSTRIAL QUICK STATS SUMMARY & OUTLOOK MARKET TRENDS VACANCY & NET ABSORPTION ECONOMIC STATS
 ORANGE COUNTY INDUSTRIAL FOURTH QUARTER 217 QUICK STATS Direct Vacancy 2.3% Overall Vacancy 2.7% Lease Rate NNN $.91 Gross Absorption Under Construction MARKET TRENDS Current Quarter 4,283,991 SF 963,138
Minneapolis-St. Paul
 INDUSTRIAL MARKET REPORT Minneapolis-St. Paul 4th Quarter 2015 Produced in partnership with Table of Contents/ Methodology of Tracked Set Xceligent is a leading provider of verified commercial real estate
Nashville the #5 Market to Watch in 2019
 Research & Forecast Report NASHVILLE INDUSTRIAL 4 th Quarter Nashville the #5 Market to Watch in 2019 Industrial Market The industrial real estate sector is currently undergoing one of the greatest expansionary
VACANCY COMPLETIONS RENTAL RATE. *Projected $1.70. Vacancy Rate 14.9% 14.4% $1.60 $1.50 $1.40 $1.30 $1.20
 Research & Forecast Report RENO OFFICE Q4 A Good Year Overall > Building sale prices are significantly higher than. > Seven buildings over 40,000 sf sold in, more than in previous years. > Many large office
Houston Summer Retail. Office. July 2016 Commercial Markets. Independent Valuations for a Variable World Page 1. Summary Q1 Statistics
 July 2016 Commercial Markets In This Issue Commercial Markets Retail Office Industrial Multifamily Housing Trends Single Family Housing Lot Supply & New Home Data % 10% 8% 6% 4% 2% 0% Retail 2007 Q1 2008
Metro Milwaukee Industrial Market Report 2017 Q2
 RETAIL OFFICE INDUSTRIAL LAND INVESTMENT NAI MLG COMMERCIAL 414 347 9400 757 N BROADWAY, SUITE 700, MILWAUKEE, WI 53202 MLGCOMMERCIAL.COM Market intelligence is an essential component to NAI MLG Commercial
Houston s industrial leasing activity decreases 42.7% over the quarter - vacancy rate remains under 5.0%
 Research & Forecast Report HOUSTON INDUSTRIAL Q3 2015 Houston s industrial leasing activity decreases 42.7% over the quarter - vacancy rate remains under 5.0% Lisa Bridges Director of Market Research Houston