Delmarva Outlook 2015
|
|
|
- Marion Jordan
- 5 years ago
- Views:
Transcription
 742-3201")
1 Delmarva Outlook 2015 Presented by: William McCain W.R. McCain & Associates, Inc. Real Estate Valuation & Consultation 205 Executive Plaza Salisbury, MD (410)
2 W. R. McCain & Associates, Inc. 27 Years in Business 21 Person Staff with an average of 12 years of appraisal experience Over 10,000 Commercial Assignments Over 45,000 Residential Assignments Valued over $13 Billion of Real Estate 2


3 Unemployment Rate (Average during the year) 12 Percentage Unemployment Rate is simply the number of unemployed people divided by the number of people in the labor force; based upon household data. The unemployed people have to be looking for a job to be counted as being in the labor force. If they stopped looking for a job then they are counted as being out of the labor force and not unemployed. 3 Source: Bureau of Labor Statistics website (data seasonally adjusted)

 In")
4 Jobs (8 million lost 10 million gained) In thousands 4

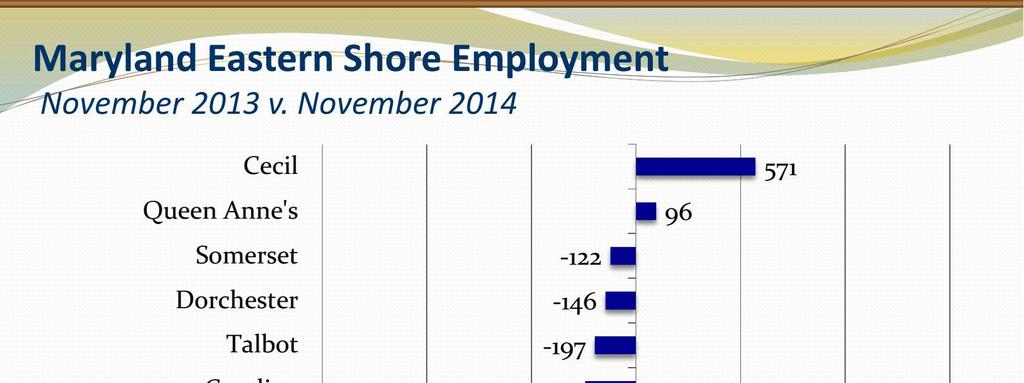
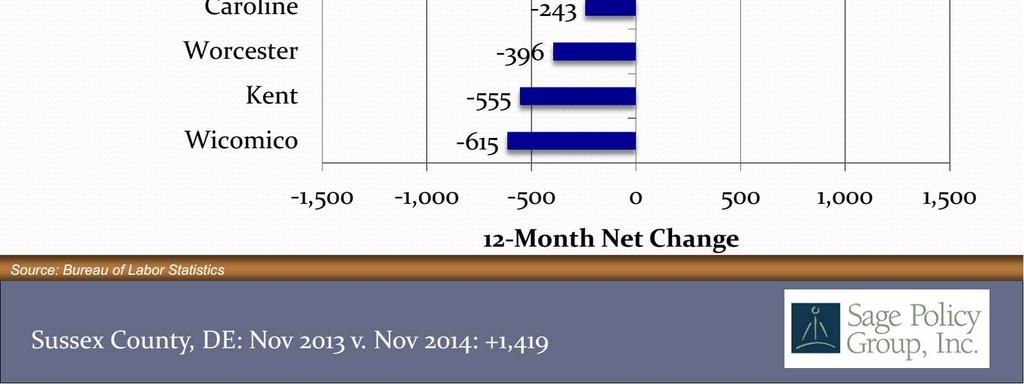
5 Source: DE Department of Labor, Bureau of Labor Statistics, MD Department of Labor, SWED 5
6 6
7 7


8 Homebuilder Confidence (NAHB Market Index) 8


9 Single Family Housing Starts Thousand units ½ the Normal 9


10 Annual Home Sales 10

11 New Home Sales Share 11

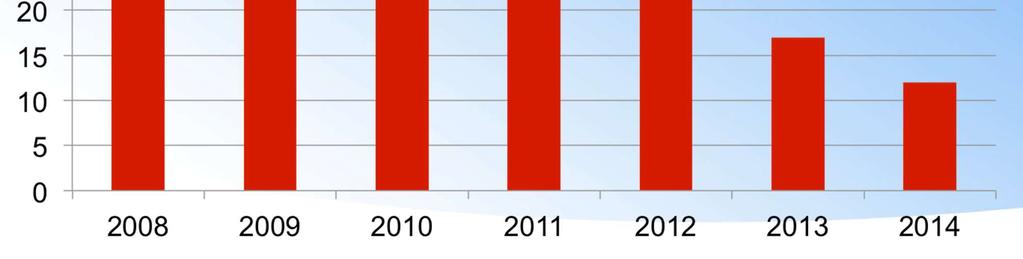
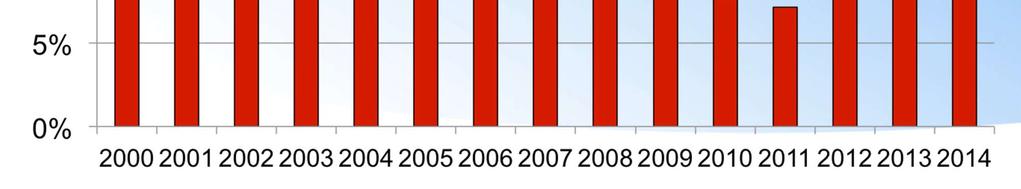
12 Distressed Property Sales 12


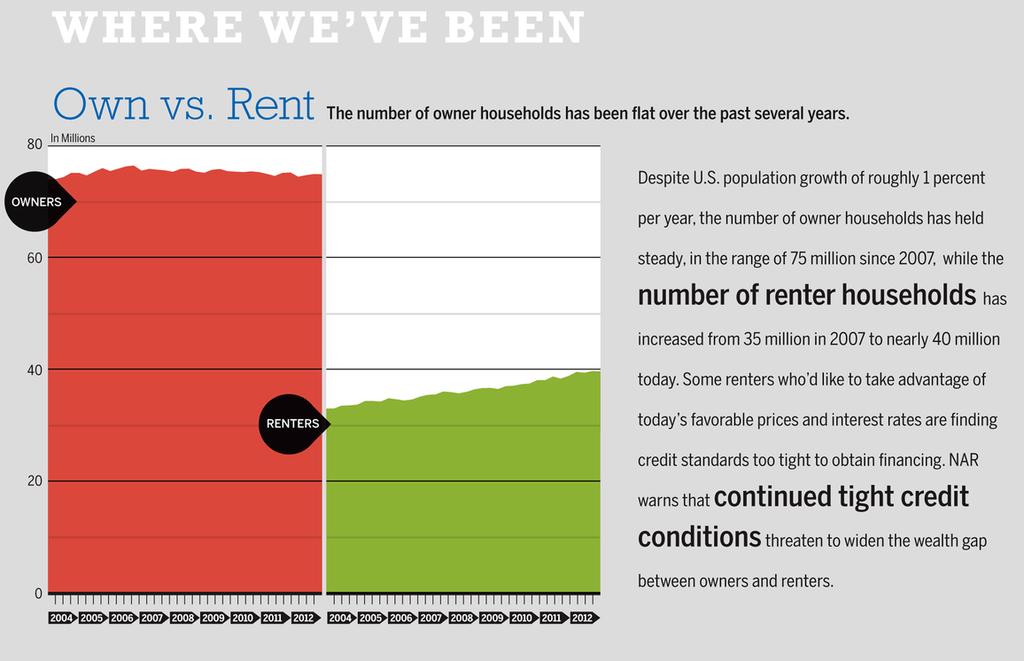
13 Renter Households over 10 years (Increased by 8 million) In thousands 13
 In thousands")
14 Homeowner Households over 10 years (Decreased by 2 million) In thousands 14


15 Inventory of Homes for Sale 15


16 Median Price reflects the middle price of all homes sold during a period. In normal times where types of homes do no change measurably from on period to the next, then the median price can be a good gauge about home price appreciation or depreciation. However, the median price can also be a reflection not about price change appreciation but about the type of homes being sold. If, for example, mostly distressed properties are being sold then the median will be low. If mostly high-end homes are being sold, then the median will be high. Supply and Demand dynamics impact both new and existing home prices. But new home prices are also to a greater degree impacted by changes in the cost of construction, such as commodity prices and labor costs. 16 Source: FRED website
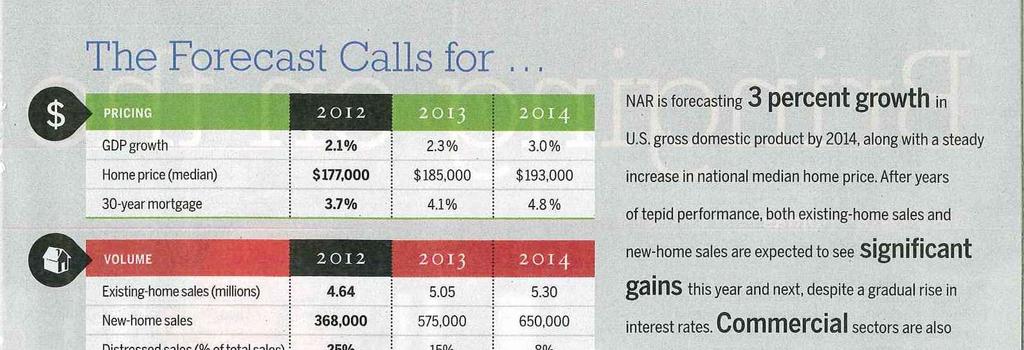
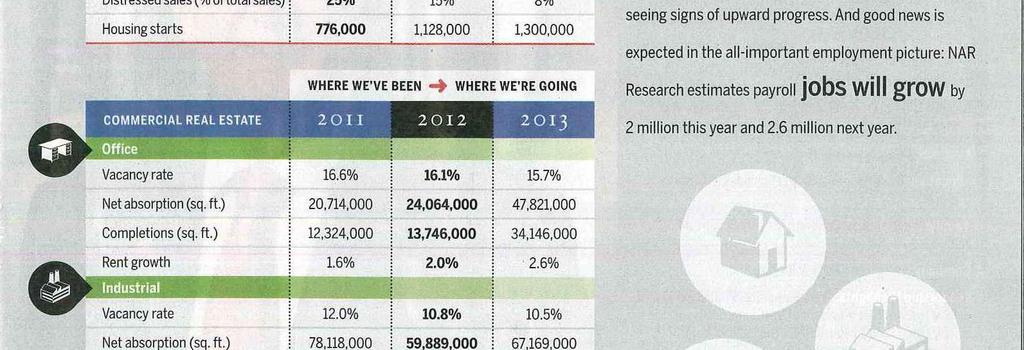
17 Economic Forecast Likely 2015 Forecast 2016 Forecast GDP Growth 2.2% 2.5% 2.7% 2.9% Job Growth +2.3 million +2.5 million +2.5 million +2.6 million CPI Inflation 1.5% 1.6% 2.7% 3.3% Consumer Confidence 10-year Treasury % 2.6% 3.2% 4.3% 17


18 Housing Forecast Forecast 2016 Forecast Housing Starts 925, million 1.16 million 1.4 million New Home Sales Existing Home Sales Median Price Growth 430, , , , million 4.9 million 5.6 million 5.4 million % + 5.3% + 3.9% + 4% 30-year Rate 4.0% 4.0% 4.9% 6.0% Underwriting Standards Strict Strict Transition Normal 18


19 30-year Mortgage Rates 19

20 U.S. House Price Performance By State September 2013 to September 2014 Source: Freddie Mac website 20


21 Lower Shore Housing Average Sale Price Somerset Years Source: MD Association of Realtors


22 Lower Shore Housing Average Sale Price Wicomico Years Source: MD Association of Realtors


23 Lower Shore Housing Average Sale Price Worcester Years Source: MD Association of Realtors 23
24 Lower Shore Housing Average Sale Price Somerset Wicomico Worcester % change % change % change YE , , ,823 YE , % 184, % 340, % YE , % 191, % 398, % YE , % 216, % 422, % YE , % 220, % 407, % YE , % 208, % 374, % YE , % 188, % 335, % YE , % 161, % 300, % YE , % 146, % 276, % YE , % 152, % 266, % YE , % 156, % 264, % YE , % 147, % 248, % Source: MD Association of Realtors 24


25 Lower Shore Housing Average Sale Price Sussex County Years Source: Del MLS


26 Lower Shore Housing Average Sale Price Kent County Years: Source: Trend MLS
27 Lower Shore Housing Average Sale Price Sussex Kent Price % Change Price % Change YE , ,833 YE , % 213, % YE , % 240, % YE , % 239, % YE , % 224, % YE , % 207, % YE , % 196, % YE , % 178, % YE , % 179, % YE , % 187, % YE , % 193, % Source: DE MLS and Trend MLS 27
28 $350,000 Lower Shore Housing Average Sale Price Northampton $325,000 $300,000 $275,000 $250,000 $225,000 $200,000 $175,000 $150, Years Source: Navica system
29 $300,000 Lower Shore Housing Average Sale Price Accomack $250,000 $200,000 $150,000 $100, Years: Source: Navica system 29
30 Mid/Upper Shore Housing Average Sale Price Dorchester Kent Queen Anne's Talbot Caroline % change % change % change % change % change YE , % 380, % 453, % 584, % 258, % YE , % 362, % 489, % 665, % 232, % YE , % 395, % 436, % 634, % 216, % YE , % 287, % 353, % 576, % 205, % YE , % 262, % 349, % 534, % 172, % YE , % 284, % 330, % 448, % 143, % YE , % 304, % 372, % 507, % 166, % YE , % 298, % 379, % 484, % 154, % YE , % 296, % 366, % 442, % 148, % Source: MD Association of Realtors 30
31 Lower Shore Housing Unit Sales Somerset Single Family, Condos & Town homes Yearly Comparison Source: MD Association of Realtors
32 Lower Shore Housing Unit Sales Wicomico Single Family, Condos & Town homes 1,150 1,100 1,050 1, Yearly Comparison Source: MD Association of Realtors
33 Lower Shore Housing Unit Sales Worcester Single Family, Condos & Town homes 2,400 2,300 2,200 2,100 2,000 1,900 1,800 1,700 1,600 1,500 1,400 1,300 1,200 1,100 1, Yearly Comparison Source: MD Association of Realtors 33
34 Lower Shore Housing Unit Sales Sussex Single Family, Condo & Town Homes 5,000 4,500 4,000 3,500 3,000 2,500 2,000 1, Yearly Comparison Source: DE MLS 34
35 2,750 Lower Shore Housing Unit Sales Kent Single Family, Condos & Town homes 2,500 2,250 2,000 1,750 1,500 1,250 1, Yearly Comparison Source: Trend MLS 35
36 Eastern Shore of VA Housing Unit Sales Yearly Comparison Source: Navica MLS
37 Mid/Upper Shore Housing Unit Sales Dorchester Kent Caroline Queen Anne's Talbot Source: Maryland Association of Realtors


38 Lower Shore Active Listings Somerset New & existing Single Family homes, Condos, Town homes Active listing data is as of December 31 st of each year 38 Source: Flex MLS


39 Lower Shore Active Listings Wicomico New & existing Single Family homes, Condos, Town homes Active listing data is as of December 31 st of each year 39 Source: Flex MLS


40 Lower Shore Active Listings Worcester New & existing Single Family homes, Condos, Town homes Active listing data is as of December 31 st of each year 40 Source: Flex MLS


41 Sussex County Active Listings New & existing Single Family homes, Condos, Townhomes Note: 3,945; as of 12/5/2012 3,389; as of 12/31/2012 3,329; as of 4/24/2013 4,111; as of 8/12/2013 3,520; 12/30/2013 3,343; 08/07/2014 3,877; 12/22/2014 3,436; as of 3/2/15: 3, Source: Sussex County MLS


42 Kent County Active Listings New & existing Single Family homes, Condos, Townhomes 42 Source: Trend MLS


43 Wicomico County Housing Unit Permits: Single Family Structures 43 Source: SOCDS
44 3,600 Delaware Housing Unit Permits: Single Family Structures 3,100 Sussex 2,600 Kent 2,100 1,600 1, Source: SOCDS
45 Single Family Structures Building Permits Year Wicomico Worcester Somerset Source: SOCDS & Somerset Planning & Zoning Office 45
46 Single Family Structures Building Permits Year Sussex Kent Source: SOCDS 46
47 Property Foreclosure Events in Maryland Jurisdictions 2014 Q2 Jurisdiction Notices of default Lender Purchases (REO) Total Number %Change from 2014 Q1 % Change from 2013 Q2 Caroline % 39.7% Dorchester % 28.1% Kent % -0.6% Queen Anne s % 11.6% Somerset % 23.6% Talbot % 16.4% Wicomico % 41.6% Worcester % 32.7% Maryland 5,101 2,859 11, % 3.2% 47 Source: MD DHCD and RealtyTrac
48 Property Foreclosure Events in Maryland Jurisdictions 2014 Q4 Jurisdiction Notices of default Lender Purchases (REO) Total Number %Change from 2014 Q3 Caroline % 6.0% % Change from 2013 Q4 Dorchester % 27.0% Kent % 27.6% Queen Anne s % 14.9% Somerset % -24.3% Talbot % 18.4% Wicomico % 61.7% Worcester % 15.4% Maryland 6,557 3,565 13, % 9.6% Source: MD DHCD and RealtyTrac 48


49 Total Number of filings Delaware Foreclosure Filings 49 Source: The State of Delaware website, Corelogic report
50 Months Inventory Existing Units Source: SWED: MD Association of Realtors
51 SO WHAT S HAPPENING TO THE LOCAL REAL ESTATE MARKET Eastern Shore of Maryland Minimal New Construction has had major Impact. Little product to attract new buyers and keep existing buyers. Septic regs. Plus loss of jobs. Delaware Significantly more new construction and projects. Offers buyers choices. More sales activity, less inventory, but no impact on value. However, macro economic principles should win. 51
52 Commercial Real Estate Values Moody s estimates commercial values declined between 40% - 47% from peak to trough. 52
53 53


54 Lower Shore MD Commercial Improved Median Sale Price: Somerset 2014 Data is as of November 2014 Source: MD Tax Records 54


55 Lower Shore MD Commercial Improved Median Sale Price: Wicomico 2014 Data is as of November 2014 Source: MD Tax Records 55


56 Lower Shore MD Commercial Improved Median Sale Price: Worcester 2014 Data is as of November Source: MD Tax Records
57 Lower Shore DE Commercial Median Sale Price Improved & Unimproved - Sussex $600,000 $550,000 $500,000 $450,000 $400,000 $350,000 $300,000 $250,000 $200, Data is as of December Source: DEL MLS
58 Lower Shore DE Commercial Median Sale Price Improved & Unimproved - Kent $800,000 $700,000 $600,000 $500,000 $400,000 $300,000 $200,000 $100, Data is as of December 2014 Source: DEL MLS 58
59 Non-Residential Units Sold Improved - Somerset Est data is annualized based off of data from January-November Source: MD Tax Records 59
60 Non-Residential Units Sold Improved - Wicomico Est data is annualized based off of data from January-November 60 Source: MD Tax Records
61 Non-Residential Units Sold Improved - Worcester data is based on data from January-November 61 Source: MD Tax Records
62 110 Non-Residential Units Sold Improved & Unimproved - Sussex data is annualized based off of data from January-December 62 Source: DE Tax Records, Innovia MLS System
63 Non-Residential Units Sold Improved & Unimproved - Kent data is based off of data from January-December Source: DE Tax Records 63
64 Lower Shore Commercial Improved Active Listings as of December 31 st Somerset Source: FLEX MLS 64
65 120 Lower Shore Commercial Improved Active Listings as of December 31 st Wicomico Source: FLEX MLS 65
66 200 Lower Shore Commercial Improved Active Listings as of December 31 st Worcester Source: FLEX MLS
67 Resort Areas Commercial Number of New Listings Ocean City, Fenwick & Bethany Delaware Resort (Rehoboth Beach, Lewes & Dewey Beach) Est data is as of December 2014 Ocean City data is as of November Source: Sussex and Flex MLS
68 Resort Areas Commercial Average List Price $1,400,000 $1,300,000 $1,200,000 $1,100,000 Ocean City, Fenwick & Bethany Delaware Resort (Rehoboth Beach, Lewes & Dewey Beach) $1,000,000 $900,000 $800,000 $700,000 $600,000 $500, Est data is as of December 2014 Ocean City data is as of November Source: Sussex and Flex MLS
69 Resort Areas Commercial Units Sold Ocean City, Fenwick, Bethany Delaware Resort (Rehoboth Beach, Lewes, Dewey Beach) Est data is as of December 2014 Ocean City data is as of November Source: Sussex and Flex MLS
70 $1,000,000 $900,000 $800,000 Resort Areas Commercial Average Sale Price Ocean City, Bethany & Fenwick Delaware Resort (Rehoboth Beach, Lewes & Dewey Beach) $700,000 $600,000 $500,000 $400,000 $300,000 $200, Est data is as of December 2014 Ocean City data is as of November Source: Sussex and Flex MLS
71 Resort Areas Commercial Absorption Rate 50% 45% 40% 35% 30% 25% 20% 15% 10% 5% Ocean City, Bethany & Fenwick Delaware Resort (Rehoboth Beach, Lewes & Dewey Beach) 0% Est data is as of December 2014 Ocean City data is as of November Source: Sussex and Flex MLS
72 Delaware Non Resort Commercial Number of New Listings Georgetown, Gumboro, Little Creek, Broad Creek, Nanticoke, Northwest Fork and Seaford, Dagsboro Hundred data is as of December Source: Sussex MLS
73 Delaware Non Resort Commercial Average List Price $800,000 $750,000 $700,000 $650,000 Georgetown, Gumboro, Little Creek, Broad Creek, Nanticoke, Northwest Fork and Seaford, Dagsboro Hundred $600,000 $550,000 $500,000 $450,000 $400, data is as of December Source: Sussex MLS
74 Delaware Non Resort Commercial Units Sold Georgetown, Gumboro, Little Creek, Broad Creek, Nanticoke, Northwest Fork and Seaford, Dagsboro Hundred data is as of December
75 Delaware Non Resort Commercial Average Sale Price $550,000 $500,000 $450,000 Georgetown, Gumboro, Little Creek, Broad Creek, Nanticoke, Northwest Fork and Seaford, Dagsboro Hundred $400,000 $350,000 $300,000 $250,000 $200, data is as of December
76 Delaware Non Resort Commercial Absorption Rate Georgetown, Gumboro, Little Creek, Broad Creek, Nanticoke, Northwest Fork and Seaford, Dagsboro Hundred data is as of December
77 7000 Average $/Acre Agricultural Land Values for Wicomico County Average $/Acre Criteria: Minimum 35 acres or more. Excludes: data outliers, marshlands, multi-parcel commercial transactions and timber tracts 77 Source: W.R. McCain & Associates, Inc., MD State Tax Records, Flex MLS system
78 2015 Predictions Local real estate market is wiggling! Economy to grow at a modest 2.2 to 2.9% Unemployment to remain stable around 6.0% Real Estate market will probably mostly mirror 2014 with some improvement Baby Boomers and Come Heres continue to drive market demand to some degree for our region New housing starts remain slow due to high construction cost, septic restrictions, and large disparity compared to existing home prices but will show some signs of improvement What you see is what you get for 2015,but could get surprised Cautious optimism. Should see some improvement in values 78
Quick Facts. For Week Ending July 14, 2018 Publish Date: July 23, 2018 All comparisons are to % - 2.7% - 14.
 Weekly Market Report A RESEARCH TOOL FROM THE SAINT PAUL AREA ASSOCIATION OF REALTORS. BROUGHT TO YOU BY THE UNIQUE DATA-SHARING TRADITIONS OF THE REALTOR COMMUNITY For Week Ending July 14, 2018 Publish
Weekly Market Activity Report
 X0A0T Weekly Market Report A RESEARCH TOOL FROM THE MINNEAPOLIS AREA ASSOCIATION OF REALTORS BROUGHT TO YOU BY THE UNIQUE DATA-SHARING TRADITIONS OF THE REALTOR COMMUNITY For Week Ending July 14, 2018
Housing and Mortgage Market Update
 Housing and Mortgage Market Update Views from the Top Frank E. Nothaft Vice President and Chief Economist January 8, 2015 Summary: Housing & Mortgage Market Outlook for 2015 Interest rates expected to
CONTENTS. Executive Summary. Southern Nevada Economic Situation 1 Household Sector 4 Tourism & Hospitality Industry
 CONTENTS Executive Summary Southern Nevada Economic Situation 1 Household Sector 4 Tourism & Hospitality Industry Residential Trends 6 Existing Home Sales 10 Property Management Market 11 Foreclosure Situation
CONTENTS. Executive Summary 1. Southern Nevada Economic Situation 2 Household Sector 5 Tourism & Hospitality Industry
 CONTENTS Executive Summary 1 Southern Nevada Economic Situation 2 Household Sector 5 Tourism & Hospitality Industry Residential Trends 7 Existing Home Sales 11 Property Management Market 12 Foreclosure
Sussex County Delaware
 Sussex County Delaware Luxury Housing Market Update November 17 Sussex County, Delaware - November 17 The real estate market is always changing, and if you re buying or selling a home especially a luxury
State of the Nation s Housing 2008: A Preview
 State of the Nation s Housing 28: A Preview Eric S. Belsky Remodeling Futures Conference April 15, 28 www.jchs.harvard.edu The Housing Market Has Suffered Steep Declines Percent Change Median Existing
CALIFORNIA ECONOMIC & MARKET OUTLOOK. October 29,2014 Contra Costa Association of REALTORS Leslie Appleton Young, Chief Economist
 2014 2015 CALIFORNIA ECONOMIC & MARKET OUTLOOK October 29,2014 Contra Costa Association of REALTORS Leslie Appleton Young, Chief Economist OVERVIEW Economic Outlook California Housing Market Outlook Housing
Housing Price Forecasts. Illinois and Chicago PMSA, December 2015
 Housing Price Forecasts Illinois and Chicago PMSA, December 2015 Presented To Illinois Association of Realtors From R E A L Regional Economics Applications Laboratory, Institute of Government and Public
Housing Price Forecasts. Illinois and Chicago PMSA, May 2018
 Housing Price Forecasts Illinois and Chicago PMSA, May 2018 Presented To Illinois Realtors From R E A L Regional Economics Applications Laboratory, Institute of Government and Public Affairs University
Housing Price Forecasts. Illinois and Chicago PMSA, July 2016
 Housing Price Forecasts Illinois and Chicago PMSA, July 2016 Presented To Illinois Association of Realtors From R E A L Regional Economics Applications Laboratory, Institute of Government and Public Affairs
DATA FOR FEBRUARY Published March 20, Sales are up +19.6% month-over-month. The year-over-year comparison is down -7.3%.
 Permission is granted only to ARMLS Subscribers for reproduction with attribution on to ARMLS COPYRIGHT 2019. For questions regarding this publication contact Brand@ARMLS.com. DATA FOR FEBRUARY 2019 -
ECONOMIC CURRENTS. Vol. 4, Issue 3. THE Introduction SOUTH FLORIDA ECONOMIC QUARTERLY
 ECONOMIC CURRENTS THE Introduction SOUTH FLORIDA ECONOMIC QUARTERLY Vol. 4, Issue 3 Economic Currents provides an overview of the South Florida regional economy. The report presents current employment,
Presented to Membership of the Lake Gaston Association. Christine Thompson. June 10, 2014
 Presented to Membership of the Lake Gaston Association Christine Thompson June 10, 2014 About your speaker Christine Thompson Real Estate Sales & Service at Lake Gaston for 13+ years Advanced training
Update of U.S. Residential Real Estate Trends: Including economic data, current sales, new construction,
 THE WRIGHT REPORT Update of U.S. Residential Real Estate Trends: Including economic data, current sales, new construction, interest rates, new construction, and foreclosures. January to June, 2017 www.thewrightinsight.net
Nothing Draws a Crowd Like a Crowd: The Outlook for Home Sales
 APRIL 2018 Nothing Draws a Crowd Like a Crowd: The Outlook for Home Sales The U.S. economy posted strong growth with fourth quarter 2017 Real Gross Domestic Product (real GDP) growth revised upwards to
Housing Price Forecasts. Illinois and Chicago PMSA, June 2012
 Housing Price Forecasts Illinois and Chicago PMSA, June 2012 Presented To Illinois Association of REALTORS From R E A L Regional Economics Applications Laboratory, Institute of Government and Public Affairs
REALTOR.COM MARKET OUTLOOK
 REALTOR.COM MARKET OUTLOOK Realtor.com Economics January 2019 2019 Move, Inc. All rights reserved. Do not copy or distribute. AGENDA Economic and housing data and insights from realtor.com National Forecast
Housing Price Forecasts. Illinois and Chicago PMSA, August 2016
 Housing Price Forecasts Illinois and Chicago PMSA, August 2016 Presented To Illinois Association of Realtors From R E A L Regional Economics Applications Laboratory, Institute of Government and Public
Housing Price Forecasts. Illinois and Chicago PMSA, October 2014
 Housing Price Forecasts Illinois and Chicago PMSA, October 2014 Presented To Illinois Association of Realtors From R E A L Regional Economics Applications Laboratory, Institute of Government and Public
2018 Housing Market Outlook. Central Coast Realty Group Business Symposium February 22, 2018 Oscar Wei Senior Economist
 2018 Housing Market Outlook Central Coast Realty Group Business Symposium February 22, 2018 Oscar Wei Senior Economist Overview Economic Update California Housing Market Outlook Regional Housing Market
Housing Price Forecasts. Illinois and Chicago PMSA, August 2017
 Housing Price Forecasts Illinois and Chicago PMSA, August 2017 Presented To Illinois Realtors From R E A L Regional Economics Applications Laboratory, Institute of Government and Public Affairs University
Housing Price Forecasts. Illinois and Chicago PMSA, January 2019
 Housing Price Forecasts Illinois and Chicago PMSA, January 2019 Presented To Illinois Realtors From R E A L Regional Economics Applications Laboratory, Institute of Government and Public Affairs University
Housing Price Forecasts. Illinois and Chicago PMSA, March 2019
 Housing Price Forecasts Illinois and Chicago PMSA, March 2019 Presented To Illinois Realtors From R E A L Regional Economics Applications Laboratory, Institute of Government and Public Affairs University
Pulse. Contents. prince george s QUARTERLY REPORT. Changes in Employment. Top Ten Changes in Employment 2nd Quarter 2015 to 2nd Quarter 2016
 Contents prince george s Pulse QUARTERLY REPORT Employment and Wages...2 Employment Private Sector Employment Total Wages Average Wage Per Worker Business Establishments Real Estate...4 Housing Market
Housing Price Forecasts. Illinois and Chicago PMSA, March 2016
 Housing Price Forecasts Illinois and Chicago PMSA, March 2016 Presented To Illinois Association of Realtors From R E A L Regional Economics Applications Laboratory, Institute of Government and Public Affairs
ECONOMIC CURRENTS. Vol. 5 Issue 2 SOUTH FLORIDA ECONOMIC QUARTERLY. Key Findings, 2 nd Quarter, 2015
 ECONOMIC CURRENTS THE Introduction SOUTH FLORIDA ECONOMIC QUARTERLY Economic Currents provides an overview of the South Florida regional economy. The report presents current employment, economic and real
Report on Nevada s Housing Market
 June 214 Report on Nevada s Housing Market This series of reports on Nevada s Housing Market is co-presented by the Lied Institute for Real Estate Studies at the University of Nevada, Las Vegas and the
2013 Housing Market Forecast. SILVAR: Los Gatos/Saratoga District October 10, 2012 Leslie Appleton-Young, Vice President & Chief Economist
 2013 Housing Market Forecast SILVAR: Los Gatos/Saratoga District October 10, 2012 Leslie Appleton-Young, Vice President & Chief Economist What we saw from the roof.. C.A.R. NAR THE ECONOMY Recent Housing
THE OUTLOOK FOR HOUSING IN ILLINOIS
 THE OUTLOOK FOR HOUSING IN ILLINOIS Jonathan Smoke Chief Economist January 25, 2017 NATIONAL TRENDS 2 2000.01 2000.05 2000.09 2001.01 2001.05 2001.09 2002.01 2002.05 2002.09 2003.01 2003.05 2003.09 2004.01
MARKET AREA UPDATE Year: 2017 Report as of: 1Q 2Q 3Q 4Q
 MARKET AREA UPDATE Year: 2017 Report as of: 1Q 2Q 3Q 4Q Market Area (City, State): Essex, Hunterdon, Middlesex, Morris, Somerset & Union Provided by (Company / Companies): BHHS New Jersey Properties Provided
2016 MID-YEAR MARKET UPDATE June 23, Breanna Vanstrom, MBA, RCE Chief Executive Officer
 2016 MID-YEAR MARKET UPDATE June 23, 2016 Breanna Vanstrom, MBA, RCE Chief Executive Officer In 2015, Ada County surpassed $2 billion in total dollar volume sold. The first year since 2006. In May 2016,
Market Trends Generated on 04/24/2018 Page 1 of Alpaca St, South El Monte, CA , Los Angeles County.
 9743 Alpaca St, South El Monte, CA 91733-3028, Los Angeles County Pricing Trends Median Sale Price to Current Value - Tax The percentage of properties that have increased or decreased in value based on
Report on Nevada s Housing Market
 December 214 Report on Nevada s Housing Market This series of reports on Nevada s Housing Market is co-presented by the Lied Institute for Real Estate Studies at the University of Nevada, Las Vegas and
Report on Nevada s Housing Market
 July Report on Nevada s Housing Market This series of reports on Nevada s Housing Market is presented by the Lied Institute for Real Estate Studies at the University of Nevada, Las Vegas. These reports
Monthly Indicators - 7.4% + 5.6% % Activity Overview New Listings Pending Sales. Closed Sales. Days on Market Until Sale. Median Sales Price
 Monthly Indicators 218 Rising home prices, higher interest rates and increased building material costs have pressured housing affordability to a ten-year low, according to the National Association of Home
Housing Price Forecasts. Illinois and Chicago PMSA, March 2018
 Housing Price Forecasts Illinois and Chicago PMSA, March 2018 Presented To Illinois Realtors From R E A L Regional Economics Applications Laboratory, Institute of Government and Public Affairs University
Report on Nevada s Housing Market
 March Report on Nevada s Housing Market This series of reports on Nevada s Housing Market is co presented by the Lied Institute for Real Estate Studies at the University of Nevada, Las Vegas and the State
Washington, D.C. Metro Area December 2017 Housing Market Update
 Washington, D.C. Metro Area December 2017 Housing Market Update Washington D.C. Metro housing market closes out 2017 with record high December house price of $420,050; December inventories decline for
Commercial Real Estate Outlook
 Commercial Real Estate Outlook By Lawrence Yun, Ph.D. Chief Economist, National Association of REALTORS Presentation at Annual Conference of National Association of REALTORS Chicago, IL November 3, 2017
DATA FOR JANUARY Published Feburary 16, Sales are down -14.0% month-over-month. The year-over-year comparison is up +2.5%.
 Permission is granted only to ARMLS Subscribers for reproduction with attribution on to ARMLS COPYRIGHT 2018. For questions regarding this publication contact Brand@ARMLS.com. DATA FOR JANUARY 2018 - Published
Report on Nevada s Housing Market
 October Report on Nevada s Housing Market This series of reports on Nevada s Housing Market is presented by the Lied Institute for Real Estate Studies at the University of Nevada, Las Vegas. These reports
Housing Price Forecasts. Illinois and Chicago PMSA, March 2017
 Housing Price Forecasts Illinois and Chicago PMSA, March 2017 Presented To Illinois Realtors From R E A L Regional Economics Applications Laboratory, Institute of Government and Public Affairs University
Housing Price Forecasts. Illinois and Chicago PMSA, April 2018
 Housing Price Forecasts Illinois and Chicago PMSA, April 2018 Presented To Illinois Realtors From R E A L Regional Economics Applications Laboratory, Institute of Government and Public Affairs University
Market Trends Generated on 09/27/2018 Page 1 of Lorenzen Rd, Tracy, CA , San Joaquin County. Pricing Trends
 12 Lorenzen Rd, Tracy, CA 95304-8188, San Joaquin County Pricing Trends Median Sale Price to Current Value - Tax The percentage of properties that have increased or decreased in value based on the year
Monthly Indicators % - 0.2% - 9.5% Activity Overview New Listings Pending Sales. Closed Sales. Days on Market Until Sale. Median Sales Price
 Monthly Indicators 2015 Home prices were up during summer across the nation in year-over-year comparisons. With the economy on full mend, Federal Reserve Chair Janet Yellen has predicted a fine-tuning
Report on Nevada s Housing Market
 June Report on Nevada s Housing Market This series of reports on Nevada s Housing Market is co presented by the Lied Institute for Real Estate Studies at the University of Nevada, Las Vegas and the State
January 2018 longandfoster.com
 January 218 longandfoster.com 78 -2% % % 7% 1% 3% 4% % 3% 2% 4% 4% 3% 3% 7% 9% 11% 13% 1 1% % - Median Sale Price Percent Change Year/Year 79 $219, $212,25 $225, $237, $226, $232, $24,75 $234,3 $238,625
Report on Nevada s Housing Market
 February Report on Nevada s Housing Market This series of reports on Nevada s Housing Market is co presented by the Lied Institute for Real Estate Studies at the University of Nevada, Las Vegas and the
Quick Facts. For Week Ending July 14, 2018 Data current as of July 23, % + 9.2% % Metrics by Week
 Charlotte Region Weekly Market Report A RESEARCH TOOL PROVIDED BY THE CHARLOTTE REGIONAL REALTOR ASSOCIATION FOR MORE INFORMATION CONTACT A REALTOR For Week Ending July 14, 2018 Data current as of July
Economic and Housing Market Outlook ( ) October 31, Contra Costa AOR
 October 31, Contra Costa AOR") Economic and Housing Market Outlook (2012 2013) Contra Costa AOR October 31, 2012 Oscar Wei Senior Research Analyst California Association of REALTORS Overview US and California Economies California Housing
Economic and Housing Market Outlook (2012 2013) Contra Costa AOR October 31, 2012 Oscar Wei Senior Research Analyst California Association of REALTORS Overview US and California Economies California Housing
The Honorable Larry Hogan And The General Assembly of Maryland
 2015 Ratio Report The Honorable Larry Hogan And The General Assembly of Maryland As required by Section 2-202 of the Tax-Property Article of the Annotated Code of Maryland, I am pleased to submit the Department
2017 RESIDENTIAL REAL ESTATE MARKET REPORT
 2017 RESIDENTIAL REAL ESTATE MARKET REPORT Published January 26, 2018 Our market reports have been focused on the effects of low inventory on our housing market and for good reason. December 2017 marked
DATA FOR SEPTEMBER Published October 13, Sales are down -9.7% month-over-month. The year-over-year comparison is at 0%.
 Permission is granted only to ARMLS Subscribers for reproduction with attribution on to ARMLS COPYRIGHT 2017. For questions regarding this publication contact Brand@ARMLS.com. DATA FOR SEPTEMBER 2017 -
April 12, The Honorable Martin O Malley And The General Assembly of Maryland
 April 12, 2011 The Honorable Martin O Malley And The General Assembly of Maryland As required by Section 2-202 of the Tax-Property Article of the Annotated Code of Maryland, I am pleased to submit the
Report on Nevada s Housing Market
 May Report on Nevada s Housing Market This series of reports on Nevada s Housing Market is presented by the Lied Institute for Real Estate Studies at the University of Nevada, Las Vegas. These reports
Housing Price Forecasts. Illinois and Chicago PMSA, September 2016
 Housing Price Forecasts Illinois and Chicago PMSA, September 2016 Presented To Illinois Realtors From R E A L Regional Economics Applications Laboratory, Institute of Government and Public Affairs University
PROPERTY FORECLOSURES IN MARYLAND FOURTH QUARTER 2014
 PROPERTY FORECLOSURES IN MARYLAND LARRY HOGAN BOYD K. RUTHERFORD KENNETH HOLT GOVERNOR LT. GOVERNOR ACTING SECRETARY January 2015 Office of Research, Policy and Legislative Affairs Maryland Department
Metropolitan Indianapolis Board of REALTORS. Broker/Owner Meeting March 14, 2007
 Metropolitan Indianapolis Board of REALTORS Broker/Owner Meeting March 14, 2007 Tom Renkert Information Services Director MIBOR PropertyLinx 2 Implementation Time Line February 1-28 March 1 June 30 July
Housing Price Forecasts. Illinois and Chicago PMSA, April 2013
 Housing Price Forecasts Illinois and Chicago PMSA, April 2013 Presented To Illinois Association of Realtors From R E A L Regional Economics Applications Laboratory, Institute of Government and Public Affairs
Quarterly Housing Market Update
 Quarterly Housing Market Update An Overview New Hampshire s current housing market performance, as well as its overall economy, is slowly improving, with positives such as increasing employment and rising
Report on Nevada s Housing Market
 May Report on Nevada s Housing Market This series of reports on Nevada s Housing Market is co presented by the Lied Institute for Real Estate Studies at the University of Nevada, Las Vegas and the State
Monthly Indicators - 9.7% % + 5.6% Activity Overview New Listings Pending Sales. Closed Sales
 Monthly Indicators 2018 Some economy observers are pointing to 2018 as the final period in a long string of sentences touting several happy years of buyer demand and sales excitement for the housing industry.
Austin-area home prices set August record, outpace household income growth in August 2015
 Austin-area home prices set August record, outpace household income growth in August 2015 Market Reports Austin Board of REALTORS releases real estate statistics for August 2015 AUSTIN, Texas September
2011 ASSESSMENT RATIO REPORT
 2011 Ratio Report SECTION I OVERVIEW 2011 ASSESSMENT RATIO REPORT The Department of Assessments and Taxation appraises real property for the purposes of property taxation. Properties are valued using
INLAND EMPIRE REGIONAL INTELLIGENCE REPORT
 INLAND EMPIRE REGIONAL INTELLIGENCE REPORT June 2016 EMPLOYMENT After a slow start to 2016, the Inland Empire s labor market returned to form, in recent job figures. Seasonally adjusted nonfarm employment
FY General Revenue Forecast Presentation
 FY 2015-2019 General Revenue Forecast Presentation Steven A. Solomon Director of Finance February 18, 2014 Overview Current Economic Outlook National State Local FY 2014 2nd Quarter Revenue Update Five
State of the Nation s Housing 2011: A Preview
 State of the Nation s Housing 2011: A Preview Christopher Herbert Remodeling Futures Conference April 5, 2011 www.jchs.harvard.edu No Signs of a Recovery Yet % Change % Change Description: 2008 2009 2010
Monthly Indicators % + 9.4% % Activity Overview New Listings Pending Sales. Closed Sales. Days on Market Until Sale. Median Sales Price
 Monthly Indicators 2017 The number of homes for sale, days on market and months of supply were all down in year-over-year comparisons in a majority of the country for the entirety of 2017, as was housing
Report on Nevada s Housing Market
 March Report on Nevada s Housing Market This series of reports on Nevada s Housing Market is co-presented by the Lied Institute for Real Estate Studies at the University of Nevada, Las Vegas and the State
Monthly Indicators - 6.1% + 6.6% + 4.3% Activity Overview New Listings. Closed Sales Median Sales Price
 Monthly Indicators 2017 The number of homes for sale, days on market and months of supply were all down in year-over-year comparisons in a majority of the country for the entirety of 2017, as was housing
DATA FOR APRIL Published May 15, Sales are down -4.4% month-over-month. The year-over-year comparison is up +3.7%. ARMLS STAT APRIL 2018
 Permission is granted only to ARMLS Subscribers for reproduction with attribution on to ARMLS COPYRIGHT 2018. For questions regarding this publication contact Brand@ARMLS.com. DATA FOR APRIL 2018 - Published
Residential Real Estate Market Overview: April 2017 Data
 Residential Real Estate Market Overview: April 2017 Data 2017 Mark A. Melikian Chief Valuation Officer mark.melikian@summitvaluations.com 2800 River Road, Suite 460 The following is a market data summary
Monthly Indicators. September Monthly Snapshot + 2.0% + 7.4% %
 Monthly Indicators For residential real estate activity by members of the Florida REALTORS 2012 Most housing metrics should follow their usual, autumnal movements higher inventory and days on market, fewer
MARKET AREA UPDATE Report as of: 1Q 2Q 3Q 4Q
 Year: 2013 Market Area (City, State): Baltimore Metropolitan Area MARKET AREA UPDATE Report as of: 1Q 2Q 3Q 4Q Provided by (Company / Companies): LONG & FOSTER REAL ESTATE, INC. What are the most significant
ECONOMIC CURRENTS. Vol. 3, Issue 3 SOUTH FLORIDA ECONOMIC QUARTERLY. Introduction
 ECONOMIC CURRENTS THE Introduction SOUTH FLORIDA ECONOMIC QUARTERLY Economic Currents provides an overview of the South Florida regional economy. The report presents current employment, economic and real
MARKET OUTLOOK FOR SAN MATEO
 MARKET OUTLOOK FOR SAN MATEO Jonathan Smoke Chief Economist August 2, 2016 NATIONAL TRENDS 2 JOB CREATION REBOUNDED IN JUNE 229,000 jobs created by month in 2015; 172,000 average this year Employment and
Monthly Indicators + 4.8% - 3.5% %
 Monthly Indicators 2015 New Listings were up 45.0 percent for single family/duplex homes but decreased 44.1 percent for townhouse-condo properties. Pending Sales increased 14.3 percent for single family/duplex
Pikes Peak area housing Market Statistics (As of: 2/28/2018)
") Jan-1-1 -1-1 Jan-2-2 -2-2 Jan-3-3 -3-3 -4-4 -4-5 -5-5 -6-6 -6-7 -7-7 -8-8 -8-9 -9-9 -1-1 -1-11 -11-11 -12-12 -12-13 -13-13 -14-14 -14-15 -15-15 -16-16 -16-17 -17-17 Jan-1-1 -1-1 Jan-2-2 -2-2 Jan-3-3 -3-3
Jan-1-1 -1-1 Jan-2-2 -2-2 Jan-3-3 -3-3 -4-4 -4-5 -5-5 -6-6 -6-7 -7-7 -8-8 -8-9 -9-9 -1-1 -1-11 -11-11 -12-12 -12-13 -13-13 -14-14 -14-15 -15-15 -16-16 -16-17 -17-17 Jan-1-1 -1-1 Jan-2-2 -2-2 Jan-3-3 -3-3
Residential Real Estate Market Overview: September 2017 Data
 Residential Real Estate Market Overview: September 2017 Data 2017 Mark A. Melikian Chief Valuation Officer mark.melikian@summitvaluations.com 2800 River Road, Suite 460 The following is a market data summary
Remodeling Trends and Outlook
 Remodeling Trends and Outlook Kermit Baker Remodeling Futures Conference October 16, 2007 www.jchs.harvard.edu Recent Remodeling Trends Growth in remodeling spending began to ease in Q3-2006. After Strong
DATA FOR MAY Published June 23, Sales are up +11.3% month-over-month. The year-over-year comparison shows an increase of +11.1%.
 Permission is granted only to ARMLS Subscribers for reproduction with attribution on to ARMLS COPYRIGHT 2017. For questions regarding this publication contact Brand@ARMLS.com. DATA FOR MAY 2017 - Published
Monthly Indicators % + 3.1% %
 Monthly Indicators A RESEARCH TOOL PROVIDED BY NORTH TEXAS REAL ESTATE INFORMATION SYSTEMS, INC. 2018 The booming U.S. economy continues to prop up home sales and new listings in much of the nation, although
Monthly Indicators % % % Activity Overview New Listings Pending Sales. Closed Sales. Days on Market Until Sale. Median Sales Price
 Monthly Indicators 2018 Residential real estate activity has been relatively slow in the first quarter of 2018, yet housing is proving its resiliency in a consistently improving economy. Some markets have
Pikes Peak area housing Market Statistics (As of: 9/30/2018)
") $156,25 $184, $174,697 $177,2 $21,53 $185,83 $173, $178,29 $172,25 $212,75 $21,95 $226,692 $197,5 $199, $196, $28, $25, $223,95 $216,75 $29,527 $234,9 $218,82 $229,74 $235,518 $231,457 $255, $259,11 $269,98
$156,25 $184, $174,697 $177,2 $21,53 $185,83 $173, $178,29 $172,25 $212,75 $21,95 $226,692 $197,5 $199, $196, $28, $25, $223,95 $216,75 $29,527 $234,9 $218,82 $229,74 $235,518 $231,457 $255, $259,11 $269,98
Residential Real Estate, Demographics, and the Economy
 Residential Real Estate, Demographics, and the Economy Presented to: Regional & Community Bankers Conference Yolanda K. Kodrzycki Senior Economist and Policy Advisor Federal Reserve Bank of Boston October
ECONOMIC CURRENTS. Vol. 3, Issue 1. THE SOUTH FLORIDA ECONOMIC QUARTERLY Introduction
 ECONOMIC CURRENTS THE SOUTH FLORIDA ECONOMIC QUARTERLY Introduction Economic Currents provides an overview of the South Florida regional economy. The report contains current employment, economic and real
CALIFORNIA ECONOMIC & MARKET OUTLOOK. October 29,2014 SILVAR Leslie Appleton-Young, Chief Economist
 2014-2015 CALIFORNIA ECONOMIC & MARKET OUTLOOK October 29,2014 SILVAR Leslie Appleton-Young, Chief Economist OVERVIEW Economic Outlook California Housing Market Outlook Housing Affordability Regional Market
Housing: Where The Action Is. Presented by: Mary Bujold Maxfield Research Inc.
 Housing: Where The Action Is Presented to: Sensible LandUseCoalition Presented by: Mary Bujold Maxfield Research Inc. February 26, 2014 Headlines 2013: Widespread Market Recovery Twin Cities Housing Market
Annual Report on the Hilton Head Housing Market A FREE RESEARCH TOOL FROM THE HILTON HEAD AREA ASSOCIATION OF REALTORS
 Annual Report on the Hilton Head Housing Market A FREE RESEARCH TOOL FROM THE HILTON HEAD AREA ASSOCIATION OF REALTORS Annual Report on the Hilton Head Housing Market A FREE RESEARCH TOOL FROM THE HILTON
1200 Premier Drive, Suite 140 Chattanooga, TN Each office is independently owned and operated.
 THIS MONTH IN REAL ESTATE K im aulston R REALTOR 1200 Premier Drive, Suite 140 Chattanooga, TN 37421 Each office is independently owned and operated. Cell: 423-316-4022 Office: 423-664-1600 Email: kcraulston@gmail.com
Report on Nevada s Housing Market
 August 216 Report on Nevada s Housing Market This series of reports on Nevada s Housing Market is presented by the Lied Institute for Real Estate Studies at the University of Nevada, Las Vegas. These reports
Monthly Indicators - 8.0% + 4.2% - 3.4% Activity Overview New Listings Pending Sales. Closed Sales. Days on Market Until Sale. Median Sales Price
 Monthly Indicators 2018 If the last few months are an indication of the temperature of housing markets across the country, a period of relative calm can be expected during the last three months of the
Report on Nevada s Housing Market
 July Report on Nevada s Housing Market This series of reports on Nevada s Housing Market is co-presented by the Lied Institute for Real Estate Studies at the University of Nevada, Las Vegas and the State
Real gross domestic product California vs. United States
 Real gross domestic product California vs. United States Percent change, year ago 6 4 U.S. California 2 0-2 -4-6 2001 2002 2003 2004 2005 2006 2007 2008 2009 2010 2011 Source: Bureau of Economic Analysis.
Report on Nevada s Housing Market
 February Report on Nevada s Housing Market This series of reports on Nevada s Housing Market is co presented by the Lied Institute for Real Estate Studies at the University of Nevada, Las Vegas and the
Housing Price Forecasts. Illinois and Chicago PMSA, January 2018
 Housing Price Forecasts Illinois and Chicago PMSA, January 2018 Presented To Illinois Realtors From R E A L Regional Economics Applications Laboratory, Institute of Government and Public Affairs University
Has The Office Market Reached A Peak? Vacancy. Rental Rate. Net Absorption. Construction. *Projected $3.65 $3.50 $3.35 $3.20 $3.05 $2.90 $2.
 Research & Forecast Report OAKLAND METROPOLITAN AREA OFFICE Q1 Has The Office Market Reached A Peak? > > Vacancy remained low at 5. > > Net Absorption was positive 8,399 in the first quarter > > Gross
November An updated analysis of the overall housing needs of the City of Aberdeen. Prepared by: Community Partners Research, Inc.
 City of Aberdeen HOUSING STUDY UPDATE November 2010 An updated analysis of the overall housing needs of the City of Aberdeen Prepared by: Community Partners Research, Inc. nd 10865 32 Street North Lake
Baltimore, MD Metro Area September 2017 Housing Market Update
 Baltimore, MD Metro Area September 2017 Housing Market Update Baltimore Metro median sales price of $253,000 is near September record; Active inventories decline by 11.4% to lowest September level of the