Inclusionary Housing and the Inclusionary Housing Calculator
|
|
|
- Letitia Gardner
- 5 years ago
- Views:
Transcription

1 Inclusionary Housing and the Inclusionary Housing Calculator Case Study in the City of North Vancouver Capstone Report Emma Watson April 2018 PLAN 528
2 Preface PREFACE This report was created to fulfill PLAN 528 course requirements at UBC s School of Community and Regional Planning Master s Program. For PLAN 528 requirements, I chose to write a report to continue with research from my internship at the City of North Vancouver as a Research Assistant in the Planning department. My primary deliverable in this role was creating the Inclusionary Housing Calculator, which will be the base in which this report is formed. I would like to thank Wendy Tse and Michael Epp and the City of North Vancouver planning staff for their time and aid over the past 8 months in helping to conceptualize this project.
3 TABLE OF CONTENTS Executive Summary 1 Introduction 2 Inclusionary Housing Overview 4 Affordable Housing Policy in Canada 5 What is Inclusionary Housing? 6 How It Works 7 Typical Inclusionary Housing Policies and Practices 9 The Inclusionary Housing Calculator 10 Methodology 11 Functionality 13 Case Study Application: The City of North Vancouver 16 Housing Need in the City of North Vancouver 17 City Council Directive to Explore Inclusionary Housing 19 Rental Building Analysis 22 Base Case: Current Policy 23 Case A: Minor shift in the current policy to Case B: Substantial shift in the current policy to Case C: Substantial shift in the current policy to Case D: One-off developments to Future Considerations 28 Conclusion 29 References 30 Appendices Appendix A - Inclusionary Housing Calculator Workbook Appendix B - Inclusionary Housing Calculator Images Appendix C - Community Benefits and Density Bonus Policy Appendix D - Schedule A Land Use Map
4 EXECUTIVE SUMMARY Inclusionary housing is a proven method that allows municipalities to provide more affordable housing for those in need. By leveraging rising housing market prices and by involving the private sector in the production of affordable housing units, inclusionary housing is an appealing policy that municipalities should consider when developing affordable housing strategies or action plans. By creating more housing choice through inclusionary housing, municipalities can hopefully ease the burden that the market cannot provide. This report highlights the nuances of inclusionary housing, its history in British Columbia, typical policies and principles, and the impacts of inclusionary housing in the efforts to increase affordable housing. The report also showcases an innovative tool that can be made available to municipalities to more easily understand how inclusionary housing can be implemented and what is feasible depending on the subject market - The Inclusionary Housing Calculator. The Inclusionary Housing Calculator is an accessible tool used through Microsoft Excel to explore different inclusionary housing policy scenarios and their feasibility in the current market context. By increasing the exposure to inclusionary housing through on this easy-to-use calculator, policies can be created or amended in respective municipalities to increase the amount of non-market housing to effectively provide more affordable housing for low to middle income earners that the market does not supply for. The Inclusionary Housing Calculator is then used to evaluate four different cases in the City of North Vancouver that are all considered to be effective inclusionary housing policies. The four cases determine different policy directions that the City can take depending on the level of involvement they wish to have and to align the objectives of the policy with the City s need for affordable housing, as well as City Council s directive. Lastly, future policy considerations will be presented after financial feasibility and sensitivity analysis in the North Vancouver market. 1
5 INTRODUCTION Housing is a complex, multidimensional issue, which makes developing effective housing policies challenging. Housing is embedded within larger institutions, such as private markets and public government, and can be conceptualized as many different things to many different people; a commodity, an asset, a sector of the economy, or, simply, a physical structure that offers shelter (Bourne, 1981). This complexity adds to the challenges involved with addressing the issue of housing affordability and explains why the affordable housing problem persists despite being a policy concern for decades in Canada and the rest of the world. The housing affordability concern continues to perpetuate in Canada, as a one-size-fits-all strategy has yet to solve many of the problems that the housing market faces (Mah, 2009). Inclusionary housing, a housing policy that enables municipalities to require developers to provide more affordable non-market units when developing market buildings, is an emerging method to help communities create more affordable homes for its residents. Inclusionary housing is one of the most promising strategies available to ensure that the benefits of development are shared widely and that affordable housing can be provided in a way that does not over-burden already limited provincial and federal housing programs, as inclusionary housing programs typically operate without higher-government sources of funding and subsidies. In the city of North Vancouver, housing prices have continued to skyrocket in the last decade. In Metro Vancouver, North Vancouver had the second highest rental average at $1,333 per month, and has climbed 49% since 2007 (CMHC, 2017). The increase in home prices was also observed in the ownership market in the last decade, as the average house price in the City rose to $1,690,600, a 98% increase in the last decade (Real Estate Board of Greater Vancouver). This housing market has caused several households to feel the pressures of housing unaffordability due to the climbing costs associated with housing, and have created the need to house the residents of North Vancouver to be housed in more affordable homes to align with their incomes. The City of North Vancouver has already been very progressive in researching ways to mitigate this housing unaffordability, and has enacted a policy that allows for the provision of non-market homes by creating an inclusionary housing policy within their Density Bonus and Community Benefits Policy. Although this policy was recently approved by City Council, the Planning Department is taking a proactive approach to explore potential inclusionary housing policies that provide more units of non-market housing. By doing this, the City of North Vancouver acts as a catalyst for change in the increasing unaffordable housing market by exploring more effective methods in which inclusionary housing can work in their municipality. 2
6 Therefore, it is important to conduct research that properly evaluates the outcomes of inclusionary programs and their ability to effectively produce affordable housing. The research in this report comes at a topical time in the housing and urban planning sectors, as the Government of Canada has recently released a National Housing Strategy to try and combat unaffordable housing, and BC Housing, the province of British Columbia s housing entity, has recently created a HousingHub, whereby local governments, Indigenous partners, the non-profit sector and developers will come together for innovative partnerships that create homes that people in BC can afford (BC Housing, 2018). The importance of Inclusionary housing is highlighted in both the federal and provincial strategies, so this report provides timely considerations for the City of North Vancouver to inform their policies. The following report provides a synopsis of inclusionary housing practices, as determined by a literature review, and then applies these principles to the Inclusionary Housing Calculator, and subsequently evaluates potential inclusionary housing policies that would be feasible in the City of North Vancouver, and will answer the following research questions: How does the Inclusionary Housing Calculator benefit communities? What kinds of inclusionary housing policies are feasible in the City of North Vancouver? 3
7 INCLUSIONARY HOUSING OVERVIEW 4
8 Affordable Housing Policy in Canada Housing professionals and policy-makers often use the indicator of affordable as a measure of housing vulnerability. As indicated by the Canada Mortgage and Housing Corporation (CMHC), a home is affordable when a household pays 30% or less of their before-tax income on all shelter costs, including rent or mortgage, utilities, and property taxes (CMHC, 2016). In recent decades in Canada, the growing gap between rich and poor Canadian households has increasingly manifested itself in the housing system due to the federal government s divestation in housing and allocating resources to the provincial level instead (Gladki & Pomeroy, 2007). Although provinces and territories are responsible for many successful housing programs and projects, they are unable to keep up with the increasing need for affordable, safe, and suitable housing, due to lack of funding, the increasing unaffordability in many municipalities, and aging affordable housing infrastructure. In North America, housing costs began to spiral upward in the 1970s and have continually risen since then. In light of this increased housing price, the need for affordable housing has grown (Gladki & Pomeroy, 2007). While housing unaffordability historically impacted low-income households, increased housing costs are affecting even moderate income households in many cities, and the market in some cities has caused housing to be unaffordable for middle-income earners and even some higher earning households, and has shown to be affecting all categories along the housing continuum, as seen in Figure 1. Moreover, the social need for housing exists mainly among renters tenants whose income (and lack of wealth) cannot generate effective market demand for suitable housing for their income level (Hulchanski, 2007). NON-MARKET MARKET emergency shelter transitional + supportive housing social housing low-end of market rental housing market rental housing home ownership Figure 1 - Housing Continuum As provincial governments haven t adequately been able to keep up with affordable housing demand, as previously discussed, municipalities have taken it upon themselves to create affordable housing. Many regions that are facing an affordability crisis, such as Metro Vancouver and the Greater Toronto Area, have opted to create action plans to increase the amount of affordable housing that has been identified as a problem in their respective areas. Firstly, a municipality or region will identify the housing needs of their residents and evaluate if the current needs are being met through market and non-market intervention, and whether the residents in the community are in need of certain types of housing for certain incomes and family types. The next stage is to identify a Housing Action Plan, or something similar, which allows the municipality to determine how the housing needs of the community will be met and what kind of interventions need to happen to 5
9 meet the need. This need is identified by many different factors; the census information on household type, number of bedrooms, and family size and the amount of income spent on housing for individual, couple, or family households, as well as average market rental reports. By analyzing this data, a municipality has a better sense of how to address the issues each respective household is facing to try and create positive change. One way to address the supply of affordable housing in the municipal setting is through inclusionary housing policies. What is Inclusionary Housing? Inclusionary housing (IH) is an important tool for producing affordable housing in municipalities. It enables municipalities to harness their own powers to engage private developers in the provision of affordable housing. Most importantly, IH does this without relying on the use of subsidies from the provincial or federal government, which have been the major funding enablers of affordable housing throughout Canadian history. It also plays an important role in the creation of affordable housing mixed into market housing, and therefore creates a robust community of people with varying incomes and demographics. Research into the benefits and limitations of mixed-income development suggests that the creation and preservation of affordable homes in asset-rich neighborhoods is one of the few successful strategies for overcoming economic segregation (Urban Land Institute, 2016). Over time, IH policies allow housing to be built widely across the community, providing residents with much greater housing choice, better access to services, and better proximity to employment than traditional subsidized or social housing projects created in Canada s past (Richard Drdla Associates, 2016). The term inclusionary housing is used in reference to municipal initiatives that use the planning regulations and development approval process to engage private developers in providing a percentage of affordable housing in their otherwise market housing developments, whereby the economic gains from rising real estate values can be harnessed to subsidize non-market housing (Richard Drdla Associates, 2016). For example, an inclusionary housing program might require housing developers to rent new units at a range from 10 to 30 percent of the development to middle-income residents. Inclusionary housing policies are sometimes referred to as inclusionary zoning because this type of requirement tends to be implemented through a municipality s zoning by-law (Lincoln Institute of Land Policy, 2015). Many municipal IH programs aim to partially offset the cost of providing non-market units by offering developers one or more cost saving incentives, such as tax and development fee relief, parking reductions, or the right to build at higher densities through density bonuses. Most municipal programs recognize that the inclusion of non-market units within market-rate projects may not always be feasible, so alternatives such as payment in-lieu of developing units or the provision of affordable units off-site in another project are also normally available to developers (InclusionaryHousing.org, 2018). Further financial analysis is necessary in each municipality to ensure that development is not stinted in the current real estate market, as, for example, if a municipality requires 40% of all new residential development to include non-market housing through inclusionary housing policy, developers may have a lower profit margin and therefore choose not to build in the subject 6
10 municipality. However, the economics of inclusionary housing suggest that well-designed programs can generate significant affordable housing resources without overburdening developers or landowners or negatively impacting the pace of development (Urban Land Institute, 2016). IH has generally not produced housing for low-income households and those in greatest need, as this requires deeper subsidies that can be provided and sustained only by senior government funding. IH is therefore best described as producing below-market or workforce housing for moderate-income households that cannot afford rising market prices, but earn too much money to qualify for government subsidies. Although there are many positive outcomes that IH provides, there are limits to IH policies functionality within Canada and British Columbia due to the nation s government structure, as currently, Canadian municipalities are unable to make inclusionary housing policies mandatory. IH is not the answer for all affordable housing needs; it represents an addition to, but not a replacement for, conventional federal, provincial, and municipal programs that have been successful. How It Works Within the province of British Columbia, municipalities do not have the legislative authority to create mandatory inclusionary housing policies, and therefore they are less demanding, and thus, less effective. The province did, however, pass legislation in 1994 to the Local Government Act to plan for affordable housing and authorized the use of various regulatory tools to provide this housing (Inclusionary Housing Canada, 2014). These tools consist of density bonusing and comprehensive density zoning. Most of the municipalities in British Columbia s inclusionary policy works through density bonusing (see Figure 2 for definition), and therefore are not mandatory policies, as it is the developer s choice to seek bonus density during the development application process. Comparable voluntary policies in the US have been found to be far less successful in producing inclusionary units than comparable mandatory programs (Mah, 2009). Inclusionary housing policies can be targeted to many different income earners, depending on the housing need for a municipality, but is typically categorized as social housing within the non-market housing spectrum along the continuum, as seen in Figure 3. As previously discussed, this is generally targeted towards middle-income workforce housing, but can be adapted to suit the needs of the community. IH rents can be tailored to meet: a percentage of annual median income for the area a percentage below market rents a percentage below Housing Income Limits (HILs) for the governing housing authority in the area Density Bonusing Allowing an additional level of density as outlined in the OCP in exchange for amenities or housing needed by the community Figure 2 - Density Bonus definition 7
11 NON-MARKET MARKET emergency shelter transitional + supportive housing social housing low-end of market rental housing market rental housing home ownership Figure 3 - Inclusionary housing as non-market housing social housing on the continuum As previously discussed, municipal inclusionary housing policies work within density bonus parameters in practice. Density bonusing can be described as allowing an additional level of density than as outlined in the Official Community Plan, in exchange for amenities or housing needs in the community. By developers seeking additional density for their developments, they can provide a social good for the community through seeking density bonuses. As seen below, Figure 4 conceptualizes IH by firstly outlining what the as of right zoning would allow in the Official Community Plan, by secondly showing what the development would look like with adding bonus density, and lastly, highlighting the inclusionary units that are non-market social housing. as of right zoning zoning with density bonus density bonus with inclusionary housing units Figure 4 - Conceptualizing as of right zoning, density bonusing, and inclusionary housing units 8
12 Typical Inclusionary Housing Policies and Practices Percent of Building - In many jurisdictions, municipalities that use IH policies generally require a range of 10% to 25% of units in new developments to be inclusionary. In some municipalities, there are different percentages to reflect different planning priorities, such as the need for lowerincome households, or the need for larger, family-sized units. Length of Time - Municipalities with inclusionary housing provisions often require that affordability be secured over the long term. For rental housing, these are fairly straightforward and are generally based on project-specific agreements ensuring affordable rent levels for at least 10 and up to 35 years. Design - Most municipalities do not require the inclusionary units and market units to be identical. However, they generally encourage design that makes the affordable units appear similar in outward appearance. There is also a general practice of disbursing the affordable units through a development rather than massing all in one part of the site, which enhances the objective of inclusion (Richard Drdla Associates, 2016). In practice, it is often easier and just as economical to create inclusionary and market units using the same construction techniques, but instead have less expensive fixtures and appliances installed in the inclusionary units to ensure cost-savings. In summary, while addressing the great need for affordable housing in many cities, the most attractive benefits of inclusionary housing can be seen by three main outcomes: IH incurs little to no financial cost to local, provincial, or federal governments. The cost of providing affordable housing under an inclusionary zoning program is spread to varying degrees amongst landowners, developers, purchasers of market units, and the community IH creates communities with better income integration, rather than isolating affordable housing in separate neighbourhoods within cities IH addresses urban sprawl, as units are typically denser and smaller than traditional new housing units, as they are typically gained through density bonuses 9
13 THE INCLUSIONARY HOUSING CALCULATOR 10
14 The Inclusionary Housing Calculator (IHC) is a tool that allows municipalities to quickly evaluate and test different inclusionary housing policies in their current market. When considering whether to adopt or revise an inclusionary housing policy, local governments often prepare a feasibility study which evaluates the economic trade-offs of requiring a certain percentage of inclusionary units in new residential or mixed-use projects. The Lincoln Institute of Land Policy created an inclusionary housing calculator to determine feasibility of inclusionary policies, and the IHC for this report is adapted from this calculator, but with context-specific values and assumptions to determine feasibility within Canada s current housing and construction context. The IHC is used as a Microsoft Excel Workbook; meaning that it does not require expensive software, training, or expertise, and is accessible for municipalities who use Microsoft Office programs. The IHC is an important tool that municipalities can utilize to help understand the complexities of inclusionary housing policies. Having this tool will allow policy makers to evaluate different scenarios that will ensure that if a certain policy is enacted, development would still continue and the market would still be able develop feasible buildings. To read the following sections, please open Appendix A - The Inclusionary Housing Calculator, or alternatively, Appendix B includes screen captures of the IHC spreadsheet to consider when viewing the following. Methodology The IHC s calculations are evaluated through development pro formas. Pro formas are used by developers to evaluate potential revenues and costs, both during construction and operationally, to determine the feasibility of projects. In theory, if the amount of money to be earned from revenue in the project outweighs the costs to build the project, then the project is considered feasible, which indicates that the project will likely be successful. There are many factors that go into development pro formas - they can often be very detailed down to the smallest costs to ensure feasibility of developments after all costs are considered. A simple pro forma statement without values can be observed in Figure 5 on the next page to get an idea of the process. 11
15 Figure 5 - Example development pro forma used in the Inclusionary Housing Calculator 12

16 Functionality As previously mentioned, the IHC is used as a Microsoft Excel workbook. The main sheet in the excel spreadsheet, Input & Output, as shown in Figure 6, is used to input context-specific data and output context-specific feasibility metrics. For the purposes of this report, the City of North Vancouver Case Study in the following section, the City of North Vancouver s density bonus parameters will be used to explain the functionality of the IHC. Figure 6 - Screenshot of the IHC main tab - Input & Output 1 - Input Variables The calculator works by taking the inputs under the Variables section in the Input & Output sheet that are typical development pro forma variables and applies them to the different scenarios in each of the density bonus zones for the three analyses current zoning, current density bonus policy, and potential inclusionary housing policy, as expressed in Figure 4 in the previous section. The variables are listed below and shown in the calculator in Appendix A. The first step is to input these variables into the orange cells above to establish the current market conditions. Site size Construction cost (per square foot) Average market rental rate Average market sales rate Required developer profit Cap rate Building efficiency Cost of land 13
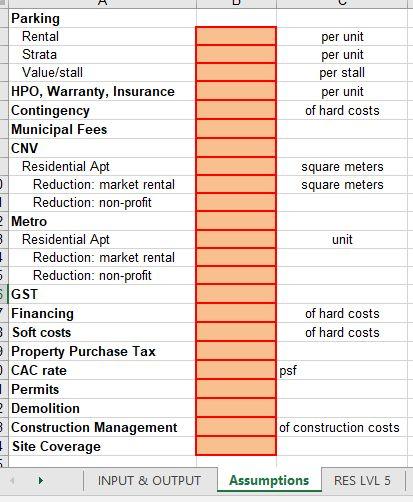
17 2 - Input Inclusionary Adjustments The next step is to make the inclusionary housing policy adjustments in the Input & Output sheet under Inclusionary Adjustments. By inputting the market-specific variables to create base feasibility, and then adjusting the inclusionary scenarios in the purple cells, this creates the market scenario to determine which policies would work within the current market and determines if the project could still be feasible by implementing different inclusionary housing scenarios. The IHC also functions to determine the feasibility of strata developments with rental inclusionary units as a portion of the density bonus, but will not be analyzed in this report due to scope limitations. The inclusionary housing variables are listed below and are shown in the calculator in Appendix A. Percent of building as inclusionary units Rental rate options: Percent below CMHC average rents Percent of annual median income for the municipality Per cent below Housing Income Limits (as per BC Housing rates) 3 - Adjust Project-Specific Assumptions Next, the pro forma assumptions are evaluated through the Assumptions sheet, as seen in Appendix A. As rates and values often change in these types of analyses, the assumptions below are all adjustable via the Assumptions sheet: Parking Stalls per unit Value per stall Contingency Municipal fees Development Cost Charges Municipality Residential apartment Residential market rental Residential non-profit rental District Residential apartment Residential market rental Residential non-profit rental Financing rate Soft cost rate Property purchase tax Community Amenity Contribution rate Permit cost Demolition cost Construction management costs Site coverage 14
18 4 - Adjust Rental Rates Data used for rental rates and unit sizes are located in the next Rental Index sheet, as seen in Appendix A. All three types of rental rate calculations are completed in this tab - CMHC average rents, HILs average rents, and rents based on Annual Median Income. When Statistics Canada and CMHC release new rental index information, this sheet should be updated to reflect current market conditions. 5 - Feasibility The final feasibility comparison on the Input and Output sheet is between the land cost in today s market and the residual land value in each scenario (per square foot buildable) after the inputs from the Input & Output, Assumptions, and Rental Index sheets are run through the development pro formas in each density bonus scenario (the remaining sheets). Feasibility of the different analyses in each density bonus zone can be viewed in their respective sheet by comparing land lift values in each scenario, but are summarized in the Input & Output sheet to quickly view changes to inclusionary housing policies and if they are considered feasible or not in each density bonus policy with a simple check or X, as seen in Appendix A. 15
19 CASE STUDY APPLICATION: THE CITY OF NORTH VANCOUVER 16
20 Housing Need in the City of North Vancouver In the Metro Vancouver region, the City of North Vancouver s rents are the second highest, with an average rent in the city at $1,333 per month (CMHC, 2017). At CMHC s affordability rates (30% of household income), this is unattainable especially for the majority of individual households in the city making a median income of $36,973 or less in 2016, but also impacts higher-income households as well. While average rent per month is comparably higher than most municipalities in Metro Vancouver, rents in the City of North Vancouver have also increased by 49% in the 10-year period from 2007 to This furthers the unaffordability gap between individuals incomes and their ability to pay rent, as shown in Figure 7. Both family and non-family households, with moderate-income and low-income occupations are challenged to afford the average rental prices in the City and are also therefore priced out of the homeownership market. These occupations include early childhood educators, nurses, office clerks, financial clerks, and many others that support a mixed community (Gladki and Pomeroy, 2017). Compared to average rental prices, many of these workers are paying greater than 30 percent of their gross income towards housing costs. With lower earning power, the City s residents are vulnerable to rises in the cost of living, including housing costs. $1,400 $1,333 $1,300 $1,243 $1,200 $1,158 Rent per month $1,100 $1,000 $900 $857 $895 $924 $958 $973 $1,003 $1,021 $1,067 $1,093 $924 avg rent avg affordable rent $800 $863 $700 $695 $ Year Figure 7 - Average Market Rent and Average Affordable Rent - City of North Vancouver, Source: CMHC, Statistics Canada Rental housing is an important part of the City s housing stock with almost half of City households being renter households. However, with the expiry of federal incentive programs in the 1970s, no new purpose-built rental units were constructed in the City until the 2000s. 17
21 As a result, the North Vancouver has an aging rental stock that is in need of reinvestment, rehabilitation, and in some cases, redevelopment. While the city has a significant number of purpose-built rental units, most of these units are older. Almost all of the city s purpose-built rental stock was constructed prior to 1980 (Figure 8), with the greatest number of purposebuilt rental units built between the 1950s and1960s, when senior government capital and rent subsidies were available to facilitate rental housing development. The elimination of federal programs and changes to the federal tax structure in the 1970s initiated a long period of disinvestment in purpose-built rental building, and has therefore impacted the amount of rental stock in North Vancouver. While the amount of renters continues to increase, so must the supply of rental units that are suitable and affordable for those who need them. This creates an opportunity for inclusionary housing to provide more affordable units for buildings that need to be redeveloped due to their age. 4,000 3,669 3,500 Number of Rental Units Built 3,000 2,500 2,000 1,500 1,000 1,028 2, Year Figure 8 - Number of purpose-built rental units in the City of North Vancouver, Source: City of North Vancouver An important factor, as identified in the City of North Vancouver s 2015 Housing Profile, is to ensure that more affordable units are produced to support the workforce that allows the City of North Vancouver to be a thriving community. The needs identified provide a great opportunity for inclusionary housing to work and to help mitigate some of the challenges that the City of North Vancouver has been facing in terms of housing. By using the IHC to determine possible inclusionary housing policies that will help mitigate this need, the IHC can be an effective and important tool for the City to implement the policies that are needed to help balance the rental market and help provide homes for residents that are likely to be pushed out of the rental market otherwise. 18
22 The City depends on [moderate income] occupations to support the local economy; however, there is limited low end of market or affordable rentals to support the workforce. Housing is an important factor in the local economy - without attainable opportunities to live locally, investment in the local economy and the recruitment and retention of workers could be impacted. Affordable workforce rental housing is needed to achieve the City s goal of maintaining a complete community, where residents can live close to their place of work. City of North Vancouver Housing Profile, 2015 City Council Directive to Explore Inclusionary Housing In North Vancouver, the City plans to leverage the construction of below-market inclusionary units through a density bonus policy. A density bonus, as defined in the City s Official Community Plan, is an increase in permitted density, between the OCP Density and the Maximum Bonus Density, where additional public benefit is provided (City of North Vancouver, 2015). Currently, the City has a policy in place entitled Density Bonus and Community Benefits (Appendix C), in which specific density bonus guidelines are established, as identified in Schedule A of the Official Community Plan (Appendix D). This policy was endorsed in May of 2015, whereby it stated that, for rental developments, a portion of rental units must be rented at below market rates, and, for strata developments, 30 percent of the bonus amount must be non-market rental housing, or a community benefit cash contribution of $140 per square foot of the bonus amount. This policy structured how the creation of new amenities in the city is intended to help the impacts of development, but also to make the community more livable for the long term. As part of this report, City planning staff were directed to: Increase the amount of affordable and adequate accommodation for lower income households (including non-market housing) in an effort to meet the Metro Vancouver Housing Demand Estimates Prioritize the development and revitalization of affordable rental housing and use density bonusing and density transfers to incentivize the retention, renewal and/ or replacement of rental units as a public benefit (City of North Vancouver, 2016) Directives and directly correspond with the provision of inclusionary housing units, and thus form the basis of analysis for this report by using the Inclusionary Housing Calculator. The history of density bonusing and inclusionary housing in the City of North Vancouver is shown in the timeline in Figure 9 on the next page. 19
23 Council workshop for the introduction to density bonusing was provided to Mayor, Council and members of the public City s OCP introduces density bonusing as a way to achieve community benefits The City s Planning department reports back to Council on the results of the policy and amends City adopts revised Density Bonus and Community Amenity Policy to include Inclusionary Housing Policy SCARP student uses Inclusiony Housing Calculator to explore possible inclusionary housing policies Coriolis Corp produces report evaluating the density bonus system in the City 2015 City adopts first Density Bonus and Community Amenity Policy 2017 Inclusionary Housing Calculator Developed Figure 9 - The history of density bonusing at the City of North Vancouver 2018 Motion from Council to allow staff to explore expanding inclusionary housing policy to all new development today This history has led the City of North Vancouver to explore some of the more progressive nuances of inclusionary housing to determine the impacts on development when requiring that a percentage of the building is below-market rates. The IHC aids in this process to examine current market conditions and determine potential IH policy directives that still remain feasible, so that progressive approaches will still allow development to occur. While the current policy is to be considered inclusionary housing, this analysis aims to consider other percentages of inclusionary housing development and to determine their feasibility within the City of North Vancouver. Inclusionary housing policy in this context works within the density bonus policy, as discussed above. An amendment to the Density Bonus and Community Benefits Policy (hereinafter called the current policy) came into effect on January 1, 2018, stating that 10 percent of rental units must be developed as mid-market rental units, and increased the cash contribution for strata developments to $190 per square foot of the bonus amount. This policy is colloquially called , as it imposes that new market rental buildings seeking density bonus must be constructed with 10% of the building s units at 10% under CMHC average rents, for a 10 year time period. This policy outlines Community Benefit options in order to achieve density beyond outright zoning (and can be seen in Appendix C), through: i) Community Benefit Cash Contribution ii) Secured Rental Housing A) 100% Rental Housing B) Portion as Non-Market Housing C) Rental Retention iii) Employment Generating Use iv) Heritage Conservation 20
 in their respective zone, as outlined in Schedule A Land Use Map (Appendix D), as a supplement to the")
24 Although the policy can be applied through scenarios i - iv on the previous page, this report will only analyze scenario ii) Secured Rental Housing A) 100% Rental Housing. Each scenario was measured through the achievable maximum density Floor Space Ratio (FSR) in their respective zone, as outlined in Schedule A Land Use Map (Appendix D), as a supplement to the Official Community Plan. The zones are seen in Figure 10, which also display the maximum FSR allowable in these zones for the density bonus: The subsequent cases examine a series of adjustments with the Inclusionary Housing Calculator to the base case - the current policy in the City of North Vancouver. In most of the cases outlined below, developer profit is held constant at 15%, unless stated otherwise. As a result, any of the adjustments flow through to directly change the land lift incurred within the density bonus policy. Rental Building Analysis Firstly, a base case analysis was completed for the current allowable FSR (OCP Density). Further evaluation was undertaken with option ii) Secured Rental Housing A) 100% Rental Housing of the current policy, as previously discussed. This current policy evaluation, or the base case, was evaluated Figure 10 - Maximum densities within density bonus zones to understand the parameters of the policy for 100% rental buildings. Working within the current policy, the final inclusionary housing analysis was completed by making adjustments within the Input & Output sheet Inclusionary Adjustments section, and observing the results in the Inclusionary Feasibility - Rental section of the Inclusionary Housing Calculator, and then evaluated based on the parameters identified in the base case. A summary of the analyses are outlined below: Base Case: Option ii) A) 100% Rental Housing 10% of rental units must be mid-market rental units (10% below CMHC rates), secured for at least 10 years Case A, B, C, and D: Option ii) A) 100% Rental Housing adjustable percentage of rental units must be midmarket rental units, mid-market adjustable rental rates can be chosen as: percentage below CMHC rates percentage below BC Housing s Housing Income Limit (HILs) rates percentage of Annual Median Income (AMI) with an assumed 30% of AMI spent on housing 21
25 BASE CASE Current Policy Market-Specific Variables: Site size: 12,000 sq ft Construction Cost - Concrete: $230 per square foot (psf) Average market rental rate: $3.00 psf Required developer profit: 15% Cap rate: 4% Building efficiency: 87% Land Cost: $230 psf buildable Assumptions: Parking stalls per unit: 0.6 for rental and 1.05 for strata, valued at $40,000 per stall Homeowner, Warranty, and Insurance: $4,040 per unit Contingency: 6% of hard costs City of North Vancouver Development Cost Charges: Residential apartment - $62.17 per square metre Reduction: market rental unit - $31.09 per square metre Reduction: non-profit rental unit - $0 per square metre Metro Vancouver Development Cost Charges: Residential apartment - $807 per unit Reduction: market rental - $0 per unit Reduction: non-profit rental - $0 per unit GST: 5% Financing: 11.5% of hard costs Soft Costs: 30% of hard costs Property Purchase Tax: 5% CAC rate: $190 per square foot Municipal Permits: $100,000 Demolition: $200,000 Construction Management: 3.5% of construction costs Site Coverage: 50% The IHC shows the applicability of the current policy, as the rental policy still allows all development to be feasible within all density bonus zones with rents hovering at $3.00 per square foot, as seen in Figure 11. The current policy allows the construction of 3-6 units of inclusionary units per building (on a 12,000 square foot site) without impacting the feasibility of the development. This case means that 10% of the rental development would be allocated to inclusionary units with rents for these units at 10% below CMHC rents for the area, which in this case would be $1.82 per square foot. With the average size of a rental unit at 672 square feet (studio - three bedroom), this would mean an average rent for inclusionary units 22

26 BASE CASE Current Policy to be $1,223 per month, a low rate for this area. If this rate were to apply to a 1 bedroom unit of 555 square feet, for example, the rent would be $1,010; this is a savings of $988 per month for inclusionary units compared to market rent levels. Base Case: Market Conditions Average market rent psf: $3.00 Construction Cost psf: $230 Developer Profit: 15% Inclusionary Policy % of building as inclusionary units: 10% % below HILs rents: 10% Monthly Rent 1 Bedroom inclusionary rent: $1,010 Rent reduction from market rent: $988 Figure 11 - Base case variables and feasibility analysis 23
27 CASE A Minor shift in the current policy to A shift to a policy is still attainable through a marginal shift in the average rental rate to $3.08 per square foot. Current market rental rates, as per the Hollyburn Bridgewater at 175 West 14th St, are at $3.60 per square foot, so it is reasonable to assume similar rates in other new projects under current market conditions (Hollyburn Properties, 2017). This case means that 15% of the rental development would be allocated to inclusionary units with rents for these units at 15% below CMHC rents for the area, which in this case would be $1.72 per square foot. With the average size of a rental unit at 672 square feet (studio - three bedroom), this would mean an average rent for inclusionary units to be $1,155 per month, a very low rate for this area. If this rate were to apply to a 1 bedroom unit of 555 square feet, for example, the rent would be $954; this is a savings of $1,044 per month for inclusionary units compared to market rent levels. This policy would allow projects to still be feasible up to the maximum FSR allowable in all density bonus zones, and would result in a range of 5-9 inclusionary units for projects within each density bonus zone, as seen in the summary below, Figure 12. Case A: Market Conditions Average market rent psf: $3.28 Construction Cost psf: $250 Developer Profit: 15% Inclusionary Policy % of building as inclusionary units: 15% % below HILs rents: 15% Monthly Rent 1 Bedroom inclusionary rent: $954 Rent reduction from market rent: $1,044 Figure 12 - Case A variables and feasibility analysis In summary, a policy, whereby inclusionary units encompass 15% of the building s total units, at 15% below CMHC average rents, is attainable in all density bonus zones in the City of North Vancouver. This policy remains feasible even if construction costs were to increase by $20 psf from the base case, and average market rental rates for new units were even as low as $3.28, $0.32 lower than actual market conditions. Therefore, this policy is recommended as a suitable option for the City. 24
28 CASE B Substantial shift in the current policy to Raising the average market rental rates for new construction to $3.60 in the calculator allows the policy to reach a policy while remaining feasible, contributing inclusionary units on the same sized lot. It is important to note that inclusionary housing policy is only intended for new development, so a higher market rental rate is achievable, as discussed previously. This case means that 30% of the rental development would be allocated to inclusionary units with rents for these units at 30% below CMHC rents for the area, which in this case would be $1.42 per square foot. With the average size of a rental unit at 672 square feet, this would mean an average rent for inclusionary units to be $954 per month, an extremely low rate for this area. If this rate were to apply to a 1 bedroom unit of 555 square feet, for example, the rent would be $788. This is a savings of $1,210 per month for inclusionary units compared to market rent levels. This policy would allow projects to still be feasible up to the maximum FSR allowable in all density bonus zones, and would result in a range of inclusionary units for projects within each density bonus zone, as seen in the summary below, Figure 13. Case B: Market Conditions Average market rent psf: $3.60 Construction Cost psf: $240 Developer Profit: 15% Inclusionary Policy % of building as inclusionary units: 30% % below HILs rents: 30% Monthly Rent 1 Bedroom inclusionary rent: $788 Rent reduction from market rent: $1,210 Figure 13 - Case B variables and feasibility analysis In summary, a policy, whereby inclusionary units encompass 30% of the building s total units, at 30% below CMHC average rents, is attainable in all density bonus zones in the City of North Vancouver. This policy remains feasible even if construction costs were to increase by $10 psf from the base case, and average market rental rates stayed constant at $3.60 psf. Therefore, this policy is recommended as a suitable option for the City if it wishes to enact a progressive policy to ensure more affordability for more households. 25
29 CASE C Substantial shift in the current policy to Depending on the needs for the City, a different approach for inclusionary housing can be seen to house low-income families, whereby rents would be 50% lower than BC Housing Housing Income Limits (HILs) rates. This would mean that households would likely qualify for rent subsidies as well, furthering affordability for households in core housing need (more than 50% of income spent on housing costs). In this case, 25% of the development would be inclusionary units, and rents would be 50% below the HILs rate for the area, in this case, $0.96 per square foot. With the average size of a rental unit at 672 square feet, this would mean an average rent for inclusionary units to be $645 per month, an extraordinarily low rate for this area. If this rate were to apply to a 1 bedroom unit of 555 square feet, for example, the rent would be $532 per month. This is a savings of $1,466 per month for inclusionary units compared to market rent levels. This policy would allow projects to still be feasible up to the maximum FSR allowable in all density bonus zones, and would result in a range of 8-15 inclusionary units for projects within each density bonus zone, as seen in the summary below, Figure 14. Case C: Market Conditions Average market rent psf: $3.60 Construction Cost psf: $240 Developer Profit: 15% Inclusionary Policy % of building as inclusionary units: 25% % below HILs rents: 50% Monthly Rent 1 Bedroom inclusionary rent: $645 Rent reduction from market rent: $1,466 Figure 14 - Case C variables and feasibility analysis In summary, a policy, whereby inclusionary units encompass 25% of the building s total units, at 50% below BC Housing s HILs rates, is attainable in all density bonus zones in the City of North Vancouver. This policy remains feasible even if construction costs were to increase by $10 psf from the base case, and average market rental rates stayed constant at $3.60 psf. Therefore, this policy is recommended as a suitable option for the City if it wishes to enact a policy to ensure deeper affordability for lower-income households. 26
30 CASE D One-off developments to In this case, building a transitional or supportive housing development which houses individuals with extremely low incomes, as given by BC Housing s Shelter Assistance rates, is attainable. Since the mission for this type of building would be to house low-income individuals and families to help overcome homelessness, while the rest of the market units subsidize this lower revenue stream. In this scenario, the City could partner with a non-profit housing developer, and therefore remove some of the profit that is typically associated with housing development. If this were to happen, and only the developer s service costs of 5% were included as profit, the policy from Case C would now offer a reduction of 75% below BC Housing s Housing Income Limit rates to $0.48 per square foot. This scenario would mean a 1 bedroom unit would rent at $266 per month, which would be suitable for individuals even earning BC Housing s Shelter Assistance rate of $375 per month. This would require a different model of development, but is something that the City can consider as a one-off development should the housing need in the municipality for this type of development arise. This policy would allow projects to still be feasible up to the maximum FSR allowable in all density bonus zones, and would result in a range of 8-15 inclusionary units for projects within each density bonus zone, as seen in the summary below, Figure 15. Case D: Market Conditions Average market rent psf: $3.60 Construction Cost psf: $240 Developer Profit: 5% Inclusionary Policy % of building as inclusionary units: 25% % below HILs rents: 75% Monthly Rent 1 Bedroom inclusionary rent: $266 Rent reduction from market rent: $1,732 Figure 15 - Case D variables and feasibility analysis In summary, this one-off development scenario would not be a City-wide policy, but it is an interesting exploration of development options that becomes easy to understand by using the Inclusionary Housing Calculator. In this case, inclusionary units encompass 25% of the building s total units at 75% below BC Housing s HILs rates, and is attainable in all density bonus zones in the City of North Vancouver. This policy remains feasible even if construction costs were to increase by $10 psf from the base case, and average market rental rates stayed constant at $3.60 psf. Therefore, this development scenario is recommended as a suitable option for the City it wishes to partner with a non-profit developer to provide housing to very low-income individuals and families, should the situation arise in which the City needs a development such as this. 27
31 FUTURE CONSIDERATIONS By analyzing potential inclusionary policies, more information can be gleaned into the most applicable situation for the current market context. In the above rental analysis, Cases A - D showcase four feasible inclusionary housing policies for the City of North Vancouver. The City must consider how progressive or conservative they would like to be to be leaders in affordable housing development in Metro Vancouver, or if the rate of development continues to increase and therefore the rental rate in the city increases. Ultimately, the policy that seems like the most logical step forward is Case A, as it is the most conservative and is not as substantially different than the current policy. By considering Case A, developers would have more capacity to react to this change as it is more familiar. Although, the IHC shows the success of the current policy, but shows how it can be stretched further, with several, higher-yielding policies also being feasible in the city. If the City of North Vancouver wishes to enact a progressive policy, Case B is recommended, as it would provide the most inclusionary units and would make the biggest impact for what this policy is intended for - to provide more affordable units in the city. As market conditions change to reflect current rental rates, construction costs, and expenses, this policy must be checked to ensure development in the city is not halted. This can be done by adjusting the market conditions to reflect some ranges in contingency to ensure feasibility, and ensuring that this policy continues to be successful and to do what is intended in the future. The appeal of the IHC allows the City to make these kinds of adjustments in a relatively quick and easy-to-understand method. Further considerations for the City of North Vancouver are to also use the IHC to explore mixed-tenure buildings that have inclusionary units, as this analysis was out of the scope of this report. Finally, the City is looking towards the possibility of requiring all new developments to include inclusionary units, regardless if the development is seeking a density bonus or not. This type of progressive policy is encouraged and can be tested using the IHC to determine feasibility options. By enacting the current policy, and by considering more progressive approaches, the City of North Vancouver is well on its way to creating more affordable homes for its residents. 28
32 CONCLUSION To conclude, inclusionary housing is an important municipal method of creating affordable housing for all types of households. By providing more affordable and suitable units for lowerand middle-income residents, inclusionary housing can create more livable communities by creating a sustainable demographic and income mix, and helps households in need ease the burden of unaffordability. The inclusionary housing calculator can be instrumental in conceptualizing different inclusionary policies in each respective municipality, as it allows planning staff to understand the different adjustments that can be made to policies, and quickly evaluate the different market variables and assumptions that make certain policies feasible or not. In the City of North Vancouver context, four feasible inclusionary housing policy cases are outlined to provide a breadth of recommendations to the City, depending on its identified need and the directives of both the planning department and City Council. It is up to the City of North Vancouver to decide what is the best fit for inclusionary housing policy at this time, and to continue to approach the complexity of providing affordable housing through inclusionary housing policies. 29
33 REFERENCES BC Housing. (2018). HousingHub Building Partnerships to Build Homes. Retrieved at Bourne, L. (1981). The Geography of Housing. Retrieved from com/doi/epdf/ / Canada Mortgage and Housing Corporation. (2017). Rental Market Report, Vancouver CMA. Retrieved from A01.pdf?fr= &sid=Q0O0EZqBsoEQyX9aiVpZaobAlEner2YHbOKrOyQTow5SEYXpJ2ZIx86GsVoQXj8g Canada Mortgage and Housing Corporation. (2018). About Affordable Housing in Canada. Retrieved from City of North Vancouver. (2014). Official Community Plan - Community Directions. Retrieved from City of North Vancouver. (2015). Housing Profile City of North Vancouver Housing Action Plan. Retrieved from City of North Vancouver. (2018). Density Bonusing. Retrieved from city-services/planning-and-policies/housing Gladki, J and Pomeroy, S. (2007). Implementing Inclusionary Policy to Facilitate Affordable Housing Development in Ontario. Retrieved from Files/By%20Year/2007/Inclusionary%20Zoning%20to%20Facilitate%20Affordable%20 Housing% pdf Hulchanski, D. (2007). Canada s Dual Housing Policy: Assisting Owners, Neglecting Renters. Retrieved from B38Hulchanski.pdf Inclusionary Housing Canada. (2014). British Columbia Legislation. Retreived from inclusionaryhousing.ca/category/legislation-british-columbia/ InclusionaryHousing.Org. (2018). What is Inclusionary Housing?. Retrieved from Lincoln Institute of Land Policy. (2015). Inclusionary Housing: Creating and Maintaining Equitable Communities. Retrieved from
34 Mah, J. (2009). Can Inclusionary Zoning Help Address the Shortage of Affordable Housing in Toronto? Retrieved from Mah-Can-IZ-Help-2009.pdf Real Estate Board of Greater Vancouver. (2017). Monthly Statistical Reports. Retrieved from Richard Drdla Associates. (2016). National Housing Strategy: Inclusionary Zoning - Domestic & International Practices. Retrieved from cfm?cat=198&itm=51&lang=en&fr= Statistics Canada. (2007). Community Profile, North Vancouver City, Retrieved from cfm?lang=e&geo1=csd&code1= &geo2=pr&code2=59&data=count&search- Text=north%20vancouver&SearchType=Begins&SearchPR=01&B1=All&Custom= Statistics Canada. (2012). NHS Profile, North Vancouver City, Retrieved from www12.statcan.gc.ca/nhs-enm/2011/dp-pd/prof/details/page.cfm?lang=e&geo1=cs- D&Code1= &Data=Count&SearchText=north%20vancouver&SearchType=Begins&- SearchPR=01&A1=All&B1=All&Custom=&TABID=1 Statistics Canada. (2017). Census Profile, North Vancouver City, Retrieved from www12.statcan.gc.ca/census-recensement/2016/dp-pd/prof/details/page.cfm?lang=e&- Geo1=CSD&Code1= &Geo2=PR&Code2=59&Data=Count&SearchText=North%20Vancouver&SearchType=Begins&SearchPR=01&B1=All&GeoLevel=PR&GeoCode= &TABID=1 Urban Land Institute. (2016). The Economics of Inclusionary Development. Retrieved from

35 Appendix B - Inclusionary Housing Images Main page - Input & Output Input & Output - Variables


36 Input & Output - Inclusionary Feasibility Input & Output - Inclusionary Adjustments
37 Assumptions sheet

38 Rental Index sheet


39 Amended: July 17, 2017 Enactment: January 1, 2018 Document: v3
40 This document serves as a guide for the consideration of density bonuses and density transfers within the framework of the Official Community Plan (OCP) and Local Government Act. This document should be read in conjunction with the OCP and, in particular, Section 2.2 Density Bonusing, Section 2.3 Density Transfer, and the Schedule A Land Use Map. This guide is intended to provide a greater degree of certainty regarding the purpose and value of community benefit contributions that may occur in conjunction with development applications. Contributions of this nature help ensure that the City is able to provide amenities to meet the needs of our growing community. Category 'B' Bonus: Up to OCP Schedule 'A' Max. Bonus An increase in density that exceeds the OCP Schedule 'A' Densityup to the maximum bonus amount set out in the OCP. This type of bonus requires a rezoning, which may include a Town Hall meeting as well as a Public Hearing. Category 'A' Bonus: Up to OCP Schedule 'A' Density An increase in density that does not exceed the OCP Schedule 'A' Density. This can include lands that are pre-zoned with a density bonus, as well as lands that are rezoned through a site specific rezoning process with a density bonus. OCP Schedule 'A' Max. Bonus OCP Schedule 'A' Density Limit Outright Zoning Owners and applicants are reminded that OCP and rezoning applications are at Council s absolute discretion. While these guidelines provide a framework for determining Community Benefits related to rezoning applications, Council may reduce, increase or reject any application. Outright Zoning: The amount of density permitted on an outright basis in the Zoning Bylaw. The graphic to the right describes two types of density bonuses. Community Benefit options applicable to each of these bonus categories are outlined in Section 3 of this policy. Page 2 of 8 Document: v3

41 Choose one path or combine from the following options outlined below in order to achieve additional density beyond outright zoning: * In cases that Community Benefit Cash Contributions are waived, limited off-site improvements relating to safety to accommodate the density of development proposed may still be required as a condition of rezoning. ** While multiple pathways can be combined for full density bonus in most categories, this is not possible for 3(ii)(A): 100% Rental Housing. Page 3 of 8 Document: v3
42 A transfer of density is the relocation of anticipated density from one parcel of land to another. To achieve the goals and objectives outlined in this Plan and/or achieve a preferable form of development, City Council may authorize transfers of density between properties. Such transfers do not involve an increase in the total development potential, but rather the relocation of a density allowance. Density transfers require a rezoning with Public Hearing and, if approved, require that a Land Title Act covenant be registered on all affected properties confirming that the transfer has occurred. Density Transfers are appropriate in the following two scenarios: 1. Density Transfer donor site is adjacent or in close proximity (i.e., same block) as the receiving site and transfer will result in a preferable built form; and/or 2. Significant civic or public benefit will accrue from the Density Transfer (e.g., secured protection of a valued heritage site or provision towards an important civic facility). This policy should be read in conjunction with other City policies. Please note that: The Community Benefit Options outlined in Section 3 are intended as guidelines. Alternatives may be considered by Council in unique circumstances. This could include the provision of on-site Community Amenities rather than a contribution to an amenity fund, for example. On-site Community Amenities would be determined based on community needs and must match the value of the bonus density. Infrastructure upgrades needed to accommodate a development or mitigate development impacts may be required in addition to Community Benefit Cash Contributions or other Community Benefits. All development applications must provide bylaw-required infrastructure upgrades and contributions, Development Cost Charges, and other applicable municipal fees. Density bonus and community benefit contributions are not in lieu of what is otherwise due to the City. Public art is not funded by Community Benefit Cash Contributions and will be negotiated separately, in addition to the Community Benefit Options described above. Page 4 of 8 Document: v3
43 Community Benefits for OCP amendments are negotiated on a case by case basis considering the nature and extent of the change and community needs. Any application which involves the displacement of existing tenants must comply with Council Policy No. H18: Residential Tenant Displacement Policy. This policy does not apply to properties currently designated Residential Level 1 or Residential Level 2 in the Official Community Plan, except in relation to the opportunity to receive a density bonus in exchange for heritage conservation. Development proposals that are inconsistent with the Density Bonus and Community Benefits Policy will be reviewed by Council prior to processing of the application, and the proponent will be required to demonstrate: o That the requested deviation from the policy is warranted by unique circumstances; and o That other public benefits of equivalent value will be accrued (for example, a secured commitment to exceed the minimum term of affordability for Mid-Market Rental Units or to meet another Community Benefit priority) Cash contributions for Community Benefits are to be applied to the Civic Amenity Reserve Fund and Affordable Housing Reserve Fund. These funds are used to ensure a high quality of life as the community grows. These Funds specifically provide for the following Community Benefits: Civic Amenity Reserve Fund Contributions to this fund will be used to provide City-serving amenities, as per Bylaw No (Civic Amenity Reserve Fund). This includes, but is not limited to: Harry Jerome Community Recreation Centre; Waterfront Amenity Spaces; Park and public open space improvement; Child Care Facilities; Museum; Page 5 of 8 Document: v3
44 Greenways construction and improvements; Active transportation projects; Traffic safety improvements; and Other Civic Amenities. Affordable Housing Reserve Fund Contributions to this fund will be used for the provision of new nonmarket and special needs housing units, as per Bylaw No (Affordable Housing Reserve Fund). Community Benefit Cash Contributions shall generally be allocated as indicated in the table below. These funds shall be spent at Council s discretion as per the terms of the Bylaws establishing these funds, as amended from time to time. These funds shall be allocated to future projects based on identified community needs. Percentage Public Benefits Fund 80% Civic Facilities / Community Amenity Space Civic Amenity Reserve Fund 20% Affordable and Rental Housing Affordable Housing Reserve Fund In-kind contributions will be accepted, at the discretion of the City, in order to assure timely mitigation of additional density in a neighbourhood, when deemed appropriate. The Community Benefit Cash Contribution amounts shall be updated periodically to reflect community needs and changing market conditions. The allocation of Amenity Fund Contribution amounts to individual reserve funds will be reviewed annually in conjunction with the City s Financial Plan in order to ensure alignment with Council priorities. A summary of Community Benefit Cash Contributions received will be prepared and presented annually. Page 6 of 8 Document: v3
45 Commercial Floor Area means the square-footage measurement of commercial office or retail space in a building. Community Amenity is a defined physical space that provides direct or indirect Community Benefits to the community and includes, but is not limited to, recreation facilities, child care facilities, museum, library, offices for non-profit organizations, cultural facilities, heritage conservation, civic and institutional uses, district heating utility, community meeting space and employment-generating offices. Community Benefit Cash Contributions are the cash or in-kind contributions toward Community Benefits provided in return for a rezoning or OCP Amendment. Contributions are assumed to be in cash except as negotiated and at the direction of Council. Community Benefits are the wide range of benefits achieved in the public interest, to support the Goals and Objectives of the OCP. These are realized through amenity reserve fund contributions and/or through other Community Amenities. Community Benefits are achieved through rezoning or density bonusing. Density is the Floor Space Ratio that can be achieved on a parcel, as a calculation of gross floor area over site area. Density Bonus is additional density provided in return for Community Benefits. Density Transfer is the relocation of anticipated density from a donor site to a recipient site. Floor Space Ratio (FSR) is a method of calculating density and controlling the size of building that can be built on a property. The FSR multiplied by the lot area determines the maximum size of building. Land Use Designation means the permitted uses and densities as outlined in Schedule A of the Official Community Plan. Mid-Market Rental Units means dwelling units: (a) that are occupied by households that are low and moderate income renters, including the City's workforce; (b) that are set at 10% below Canada Mortgage and Housing Corporation average market rents for the City, based on unit type, and secured for a minimum period of 10 years; and Page 7 of 8 Document: v3
46 (c) in respect of which the registered owner or ground lessee of the freehold or leasehold title to the land on which the housing is situate has granted to the city a section 219 covenant, housing agreement, or other security for the housing commitments required by the city, registered against the freehold or leasehold title, with such priority of registration as the city may require; Non-Market Rental Housing means dwelling units: (a) that are occupied by households with incomes below housing income limits, as set out in the current Housing Income Limits table published by the British Columbia Housing Management Commission, or equivalent publication; (b) that are owned by a non-profit corporation, by a non-profit co-operative association, or by or on behalf of the city, the Province of British Columbia, or Canada; and (c) in respect of which the registered owner or ground lessee of the freehold or leasehold title to the land on which the housing is situate has granted to the city a section 219 covenant, housing agreement, or other security for the housing commitments required by the city, registered against the freehold or leasehold title, with such priority of registration as the city may require; Official Community Plan (OCP) is Bylaw No. 8400, one of the City's most significant guiding policy documents. The OCP sets a long-term vision for the City. All other municipal bylaws and works undertaken by the City must be consistent with the OCP. OCP Maximum Bonus means the highest Floor Space Ratio increase that can be achieved on a site (excluding density transfers) through a Category B Bonus, as per the OCP. All such density bonuses are subject to a rezoning and enhanced public process. OCP Schedule A Density means the density permitted for a given Land Use Designation in the OCP, under the Schedule A Land Use Map. The Density Bonus and Community Benefits Policy needs to be read in conjunction with the Schedule A Land Use Map to determine permitted maximum densities. Outright Zoning means the maximum Floor Space Ratio that can be realized on a site under existing zoning through a Building Permit without any density bonus or any rezoning of the lands for additional density. Rental Housing means dedicated purpose-built rental tenure residential units. Residential Floor Area means the total of market and non-market residential gross floor area. Secured means required and guaranteed through one or a combination of the following tools: zoning bylaw, Housing Agreement, Heritage Revitalization Agreement, covenant, or other legal tool. Page 8 of 8 Document: v3

47 - Mixed Use Residential Printed: Metres Approx. Storeys Example Height Equivalencies City Boundary Special Study Area # Maximum Building Heights in Metres Industrial Mixed Employment Commercial School & Institutional Parks, Recreation & Open Space Harbourside Waterfront 2.05 (Mixed Use) Mixed Use Level 4B (High Density) 3.0 Mixed Use Level 4A (High Density) 2.6 Mixed Use Level 3 (Medium Density) 2.3 Mixed Use Level 2 (Medium Density) 2.0 Mixed Use Level 1 (Low Density) 1.0 Residential Level 6 (High Density) 2.3 Residential Level 5 (Medium Density) 1.6 Residential Level 4B (Medium Density) 1.25 Residential Level 4A (Medium Density) 1.0 Residential Level 3 (Low Density) 0.75 Residential Level 2 (Low Density) 0.5 Residential Level 1 (Low Density) 0.5 Land Use Designation This map should be viewed in conjunction with the provisions of Sections 2.1 and 2.2 of Chapter 1 OCP Density (FSR) up to 0.15 up to 1.0 up to 1.0 up to 0.5 up to 0.5 up to 1.0 up to 1.0 Maximum Bonus (FSR) All residential development without maximum heights on this map shall not exceed six storeys. For other uses, heights shall be regulated through the Zoning Bylaw and in considering increases in building heights, attention will be given to view impacts, contextual relationships and the livability or use of the buildings. This map forms part of and is integral to the Official Community Plan. Land use designations extend from property boundary to the centerline of streets and lanes W ESPLANADE W 1ST HARBOURSIDE W 2ND LONSDALE FELL W 3RD AUTOMALL GOSTICK FORBES CHESTERFIELD 46 W 4TH SQUAMISH NATION W 5TH W 1ST W 6TH W KEITH W 3RD W KEITH W 13TH W 14TH MARINE DR HANES W 15TH BEWICKE FORBES W 16TH JONES MAHON W 17TH TOBRUCK W 17TH CHESTERFIELD W 18TH W 20TH W 19TH W 19TH MACKAY HAMILTON NELSON FELL WESTVIEW LARSON W 21ST W 21ST W 22ND W 23RD W 24TH TRANS CANADA HWY W 25TH WESTVIEW LARSON JONES MAHON W 28TH W 27TH W 26TH CHESTERFIELD W 29TH 68 ST GEORGE'S LONSDALE 25 E ESPLANADE ST PATRICK'S ST ANDREW'S ST GEORGE'S ALDER 4 storeys ST DAVID'S ST ANDREW'S E 1ST E 2ND 4 storeys 4 storeys E 3RD E 4TH E 5TH E 7TH E 6TH RIDGEWAY MOODY E KEITH E 8TH E 9TH E 10TH E 11TH E 12TH E 13TH E 14TH E 15TH E 16TH E 17TH RIDGEWAY MOODY E 18TH E 19TH E 20TH E 21ST E 22ND E 23RD E 24TH E 25TH E 26TH E 28TH E 27TH MAITLAND TEMPE SOMERSET LOW LEVEL QUEENSBURY GRAND BOULEVARD SUTHERLAND SUTHERLAND TEMPE KNOLL TEMPE GLEN HENDRY See Southeast View Southeast View N COTTON E 3RD E 4TH E 4TH E 5TH CLOVERLEY SHAVINGTON HEYWOOD BROOKSBANK Adopted March 23, 2015 Amended October 26, 2015 Amended July 11, 2016 Amended November 21, 2016 Amended April 3, 2017 Amended June 19, 2017 NOTES WILLIAM RUFUS RUFUS DR CEDAR VILLAGE CR Part of the Official Community Plan Schedule A Land Use
Housing. Imagine a Winnipeg...: Alternative Winnipeg Municipal Budget
 Housing Housing, and the need for affordable housing in cities and towns across Canada, has finally caught the attention of politicians. After a quarter century of urging from housing advocates, there
Subject. Date: 2016/10/25. Originator s file: CD.06.AFF. Chair and Members of Planning and Development Committee
 Date: 2016/10/25 Originator s file: To: Chair and Members of Planning and Development Committee CD.06.AFF From: Edward R. Sajecki, Commissioner of Planning and Building Meeting date: 2016/11/14 Subject
The Planning & Development Department and the Legal Services Division recommends that Council:
 CORPORATE REPORT NO: R066 COUNCIL DATE: April 9, 2018 REGULAR COUNCIL TO: Mayor & Council DATE: April 5, 2018 FROM: SUBJECT: General Manager, Planning & Development City Solicitor Surrey Affordable Housing
THAT Council receives for information the Report from the Planner II dated April 25, 2016 with respect to the annual Housing Report update.
 Report to Council Date: April 25, 2016 File: 1200-40 To: From: Subject: City Manager Laura Bentley, Planner II, Policy & Planning Annual Housing Report Update Recommendation: THAT Council receives for
SECURED MARKET RENTAL HOUSING POLICY NEW WESTMINSTER
 SECURED MARKET RENTAL HOUSING POLICY NEW WESTMINSTER May 13, 2013 City of New Westminster 511 Royal Avenue New Westminster, BC V3L 1H9 Contents A Secured Market Rental Housing Policy has been developed
/2016-Vol 01 Affordable Housing Strategy Update - Low End Market Rental Policy Information Backgrounder
 City of Richmond Report to Committee To: From: Re: Planning Committee Cathryn Volkering Carlile General Manager, Community Services Date: June 1, 2016 File: 08-4057 -01/2016-Vol 01 Affordable Housing Strategy
CITY OF RICHMOND AFFORDABLE HOUSING STRATEGY
 CITY OF RICHMOND AFFORDABLE HOUSING STRATEGY 2017 2027 ADOPTED MARCH 2018 City of Richmond Affordable Housing Strategy iii Summary The 2017 2027 City of Richmond Affordable Housing Strategy is the second
Mayor Darrell R. Mussatto and Members of Council ENHANCED NOTICE AND ASSISTANCE OPTIONS FOR TENANT DISPLACEMENT
 14, & \ li f&a Division Manager Director CAO The Corporation of THE CITY OF NORTH VANCOUVER COMMUNITY DEVELOPMENT DEPARTMENT REPORT To: From: SUBJECT: Mayor Darrell R. Mussatto and Members of Council Wendy
Document under Separate Cover Refer to LPS State of Housing
 Document under Separate Cover Refer to LPS5-17 216 State of Housing Contents Housing in Halton 1 Overview The Housing Continuum Halton s Housing Model 3 216 Income & Housing Costs 216 Indicator of Housing
WHERE WILL WE LIVE? ONTARIO S AFFORDABLE RENTAL HOUSING CRISIS
 WHERE WILL WE LIVE? ONTARIO S AFFORDABLE RENTAL HOUSING CRISIS 48% of Ontario renters make less than $40,000 a year. Nearly half of Ontario renters pay unaffordable rental housing costs. 46% of all renters
City of Winnipeg Housing Policy Implementation Plan
 The City of Winnipeg s updated housing policy is aligned around four major priorities. These priorities are highlighted below: 1. Targeted Development - Encourage new housing development that: a. Creates
Housing as an Investment Greater Toronto Area
 Housing as an Investment Greater Toronto Area Completed by: Will Dunning Inc. For: Trinity Diversified North America Limited February 2009 Housing as an Investment Greater Toronto Area Overview We are
Denver Comprehensive Housing Plan. Housing Advisory Committee Denver, CO August 3, 2017
 Denver Comprehensive Housing Plan Housing Advisory Committee Denver, CO August 3, 2017 Overview 1. Review of Comprehensive Housing Plan process 2. Overview of legislative and regulatory priorities 3. Overview
General Manager of Planning and Development Services in consultation with the Chief Housing Officer, and the General Manager of Community Services
 ADMINISTRATIVE REPORT Report Date: January 12, 2015 Contact: Abigail Bond Contact No.: 604.873.7670 RTS No.: 10823 VanRIMS No.: 08-2000-20 Meeting Date: January 20, 2015 TO: FROM: SUBJECT: Vancouver City
CITY OF SASKATOON COUNCIL POLICY
 ORIGIN/AUTHORITY Planning and Development Committee Report No. 26-1990; Legislation and Finance Committee Report No. 42-1990; City Commissioner s Report No. 29-1990, and further amendments up to and including
Subject: Affordable Housing Reserve Fund Policy Bylaw No. 3866, 2008
 For Council Our File: 10-5040-20/AFFHOU/2008-1 Doc #: 727285.v1 To: From: City Manager General Manager Planning and Development Subject: Affordable Housing Reserve Fund Policy Bylaw No. 3866, 2008 For:
Organizational Framework and Sustainable Funding Options for the Bowen Island Housing Corporation
 Organizational Framework and Sustainable Funding Options for the Bowen Island Housing Corporation Prepared for the Affordable Housing Working Group Bowen Island Municipality by Tim Wake Affordable Housing
MODERATE INCOME RENTAL HOUSING PILOT PROGRAM: APPLICATION PROCESS, PROJECT REQUIREMENTS AND AVAILABLE INCENTIVES
 PAGE 1 OF 10 Planning - By-law Administration Bulletins Planning and Development Services, 453 W. 12th Ave Vancouver, BC V5Y 1V4 Φ 604.873.7000 fax 604.873.7060 planning@vancouver.ca MODERATE INCOME RENTAL
Terms of Reference for Town of Caledon Housing Study
 1.0 Introduction Terms of Reference for Town of Caledon Housing Study The Town of Caledon is soliciting proposals for a comprehensive Housing Study. Results of this Housing Study will serve as a guiding
Housing Reset :: Creative Advisory Accelerating Non-Profit / City Partnerships What We Heard
 Final Version Date: Feb 8, 2017 Housing Reset :: Creative Advisory Accelerating Non-Profit / City Partnerships What We Heard Purpose This Creative Advisory was formed as part of the Housing Reset to generate
10 Affordable Housing Measuring and Monitoring Guidelines
 Clause 10 in Report No. 11 of Committee of the Whole was adopted, without amendment, by the Council of The Regional Municipality of York at its meeting held on June 25, 2015. 10 Affordable Housing Measuring
JOB DESCRIPTION MANAGEMENT EXCLUSION
 1. Position No. Various 2. Descriptive Working Title SENIOR DEVELOPMENT MANAGER JOB DESCRIPTION MANAGEMENT EXCLUSION 3. Present Classification Excluded Mgmt 4. Branch DEVELOPMENT AND ASSET 5. Department
Two-year Incentive Program
 URBAN DEVELOPMENT INSTITUTE PACIFIC REGION #200 602 West Hastings Street Vancouver BC V6B 1P2 Canada T. 604.669.9585 F. 604.689.8691 www.udi.bc.ca Below is a list of approaches the Province can use to
INCENTIVE POLICY FOR AFFORDABLE HOUSING
 INCENTIVE POLICY FOR AFFORDABLE HOUSING PREPARED BY: CITY OF FLAGSTAFF S HOUSING SECTION COMMUNITY DEVELOPMENT DIVISION OCTOBER 2009 2 1 1 W e s t A s p e n A v e. t e l e p h o n e : 9 2 8. 7 7 9. 7 6
Subject. Date: January 12, Chair and Members of Planning and Development Committee 2016/02/01
 Originator s files: Date: January 12, 2016 CD 06 AFF To: From: Chair and Members of Planning and Development Committee Edward R. Sajecki, Commissioner of Planning and Building Meeting date: 2016/02/01
Summary of Findings & Recommendations
 Summary of Findings & Recommendations Minneapolis/St. Paul Region Mixed Income Housing Feasibility, Education and Action Project Background In 2015 and 2016, the Family Housing Fund and the Urban Land
CITY OF VANCOUVER RENTAL HOUSING STRATEGY RESEARCH AND POLICY DEVELOPMENT SYNTHESIS REPORT FINAL
 CITY OF VANCOUVER RENTAL HOUSING STRATEGY RESEARCH AND POLICY DEVELOPMENT SYNTHESIS REPORT FINAL Prepared for: City of Vancouver Housing Policy Social Development Department Community Services Group Prepared
Housing Vancouver Strategy
 Housing Vancouver Strategy Presentation To City Council November 28, 2017 Housing Affordability - A City on the Edge 1 ecstaticist The Challenges Are Many and Complex 2 We Need to Do More to Keep Vancouver
Promoting Affordable Housing in Madison s Isthmus Neighborhoods
 Promoting Affordable Housing in Madison s Isthmus Neighborhoods Purpose: The purpose is to preserve income diversity in neighborhoods in the face of significantly rising housing costs. The objective is
Analysis of the Financial Viability of New Purpose- Built Rental Housing at Transit-Oriented Locations in Metro Vancouver
 Analysis of the Financial Viability of New Purpose- Built Rental Housing at Transit-Oriented Locations in Metro Vancouver Main Report August 2017 Prepared for: Metro Vancouver By: Table of Contents Summary...
HSC Regeneration Forum The Last Chapter First: Lessons Learned
 HSC Regeneration Forum The Last Chapter First: Lessons Learned May 28, 2012 Social Housing in B.C. BC Housing established in 1967 Growth in 50s, 60s and 70s purpose-built public housing Shift towards non-profit
Report Back to Council: Renter Protection Work Program
 Report Back to Council: Renter Protection Work Program Presentation Outline 1. Council Direction Priority for Renters 2. Challenges for Renters Across the Income Spectrum 3. Work to Date and Addressing
Affordable Home Ownership Exploring a Program for Vancouver
 Affordable Home Ownership Exploring a Program for Vancouver Housing Policy & Projects, CMO Council Report RTS 11038 April 20, 2016 Outline Council Policy & Direction Background What is Affordable Home
Submission on Bill 7, The Promoting Affordable. Housing Act. Standing Committee on Social Policy Legislative Assembly of Ontario.
 Submission on Bill 7, The Promoting Affordable Housing Act Standing Committee on Social Policy Legislative Assembly of Ontario November 22, 2016 For more information contact: Harvey Cooper Managing Director
Density Bonus Program Phase 2 City of New Westminster
 Bonus Program Phase 2 Downtown New Westminster Bonus Program Phase 2 City of New Westminster Presentation to the Urban Development Institute May 2, 2014 Michael Watson, Planning Technician, Barry Waitt,
CITY OF TORONTO. Response to the Provincial Inclusionary Zoning Consultation
 CITY OF TORONTO Response to the Provincial Inclusionary Zoning Consultation August 9, 2016 INTRODUCTION The introduction of the Promoting Affordable Housing Act, 2016 is a welcome step in providing the
Consultation on Increasing Housing Supply in Ontario: A guide for Ontario s co-op housing sector
 Consultation on Increasing Housing Supply in Ontario: A guide for Ontario s co-op housing sector The Government of Ontario is currently holding a consultation: Increasing Housing Supply in Ontario. CHF
Community Housing Federation of Victoria Inclusionary Zoning Position and Capability Statement
 Community Housing Federation of Victoria Inclusionary Zoning Position and Capability Statement December 2015 Introduction The Community Housing Federation of Victoria (CHFV) strongly supports the development
Affordable Housing Strategy: Draft Directions Report
 Attachment 1 Affordable Housing Strategy: Draft Directions Report Prepared by City of Guelph Planning, Urban Design and Building Services (December 2015) 1 2 Affordable Housing Strategy: Draft Directions
Financial Analysis of Urban Development Opportunities in the Fairfield and Gonzales Communities, Victoria BC
 Financial Analysis of Urban Development Opportunities in the Fairfield and Gonzales Communities, Victoria BC Draft 5 December 2016 Prepared for: City of Victoria By: Table of Contents Summary... i 1.0
Barbara County Housing Element. Table 5.1 Proposed Draft Housing Element Goals, Policies and Programs
 Table 5.1 Proposed Draft Housing Element Goals, Policies and Programs Goal 1: Enhance the Diversity, Quantity, and Quality of the Housing Supply Policy 1.1: Promote new housing opportunities adjacent to
Housing Issues Report Shoreline Towers Inc. Proposal 2313 & 2323 Lake Shore Boulevard West. Prepared by PMG Planning Consultants November 18, 2014
 Housing Issues Report Shoreline Towers Inc. Proposal 2313 & 2323 Lake Shore Boulevard West Prepared by PMG Planning Consultants November 18, 2014 PMG Planning Consultants Toronto, Canada M6A 1Y7 Tel. (416)
CHAPTER 8: HOUSING. Of these units, 2011 Census statistics indicate that 77% are owned and 23% are rental units.
 CHAPTER 8: HOUSING Port Moody has traditionally been a family oriented community. Based on the 2011 Census, 64% of all census families include children. Overall the number of dwelling units in Port Moody
A Tale of Two Canadas
 Centre for Urban and Community Studies Research Bulletin #2 August 2001 A Tale of Two Canadas Homeowners Getting Richer, Renters Getting Poorer Income and Wealth Trends in Toronto, Montreal and Vancouver,
Non-Profit Co-operative Housing: Working to Safeguard Canada s Affordable Housing Stock for Present and Future Generations
 Co-operative Housing Federation of Canada s submission to the 2009 Pre-Budget Consultations Non-Profit Co-operative Housing: Working to Safeguard Canada s Affordable Housing Stock for Present and Future
Companion Document Statement of Need
 Start with Home Tri-Cities Homelessness & Housing Task Group Companion Document Statement of Need Renewing Riverview Part A: Rental Housing Affordability & Need Analysis The charts, tables and text in
Redefining Affordable Housing in Toronto AFFORDABLE FOR WHO?
 Redefining Affordable Housing in Toronto AFFORDABLE FOR WHO? JULY 2018 Redefining Affordable Housing in Toronto Introduction Staggering rental costs in Toronto make it difficult for low-income individuals
Santa Barbara County In-Lieu Fee Update Report. Submitted to: The County of Santa Barbara. Submitted by: Bay Area Economics (BAE)
") Santa Barbara County In-Lieu Fee Update Report Submitted to: The County of Santa Barbara Submitted by: Bay Area Economics (BAE) June 2004 Table of Contents 1 Executive Summary...i 2 Introduction...1 2.1
Santa Barbara County In-Lieu Fee Update Report Submitted to: The County of Santa Barbara Submitted by: Bay Area Economics (BAE) June 2004 Table of Contents 1 Executive Summary...i 2 Introduction...1 2.1
Infill Housing Analysis
 City of Victoria Proposed Fairfield and Gonzales Neighbourhood Infill Housing Analysis Urbanics Consultants Ltd. Proposed Fairfield and Gonzales Neighbourhood Infill Housing Analysis Victoria, B.C. Prepared
New Opportunities in Rental Housing Financing
 CHRA CONGRESS SESSIONS SERIES 2017 New Opportunities in Rental Housing Financing With thanks to BC Housing for their generous support for this initiative May 2017 CANADIAN HOUSING AND RENEWAL ASSOCIATION
HOUSING ELEMENT OF THE CITY OF PEMBROKE PINES COMPREHENSIVE PLAN ADOPTION DOCUMENT
 HOUSING ELEMENT OF THE CITY OF PEMBROKE PINES COMPREHENSIVE PLAN RULES 9J-5.010, FAC City of Pembroke Pines, Florida ADOPTION DOCUMENT HOUSING ELEMENT HOUSING ELEMENT ADOPTION DOCUMENT VI. GOALS, OBJECTIVES
HOUSING ELEMENT GOAL, OBJECTIVES & POLICIES
 HOUSING ELEMENT GOAL, OBJECTIVES & POLICIES GOAL HO. HOUSING FOR THE PUBLIC. GOAL, OBJECTIVES & POLICIES It is the goal of the City of Casselberry to ensure an adequate supply of a wide range of housing
General Manager of Arts, Culture and Community Services
 ADMINISTRATIVE REPORT Report Date: July 10, 2018 Contact: Sandra Singh Contact No.: 604.871.6858 RTS No.: 12694 VanRIMS No.: 08-2000-20 Meeting Date: July 24, 2018 TO: FROM: SUBJECT: Vancouver City Council
Housing and Homelessness. City of Vancouver September 2010
 Housing and Homelessness City of Vancouver September 2010 1 Table of Contents Overview Key Housing Issues Homelessness Rental Housing Affordable Home Ownership Key Considerations 2 OVERVIEW 3 Overview
The South Australian Housing Trust Triennial Review to
 The South Australian Housing Trust Triennial Review 2013-14 to 2016-17 Purpose of the review The review of the South Australian Housing Trust (SAHT) reflects on the activities and performance of the SAHT
1. An adequate provision of affordable housing is a fundamental and critical feature of any strong, livable and healthy community.
 Strengthen Ontario s Provincial Policy Statement as one tool to meet the province s housing needs Submission by Wellesley Institute to PPS five-year review The Wellesley Institute believes that a strengthened
Policy No Adopted: October 9, Affordable Housing & Social Housing Policy, 2007
 Policy No. 13.2 Adopted: October 9, 2007 Affordable Housing & Social Housing Policy, 2007 1 Table of Contents TABLE OF CONTENTS 2 1.0 INTRODUCTION 4 1.1 THE NEED FOR AN AFFORDABLE HOUSING POLICY 4 1.2
A National Housing Action Plan: Effective, Straightforward Policy Prescriptions to Reduce Core Housing Need
 Co-operative Housing Federation of Canada s submission to the 2009 Consultations on Federal Housing and Homelessness Investments A National Housing Action Plan: Effective, Straightforward Policy Prescriptions
TRI-CITIES ANNUAL HOUSING AFFORDABILITY REPORT
 TRI-CITIES ANNUAL HOUSING AFFORDABILITY REPORT April 2013 Section 1: Housing Affordability Indicators Subject Page 1. Household Income 2 2. Housing Price Index 3 3. Affordable Incomes Ownership 4 4. Purpose-Built
City of Victoria Density Bonus Policy Study: For Sites Outside the Downtown Core Area
 City of Victoria Density Bonus Policy Study: For Sites Outside the Downtown Core Area Draft 5 March 2015 Prepared for: City of Victoria By: Coriolis Consulting Corp. Table of Contents Summary... i 1.0
CITY OF VANCOUVER ADMINISTRATIVE REPORT
 A11 CITY OF VANCOUVER ADMINISTRATIVE REPORT Report Date: September 28, 2006 Author: Cameron Gray Phone No.: 604.873.7207 RTS No.: 06245 VanRIMS No.: 11-2200-21 Meeting Date: October 17, 2006 TO: FROM:
Developing a Consumer-Run Housing Co-op in Hamilton: A Feasibility Study
 Developing a Consumer-Run Housing Co-op in Hamilton: EXECUTIVE SUMMARY December, 2006 Prepared for: Hamilton Addiction and Mental Health Network (HAMHN): c/o Mental Health Rights Coalition of Hamilton
COMMUNITY DEVELOPMENT DEPARTMENT
 AGENDA ITEM I-1 COMMUNITY DEVELOPMENT DEPARTMENT Council Meeting Date: June 3, 2014 Agenda Item #: I-1 INFORMATIONAL ITEM: Update on Multi-City Affordable Housing Nexus Study and Impact Fee Feasibility
Affordable Housing Advisory Committee Review of Recommendations. Planning and Development Department Community Development Division March 10, 2015
 Affordable Housing Advisory Committee Review of Recommendations Planning and Development Department Community Development Division March 10, 2015 History of the State Housing Initiatives Partnership Program
INCLUSIONARY HOUSING PROGRAM IMPLEMENTATION GUIDELINES
 INCLUSIONARY HOUSING PROGRAM IMPLEMENTATION GUIDELINES JULY 2005 Department of Grants & Community Investment 1110 West Capitol Avenue West Sacramento, CA 95691 Phone: (916) 617-4555 Fax: (916) 372-1584
The Honourable Peter Milczyn Minister of Housing/Minister Responsible for the Poverty Reduction Strategy College Park, 17th Floor
 February 2, 2018 Sent via e-mail: Bill.Mauro@ontario.ca Peter.Milczyn@ontario.ca The Honourable Bill Mauro Minister of Municipal Affairs College Park, 17th Floor 777 Bay Street Toronto, Ontario M5G 2E5
H o u s i n g N e e d i n E a s t K i n g C o u n t y
 1999 2000 2001 2002 2003 2004 2005 2006 2007 2008 2009 2010 Number of Affordable Units H o u s i n g N e e d i n E a s t K i n g C o u n t y HOUSING AFFORDABILITY Cities planning under the state s Growth
TOD and Equity. TOD Working Group. James Carras Carras Community Investment, Inc. August 7, 2015
 TOD and Equity TOD Working Group James Carras Carras Community Investment, Inc. August 7, 2015 What is Equitable TOD? Equity is fair and just inclusion. Equitable TOD is the precept that investments in
Housing Costs and Policies
 Housing Costs and Policies Presentation to Economic Society of Australia NSW Branch 19 May 2016 Peter Abelson Applied Economics Context and Acknowledgements Applied Economics P/L was commissioned by NSW
The rapidly rising price of single-family homes in. Change and Challenges East Austin's Affordable Housing Problem
 Change and Challenges East 's Affordable Housing Problem Harold D. Hunt and Clare Losey March 2, 2017 Publication 2161 The rapidly rising price of single-family homes in East has left homeownership out
Affordable Rental Housing in Chapel Hill Challenges and Opportunities. Presented to Mayor s Affordable Housing Task Force June 6, 2013
 Affordable Rental Housing in Chapel Hill Challenges and Opportunities Presented to Mayor s Affordable Housing Task Force June 6, 2013 1 Challenges High Barriers to Entry Land costs Entitlement costs Development
HOUSING NEEDS ASSSESSMENT
 HOUSING NEEDS ASSSESSMENT June 2018 TABLE OF CONTENTS EXECUTIVE SUMMARY... 2 INTRODUCTION... 3 VALUE IN PARTNERSHIPS... 4 DETERMINING AFFORDABILITY... 5 CURRENT HOUSING CONTEXT... 7 HOUSING PROVIDERS...
Rental Housing Strategy Study # 1
 Rental Housing Strategy Study # 1 Submitted to: City of Vancouver by: Will Dunning Inc November 2009 Table of Contents Table of Contents... 1 Part 1 Summary and Conclusions... 2 Introduction... 2 Housing
CULPEPER AFFORDABLE HOUSING NEEDS ASSESSMENT SUBMITTED TO VIRGINIA DEPARTMENT OF HOUSING AND COMMUNITY DEVELOPMENT JUNE 2013
 CULPEPER AFFORDABLE HOUSING NEEDS ASSESSMENT SUBMITTED TO VIRGINIA DEPARTMENT OF HOUSING AND COMMUNITY DEVELOPMENT JUNE 2013 Prepared by the Culpeper Affordable Housing Committee and Rappahannock-Rapidan
Federal Budget Pre-budget Submission: How best to use money for housing to stimulate the economy
 Federal Budget 2016-2017 Pre-budget Submission: How best to use money for housing to stimulate the economy February 2, 2016 John Dickie President Canadian Federation of Apartment Associations 640 1600
Metro Vancouver Purpose-Built Rental Housing Inventory and Risk Analysis. Profile for the District of West Vancouver
 Metro Vancouver Purpose-Built Rental Housing Inventory and Risk Analysis Profile for the District of West Vancouver May 2012 Prepared for: Metro Vancouver By: Coriolis Consulting Corp. Table of Contents
El Cerrito Affordable Housing Strategy City Council Presentation August 15, 2017
 El Cerrito Affordable Housing Strategy City Council Presentation August 15, 2017 1 Overview of Tonight s Agenda Project Overview Affordable Housing Strategies Closing 2 PROJECT OVERVIEW 3 What is the Affordable
Results of Short Term Incentives for Rental (STIR) Program Presentation to City Council March 27, 2012
 Program Presentation to City Council March 27, 2012") Results of Short Term Incentives for Rental (STIR) Program Presentation to City Council March 27, 2012 Presentation Outline Background and Objectives STIR Results Lessons 2 What is STIR? Council approved
Results of Short Term Incentives for Rental (STIR) Program Presentation to City Council March 27, 2012 Presentation Outline Background and Objectives STIR Results Lessons 2 What is STIR? Council approved
Housing and Economic Development Strategic Plan for Takoma Park OCTOBER 18, 2017
 Housing and Economic Development Strategic Plan for Takoma Park OCTOBER 18, 2017 1 Three Part Process Housing and Economic Data Analysis SWOT Analysis: Strengths, Weaknesses, Opportunities and Threats
Trends in Affordable Home Ownership in Calgary
 Trends in Affordable Home Ownership in Calgary 2006 July www.calgary.ca Call 3-1-1 PUBLISHING INFORMATION TITLE: AUTHOR: STATUS: TRENDS IN AFFORDABLE HOME OWNERSHIP CORPORATE ECONOMICS FINAL PRINTING DATE:
CITY CLERK. Consolidated Clause in Policy and Finance Committee Report 7, which was considered by City Council on July 19, 20, 21 and 26, 2005.
 CITY CLERK Consolidated Clause in Report 7, which was considered by City Council on July 19, 20, 21 and 26, 2005. 3 Regent Park Revitalization - Financial Strategy (Ward 28) City Council on July 19, 20,
COMPARISON OF THE LONG-TERM COST OF SHELTER ALLOWANCES AND NON-PROFIT HOUSING
 COMPARISON OF THE LONG-TERM COST OF SHELTER ALLOWANCES AND NON-PROFIT HOUSING Prepared for The Fair Rental Policy Organization of Ontario By Clayton Research Associates Limited October, 1993 EXECUTIVE
Incentives for Private-Sector Affordable Housing Development
 Incentives for Private-Sector Affordable Housing Development (City Council on November 23, 24 and 25, 1999, amended this Clause to provide that the report requested of the Commissioner of Community and
Glenmont Sector Plan Staff Draft AFFORDABLE HOUSING ANALYSIS
 Glenmont Sector Plan Staff Draft AFFORDABLE HOUSING ANALYSIS November 1, 2012 Center for Research and Information Systems Montgomery County Planning Department M NCPPC Executive Summary The Glenmont Sector
SERC 1 Housing Research Review
 SERC 1 Housing Research Review George Penfold, Carol Murray, Rebecca Pearson BC-Alberta Social Economy Research Alliance (BALTA) 2008 Symposium November 13-14, Vancouver, BC Presentation Themes Overview
REGIONAL HOUSING AFFORDABILITY STRATEGY. for the Capital Regional District
 2018 REGIONAL HOUSING AFFORDABILITY STRATEGY for the Capital Regional District TERRITORIAL ACKNOWLEDGEMENT Coast Salish and Nuu-chah-nulth peoples have lived on this territory since time immemorial. The
High Level Summary of Statistics Housing and Regeneration
 High Level Summary of Statistics Housing and Regeneration Housing market... 2 Tenure... 2 New housing supply... 3 House prices... 5 Quality... 7 Dampness, condensation and the Scottish Housing Quality
Glenmont Sector Plan Staff Draft AFFORDABLE HOUSING ANALYSIS
 Glenmont Sector Plan Staff Draft AFFORDABLE HOUSING ANALYSIS UPDATED December 4, 2012 Center for Research and Information Systems Montgomery County Planning Department M-NCPPC Executive Summary The Glenmont
Density Bonus and Community Benefits Policy
 Density Bonus and Community Benefits Policy Endorsed: May 25, 2015 1. Introduction This document serves as a guide for the consideration of density bonuses within the framework of the Official Community
Economic and Fiscal Impact Analysis of Future Station Transit Oriented Development
 Florida Department of Transportation Central Florida Commuter Rail Transit Project Economic and Fiscal Impact Analysis of Future Station Transit Oriented Development Seminole County Summary Report Revised
7/14/2016. Needed Housing. Workforce Housing. Planning for Needed Housing June 30, 2016 GOAL 10: HOUSING OAR (10)
") Needed Housing Planning for Needed Housing June 30, 2016 Damon Runberg, Oregon Employment Dept. Jim Long, City of Bend Affordable Housing Mgr. Tom Kemper, Housing Works Executive Director GOAL 10: HOUSING
Needed Housing Planning for Needed Housing June 30, 2016 Damon Runberg, Oregon Employment Dept. Jim Long, City of Bend Affordable Housing Mgr. Tom Kemper, Housing Works Executive Director GOAL 10: HOUSING
RE: Recommendations for Reforming Inclusionary Housing Policy
 Circulate San Diego 1111 6th Avenue, Suite 402 San Diego, CA 92101 Tel: 619-544-9255 Fax: 619-531-9255 www.circulatesd.org September 25, 2018 Chair Georgette Gomez Smart Growth and Land Use Committee City
R E Q U E S T F O R P R O P O S A L S
 P.O. Box 3209, Houghton, 2041 Block A, Riviera Office Park, 6-10 Riviera Road, Riviera R E Q U E S T F O R P R O P O S A L S M A R K E T S U R V E Y T O I N F O R M R E S I D E N T I A L H O U S I N G
2015 Housing Report. kelowna.ca. April Water Street Kelowna, BC V1Y 1J4 TEL FAX
 2015 Housing Report April 2016 1435 Water Street Kelowna, BC V1Y 1J4 TEL 250 469-8610 FAX 250 862-3349 ask@kelowna.ca kelowna.ca TABLE OF CONTENTS Introduction... 1 Housing Starts... 1 Ownership Housing
Standing Committee on Planning, Transportation and Environment
 POLICY REPORT SOCIAL DEVELOPMENT Report Date: December 3, 2015 Contact: Mukhtar Latif Contact No.: 604.871.6939 RTS No.: 10987 VanRIMS No.: 08-2000-20 Meeting Date: December 10, 2015 TO: FROM: SUBJECT:
The URD II Plan, for example, drafted in 1991 recognized both the need and opportunity for affordable housing development stating on page 49:
 PROPOSAL TO MISSOULA REDEVELOPMENT AGENCY FOR AFFORDABLE HOUSING PROGRAM The lack of inventory and inaccessibility to affordable housing in Missoula are longrecognized and well-documented problems. Too
The Corporation of the District of Central Saanich
 The Corporation of the District of Central Saanich COMMITTEE OF THE WHOLE REPORT For the Committee of the Whole meeting on November 28, 2016 To: Patrick Robins Chief Administrative Officer File: From:
HOUSING & NEIGHBORHOOD DEVELOPMENT
 HOUSING & NEIGHBORHOOD DEVELOPMENT A DIVISION OF COMMUNITY & NEIGHBORHOODS GROWING SLC: A 5 YEAR PLAN - SALES TAX PROPOSAL WHY HOUSING? 1 in 2 SLC residents are cost burdened and 1 in 4 is paying more
General Manager of Planning, Urban Design, and Sustainability in consultation with the Director of Legal Services
 POLICY REPORT DEVELOPMENT AND BUILDING Report Date: August 31, 2016 Contact: Anita Molaro Contact No.: 604.871.6489 RTS No.: 11651 VanRIMS No.: 08-2000-20 Meeting Date: October 18, 2016 TO: FROM: SUBJECT:
Affordable Housing Bonus Program. Public Questions and Answers - #2. January 26, 2016
 Affordable Housing Bonus Program Public Questions and Answers - #2 January 26, 2016 The following questions about the Affordable Housing Bonus Program were submitted by the public to the Planning Department