2018 IOWA STATE UNIVERSITY LAND VALUE SURVEY: OVERVIEW
|
|
|
- Eugenia Craig
- 5 years ago
- Views:
Transcription
1 2018 IOWA STATE UNIVERSITY LAND VALUE SURVEY: OVERVIEW Wendong Zhang Working Paper 18-WP 586 December 2018 Center for Agricultural and Rural Development Iowa State University Ames, Iowa Wendong Zhang is assistant professor in the Department of Economics, Iowa State University, Ames, Iowa. This publication is available online on the CARD website: Permission is granted to reproduce this information with appropriate attribution to the author and the Center for Agricultural and Rural Development, Iowa State University, Ames, Iowa Acknowledgements: The authors gratefully acknowledge the support from Lake Erie Commission and the NOAA/Ohio Sea Grant Program. For questions or comments about the contents of this paper, please contact Wendong Zhang, Iowa State University does not discriminate on the basis of race, color, age, ethnicity, religion, national origin, pregnancy, sexual orientation, gender identity, genetic information, sex, marital status, disability, or status as a U.S. veteran. Inquiries can be directed to the Interim Assistant Director of Equal Opportunity and Compliance, 3280 Beardshear Hall, (515)
2 2018 IOWA STATE UNIVERSITY LAND VALUE SURVEY: OVERVIEW Wendong Zhang Department of Economics, Center for Agricultural and Rural Development, and Iowa State University Extension and Outreach Iowa State University 478C Heady Hall, 518 Farmhouse Lane Ames, Iowa Cell: Phone: Abstract: Farmland represents over 80 percent of all U.S. farm assets, and is arguably often a farmer s single largest investment item, a major source of collateral, and a key component of the farmer s debt portfolio. Since 1950, the Iowa State University Land Value Survey has been the only data source that provides a county-level land value estimate for each of the 99 counties in Iowa. The 2018 Iowa State University Land Value Survey reported a 0.8 percent decrease to $7,264 per acre in average Iowa farmland values from November 2017 to November This modest drop is the fourth decline in Iowa farmland values over the past five years and represents a 17 percent decline from the 2013 peak in nominal land values, or a 24 percent drop in inflation-adjusted values. The recent decline is largely attributable to lower commodity prices, higher interest rates, and to some extent the trade disruptions. On the other hand, the magnitude of this decline is still very modest and overall the land market is largely stable. In general, the results from the 2018 Iowa State University Land Value Survey echo results from other surveys, which all showed relatively stable farmland market trends. Key Words: Land Values, Iowa, Land Ownership, Interest Rate, Farm Income, Ag Credit, Commodity Prices, Expert Opinion Survey JEL Codes: Q15, Q13, Q14, Q18 Citation suggestion: Zhang, W Iowa State University Land Value Survey: Overview. Iowa State University Extension and Outreach, CARD working paper #18-WP 586. Acknowledgement: The author gratefully acknowledges the support of all CARD staff, especially Karen Kovarik, Curtis Balmer, Nathan Cook, and Becky Olson. This paper also benefited significantly from data entry research assistance from Marcus Mandt and from feedback and discussions with Chad Hart, Mike Duffy, and ISU Extension and Outreach farm management specialists. I also want to thank the continuous and great assistance from several agricultural professional organizations, such as the ASFMRA Iowa Chapter, RLI Iowa Chapter, Iowa Bankers Association, and USDA Farm Service Agency. 1
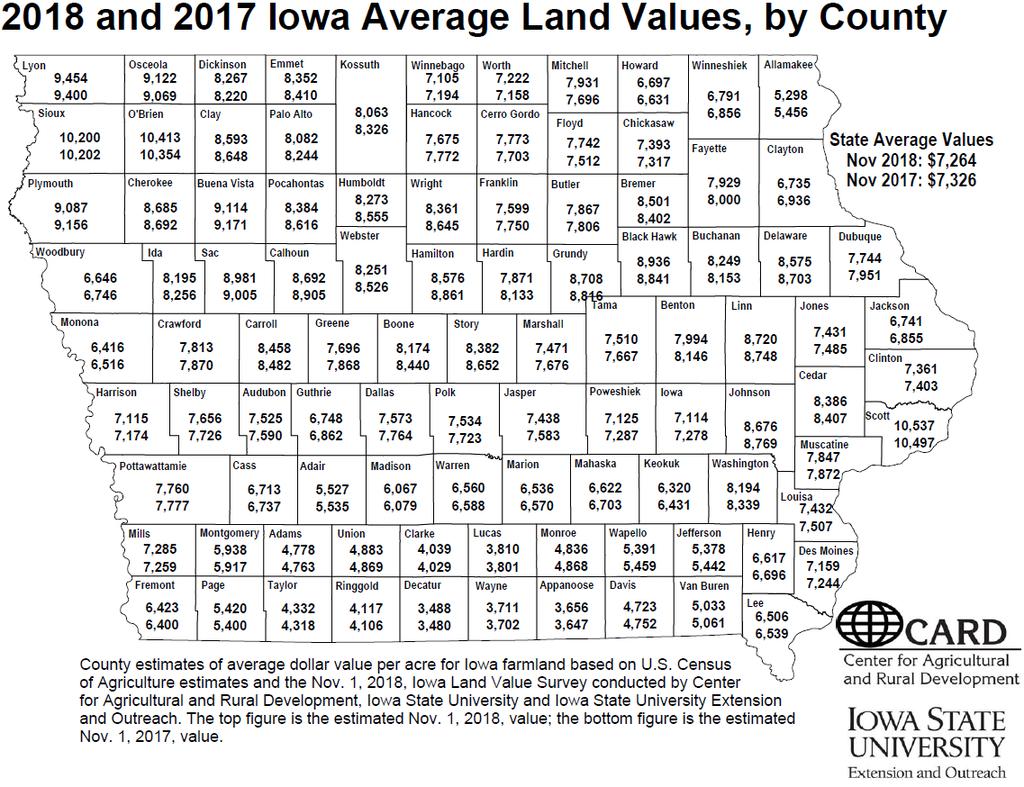
3 2018 IOWA STATE UNIVERSITY LAND VALUE SURVEY: OVERVIEW History and Purpose of the ISU Land Value Survey The survey was initiated in 1941 and is sponsored annually by Iowa State University. Only the state average and the district averages are based directly on ISU survey data. County estimates are derived using a procedure that combines ISU survey results with data from the U.S. Census of Agriculture. Since 2014, the survey has been conducted by the Center for Agricultural and Rural Development in the Department of Economics at Iowa State University and Iowa State University Extension and Outreach. The survey is intended to provide information on general land value trends, geographical land price relationships, and factors influencing the Iowa land market. The survey is not intended to provide a direct estimate for any particular piece of property. The survey is an expert opinion survey based on reports by licensed real estate brokers, farm managers, appraisers, agricultural lenders, county assessors, and selected individuals considered to be knowledgeable of land market conditions. Respondents were asked to report for more than one county if they were knowledgeable about the land markets. The 2018 ISU Land Value Survey is based on 792 usable county-level land value estimates provided by 605 agricultural professionals. Of the 605 respondents, 62 percent completed the survey online. Online responses allow participants to provide estimates for up to 15 counties. A new web portal has been developed this year to facilitate the visualization and analysis of Iowa farmland values by pooling data from ISU, USDA, Chicago Fed, and the Realtor Land Institute, as well as by making use of charts over time and interactive county maps. The portal can be accessed at Participants in the survey are asked to estimate the value of high-, medium-, and low-quality land in their county. Comparative sales and other factors are taken into account by the respondents in making these value estimates. This survey is the only data source that provides an annual land value estimate at the county level for each of the 99 counties in Iowa. In addition, this survey provides estimates of high-, medium-, and low-quality land at the crop reporting district and state level. Analysis by State The 2018 state average for all quality of land was estimated to be $7,264 per acre as of November 1, The state value declined $62 per acre from November The state value declined 0.8 percent from November December 11,
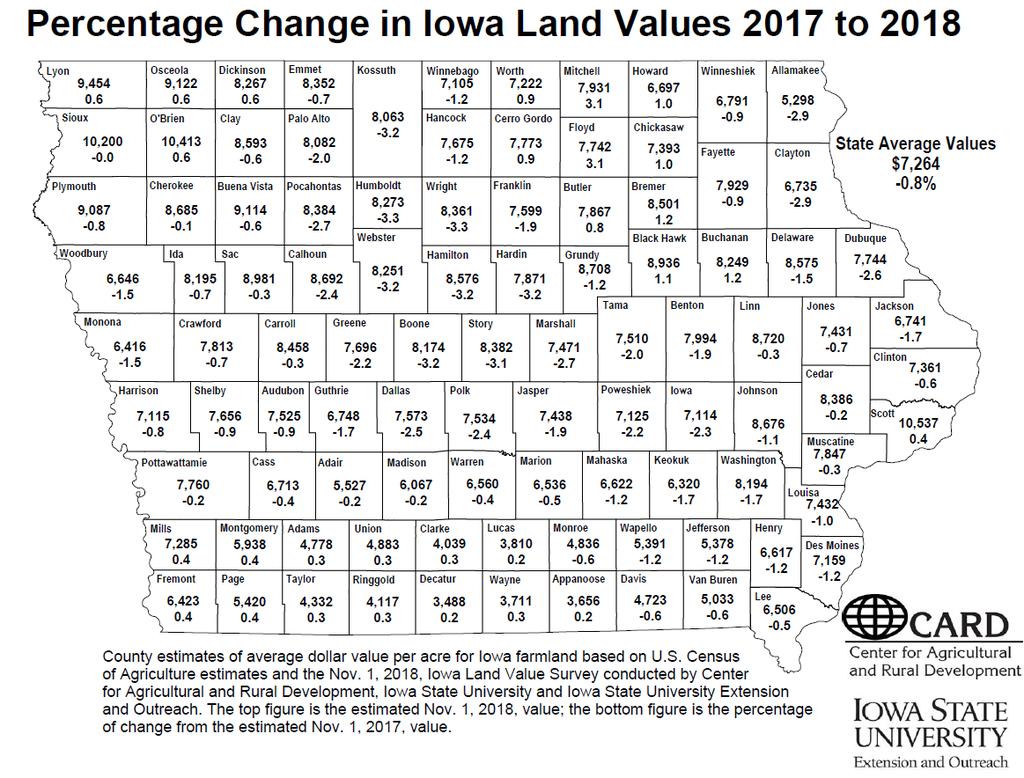
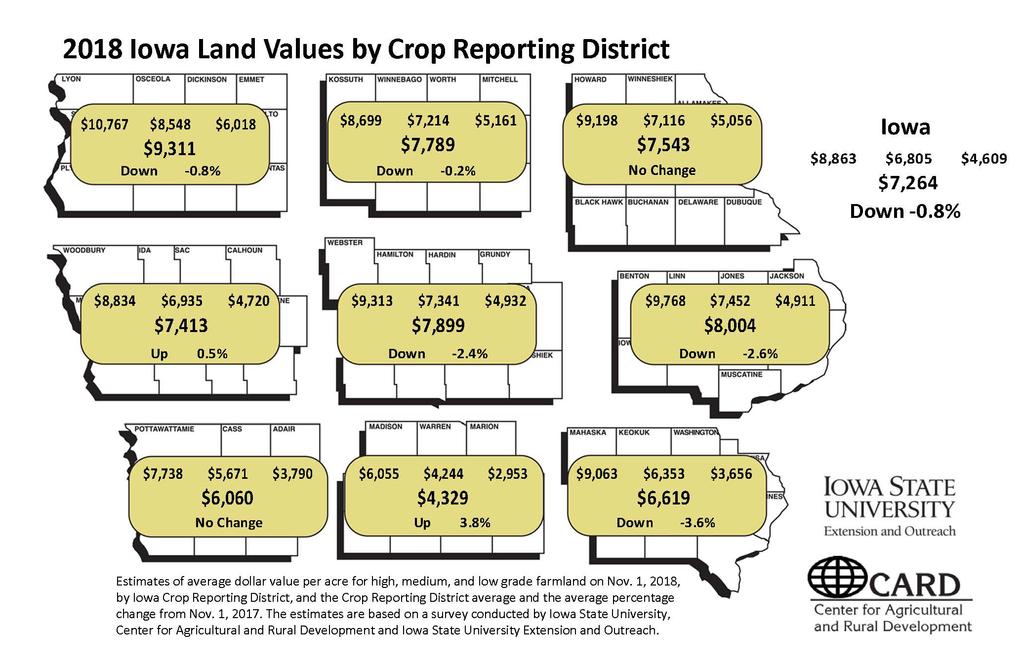
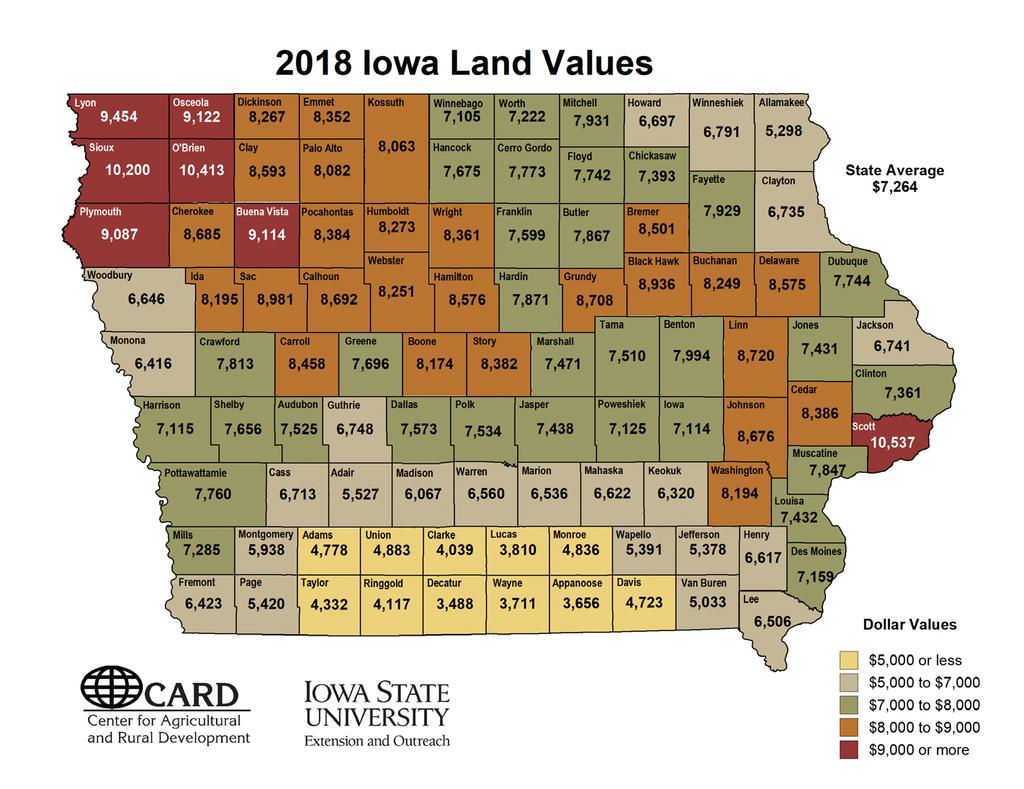
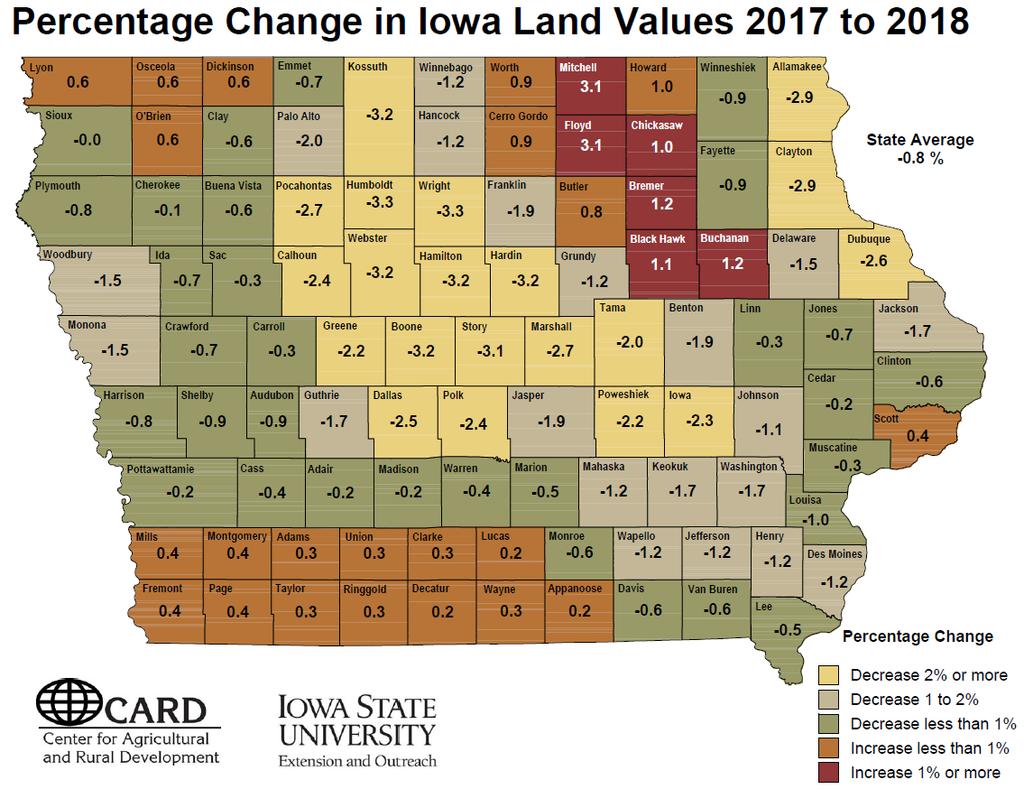
4 Analysis by Crop Reporting District The highest average land values were reported in Northwest Iowa, $9,311 per acre. The lowest average land values were reported in South Central Iowa, $4,329 per acre. Land values across crop reporting districts saw mixed results, with five of nine crop reporting districts showing an increase in land values. The largest percentage increase was in South Central Iowa, 3.8 percent, while Central Iowa and Southeast Iowa reported a 2.4 percent and 3.6 percent loss, respectively. The Northeast and Southwest districts reported no notable changes in value. Low-quality land in Northeast, West Central, and South Central Iowa saw increases, while lowquality land in Central, East Central, and Southwest Iowa experienced declines. Analysis by Counties The highest value was estimated for Scott County, $10,537 per acre. The lowest value was in Decatur County, $3,488 per acre. Seventy of 99 counties in Iowa reported a drop in land value, while the remaining 29 counties saw an increase. The largest percentage increase, 3.1 percent, was reported in both Floyd and Mitchell Counties. The largest dollar decrease was reported Hamilton County, $285 per acre. The highest percentage decrease (3.3 percent) was reported in Humboldt and Wright Counties. Analysis by Quality of Land Low-quality land statewide averaged $4,609 per acre, a 1.7 percent, or $61 per acre, decrease. Low-quality land in the Northeast, South Central, and West Central districts all saw increases, despite declines in other districts. Medium-quality land averaged $6,805 per acre, a decrease of 0.7 percent or $45 per acre. High-quality land averaged $8,863 per acre, a decrease of 0.8 percent or $70 per acre. Major Factors Influencing the Farmland Market Most survey respondents listed positive and/or negative factors influencing the land market. Of these respondents, 82 percent listed at least one positive factor, and 84 percent listed at least one negative factor. In most cases, respondents listed multiple factors. There were three positive factors listed by over 10 percent of respondents who provided at least one positive factor. The most frequently mentioned factor was limited land supply, mentioned by 23 percent of respondents. Strong yields and low interest rates were the second- and third-most frequently mentioned positive factors, mentioned by 13 and 12 percent of respondents, respectively. Other frequently mentioned positive factors included cash/credit availability (nine percent), strong demand (seven percent), and investor demand (six percent). There were two negative factors listed by more than 10 percent of respondents who identified at least one negative factor. The most frequently mentioned negative factor affecting land values was lower commodity prices, mentioned by 36 percent of respondents. Higher long-term interest rates were the second-most frequently mentioned negative factor, mentioned by 18 percent of respondents. Nine percent of respondents cited recent tariffs on U.S. soybeans and pork and other agricultural products, making it the third-most frequently mentioned negative factor. Cash/credit availability, higher input costs, an uncertain agricultural future, and weather were each mentioned by four to six percent of the respondents. 3
5 Number of Sales Compared to Previous Year Thirty-four percent of respondents reported lower sales in 2018 relative to one year ago. On the other end of the spectrum, just 28 percent reported more sales, and 38 percent reported the same level of sales in 2018 relative to Northwest Iowa has the lowest percentage of respondents who reported lower sales, 17 percent, while the Southwest, North Central, and West Central districts have the highest percentage of respondents who reported lower sales, with more than 40 percent each. Land Sales by Buyer Category The 2018 survey asked respondents what percent of the land was sold to five categories of buyers: existing local farmers, existing relocating farmers, new farmers, investors, or other. The majority of farmland sales, 72 percent, were to existing farmers, of which existing local farmers capture 69 percent of land sales and only three percent were to existing relocating farmers. Investors represented 21 percent of land sales. New farmers represented five percent of sales, and other purchasers were two percent of sales. Sales to existing local farmers by crop reporting district ranged from 75 percent in Northwest Iowa to 50 percent in South Central Iowa. Sales to investors were highest in South Central Iowa (30 percent). Northeast and East Central Iowa reported the lowest investor activity (15 percent). Land Sales by Seller Category The 2018 survey asked respondents what percent of land was bought from five categories of sellers: active farmers, retired farmers, estate sales, investors, or other. The majority of farmland sales, 52 percent, were from estate sales, followed by retired farmers at 23 percent. Active farmers account for 15 percent of sales, while investors accounted for eight percent. Estate sales by crop reporting district ranged from 64 percent in Northwest Iowa to 34 percent in South Central Iowa. Sales by investors were highest in South Central Iowa (19 percent). West Central Iowa reported the lowest investor sale activity (five percent). Respondents by Occupation and by Mode of Survey The 2018 survey asked the main occupation of the respondent: farm managers, appraisers, agricultural lenders, brokers/realtors, government, farmers/landowners, and other. This year s survey also asked about the number of years experience of respondents and number of counties they offer services in. In total, 624 agricultural professional completed the survey, providing 793 county land value estimates. Of these 624 respondents, agricultural lenders represented the largest group, accounting for 42 percent of all respondents. Realtors/brokers, farm managers, and appraisers were the next three largest groups, representing 17, 11, and 11 percent of respondents, respectively. Of all respondents, the percentage of agricultural lenders ranged from 34 percent in South Central to 54 percent in the Northeast district. Agricultural professionals on average have 25 years of experience in their current profession and offer professional services to an average of nine counties. While government officials typically only serve two counties at most, farm managers, appraisers, ag lenders, and realtors/brokers offer services to 9, 16, 4, and 15 counties, respectively. 4
6 The survey was completed online by 64 percent of the 624 respondents. Eighty percent of the respondents only provided land value estimates for their primary county. Eleven and four percent of the 624 respondents provided estimates for two and three counties, respectively. Farmland Value and Cash Crop Price Predictions by Respondents This year s survey asked respondents to predict land values and cash crop prices one and five years from now, as well as the prevailing interest rates for a 20-year farmland mortgage and a one-year operating loan. Respondents had mixed views regarding the strength of the farmland market one year from now, but in general expect higher land values five years from now. About half of respondents forecasted an increase in their local land market in one year, while 35 percent expected a lower land value, and 15 percent forecasted no change. Looking five years ahead, a vast majority of the respondents (81 percent) expect a higher land value than current levels, with only 11 percent forecasting a decline. Respondents expect a slow-but-steady improvement in both the corn and soybean cash crop markets. In particular, the predicted state average cash corn prices for November 2019 and 2023 (five years from now) are $3.51/bu and $4.10/bu, respectively. The statewide average soybean price predictions are $8.50/bu in one year and $9.79/bu five years from now. Respondents reported typical interest rates for 20-year farmland mortgages and one-year operating loans are 5.68 percent and 5.99 percent, respectively. Land Quality and Corn Suitability Rating 2 To gauge how each respondent defined high-, medium-, and low-quality land for their county, we asked for estimated average CSR2 (Corn Suitability Rating 2) for high-, medium-, and lowquality land. We also asked for estimates of the percent of land area for each land quality class. Results show that agricultural professionals have adapted to CSR2. Approximately 90 percent of participants provided at least one CSR2 estimate for the corresponding land quality classes. The estimated average CSR2 statewide for high-, medium-, and low-quality land is 82, 69, and 54 points respectively. The estimated percent of land area for high-, medium-, and low-quality land is 36, 40, and 24 percent, respectively. In addition, respondents ranked high-, medium-, and low-quality land based on relative conditions in their region. For example, the average CSR2 for high-quality land in the South Central district is 70, which is comparable to the CSR2 for low-quality land in the Northwest district (65). 5
7 Interpretation of the 2018 Survey Results The 2018 ISU Land Value Survey shows a 0.8 percent decrease in average Iowa farmland values from November 2017 to November The average statewide value of an acre of farmland is now estimated at $7,264. This modest drop is the fourth decline over the past five years and represents a 17 percent decrease from the 2013 peak in nominal land values, or a 24 percent drop in inflationadjusted values. The recent decline is largely attributable to lower commodity prices, higher interest rates, and to some extent the trade disruptions. The magnitude of the decline is still very modest and overall the land market is largely stable. Many respondents cited limited land supply, strong yields, and low interest rates as positive factors influencing the land market. Two-thirds of the respondents reported no change or less sales compared to a year ago. In general, the survey respondents have an optimistic view regarding the strength of the future land market both one and five years from now. The 2018 ISU Land Value Survey revealed a mixed land value pattern across crop reporting districts, counties and land quality classes. Local land supply and demand, as well as the local fluctuations in farm income largely explain the variation across the state. Five of nine crop reporting districts reported an increase in land values: the largest percentage increase was in South Central Iowa, 3.8 percent, while Central Iowa and Southeast Iowa reported a 2.4 percent and 3.6 percent loss, respectively. Seventy of 99 counties in Iowa reported a drop in land value, while the other 29 counties saw an increase. The largest percentage increase, 3.1 percent, was reported in both Floyd and Mitchell Counties, while the highest percentage decrease (3.3 percent) was reported in Humboldt and Wright Counties. In general, the results from the 2018 ISU Land Value Survey echo results from other surveys, which all showed relatively stable farmland market trends. In November 2017, the Federal Reserve Bank of Chicago reported a one percent decline in Iowa s good farmland values from July 1, 2018 to October 1, U.S. Department of Agriculture June Area Survey reported a 1.0 percent increase in Iowa s agricultural real estate values (land and building) from June 2017 to June In September, the Realtors Land Institute reported a 1.7 percent drop in Iowa cropland values from March 2018 to September 2018, which constitutes an overall 1.2 percent decline from September 2017 to September The 2018 ISU Land Value Survey shows that the majority of farmland sales, 72 percent, were to existing farmers. Investors represented 21 percent of land sales. Estate sales were still the main source of sales, followed by sales by retired farmers. The farmland value estimates from the ISU Land Value Survey are average land value estimates for all farmland in the county, which not only includes cropland, but also pasture, CRP, and timberland. Specifically, we asked respondents to estimate farmland value for average-sized farms in your county as of November 1, An opinion survey is just that. It represents the collective opinion of the survey respondents. Most of the respondents will use actual sales to formulate their opinions but each person can choose to weigh or discount particular sales as they deem necessary. The ISU Land Value Survey is an opinion survey, as are the surveys conducted by Federal Reserve Bank, USDA, and the Realtor Land Institute. It is important to consider the survey respondents, the questions asked, the time period covered, and other factors relating to a particular survey. As a result, it is important to note that when comparing results across surveys for Iowa and neighboring states, it is better to compare percentage change over time as opposed to dollar amount per acre. The ISU Land Value Survey is intended to provide information on general land value trends and geographical land price relationships and factors influencing the Iowa land market. The survey is not intended to provide a direct estimate for any particular piece of property. We recommend interested buyers or sellers hire an appraiser to conduct formal appraisal of particular parcel, go to county assessor websites, or examine recent auction results for comparable parcels in their region. 6
8 Outlook for Land Values in 2019 and Beyond The Iowa farmland market saw its fourth decline over the past five years. The estimated $7,264 per acre statewide average for all qualities of land in Iowa represents a 0.8 percent decrease in nominal land values from November If we examine the inflation-adjusted land values, this would represent a 3.3 percent decline from a year ago. This decline is likely a result of lower commodity prices, higher interest rates, and to some extent the trade disruptions. Considering the rising interest rates and declining commodity prices, the farmland market is holding up fairly remarkably, and overall, the land market across the state is relatively stable. According to USDA Economic Research Service s farm income forecast, U.S. net farm income is forecast to decrease $9.1 billion (12.1 percent) from 2017 levels to $66.3 billion in 2018, which will be about half off the 2013 peak level. In nominal terms, the $7,264 per acre value in 2018 represents a 17 percent loss off the peak land value of $8,716 in After adjusting for inflation with the Consumer Price Index (CPI), this represents a 24 percent loss off the 2013 peak. In other words, the inflation-adjusted farmland values have seen more erosion since Put simply, land value is the net present value of all discounted future income flows. With certain assumptions imposed, one could think of land value being net income divided by interest (discount) rate. To understand the changes in land value over time and across space, it is useful to examine how net income and interest rates will change over the next few years. Declining commodity prices, eroding farm income, and rising interest rates tend to exert downward pressures on land values. From this perspective, the recent decline is consistent with the reports on deteriorating farm income and agricultural conditions across the U.S. Midwest: one-third of the respondents to the 2018 ISU Land Value Survey cited lower commodity prices as the main negative factor impacting Iowa s farmland market over the past year. According to the November AgLetter report by the Federal Reserve Bank of Chicago, soybean prices were six percent lower than one year earlier, corn prices were two percent higher, and cattle, hog, and milk prices were down 3, 17, and 10 percent, respectively, across the seventh district in the third quarter of A unique stress this year on the agricultural economy is the recent disruptions in U.S. agricultural trade, especially the multiple rounds of tariff increases between the United States and China. A CARD policy brief examined the impacts of the trade disruptions on the Iowa economy, and revealed that the overall losses in Iowa s Gross State Product were between $1 and $2 billion. Iowa s Gross State Product is $190 billion. This mainly results from retaliatory tariffs from China on soybeans, pork, and other commodity products. In addition, the Federal Reserve continued to raise interest rates, putting more downward pressure on the farmland market. Most respondents reported the prevailing farmland loan rates to be around six percent as of November 2018, which is 0.75 to 1 percent higher than two years ago. Higher interest rates could put some upward pressure on producers financing costs and impact farm profitability, especially producers working capital. The Federal Reserve Bank of Kansas City reported that, according to bankers across the tenth district, a majority of crop producers in 2018 had a modest deterioration in their working capital. To put this recent, modest drop in Iowa land values into perspective, the current value of $7,264 per acre is still eight percent higher than 2011 values, and 63 percent higher than 10 years ago. Considering the downward pressures from both the declining farm income and rising interest rates, the farmland values in Iowa and across the Midwest are still remarkably stable. There are still multiple supply and demand factors that support the overall stabilization of the farmland market. First, the farmland market has always been a thin market with few farmland sales, but the past five years the farmland market has been extremely tight for five consecutive years, more respondents to the ISU Land Value Survey reported less sales in their county compared to the previous year. In this year s survey, only 28 percent of the respondents reported more sales activity, while 34 and 38 percent reported less or similar sales activities, respectively. The limited farmland supply helped buoy market prices in many areas across the state. Second, the new 2017 Iowa Farmland Ownership and Tenure Survey shows that 82 percent of all farmland in Iowa is fully paid for and 29 percent is owned primarily for family or sentimental reasons. This explains in part 7
9 the limited land sales offered by existing landowners and the strong demand noted as one of the positive factors in the 2018 ISU Land Value Survey. Third, the exceptional crop yields in 2018 helped reduce production costs on a per-bushel basis and alleviate the downward pressures on farm profits and land values. In November 2018, USDA forecasted corn yields of 198 bushels per acre and soybean yields of 58 bushels per acre. Even though this is revised lower compared to one month ago, the last six corn crops are still the largest the United States has ever produced, and a projected record national soybean yield will boost soybean production above 4.5 billion bushels for the first time (Schulz and Hart 2018). Fourth, despite recent hikes, interest rates remain below the recent historical average and well below pre-recession levels. From 2006 to 2014, farm real estate loan rates fell nearly 300 basis points. The recent hikes were only about 100 basis points since Lower interest rates kept the increase in interest expenses at modest levels and supported farm profitability. Finally, the 2018 ISU Cost of Production estimates reveal that estimated average cost for corn and soybean production in Iowa dipped further to $3.60/bu and $9.46/bu, respectively. Despite continued declines in commodity prices, the corresponding drop in production costs have resulted in breakeven or positive production margins for many producers this year, which has a positive impact on farm income and asset values. Across the nine crop reporting districts and 99 counties, land value patterns were localized and mixed, driven by changes in local land supply and demand. While land values could be thought of as net income divided by interest rates, net income tends to be localized while interest rates are more universal. Five of nine crop reporting districts reported an increase in land values, and seventy of 99 counties in Iowa reported a drop in land value. For example, the strong demand by livestock producers for top quality grounds is behind the continued increases in counties like Sioux and O Brien, and the stronger recreational demand due to improved general economy help explain the hikes in low-quality land in South Central and Northeast Iowa. The favorable weather conditions and much stronger crop yields compared to last year also drove up the farmland values in South Central Iowa in general. The 2018 ISU Land Value Survey shows that 69 percent of farmland sales were to existing local farmers, and they typically only look for land sales near their farm or at least in the same county. Due to the limited land supply, this suggests that local conditions of the land market, especially the availability of land sales in a certain quality class or the competitiveness of the land market in general, explain the variations in land value patterns across districts, counties, and land quality classes. Across the Corn Belt and Great Plains, the land market saw mixed signals yet remained relatively stable in general. Many neighboring states also experienced declines in land values recently, but the magnitude was almost all fairly modest. The Illinois Society of Professional Farm Managers and Rural Appraisers and University of Illinois reported in March 2018 that there were persistent land value declines in all land qualities from January 2017 to January In particular, there was a two percent decline in excellent quality land, a one percent decline in good quality land, a five percent decrease in average quality land, and a six percent decrease in fair quality land in Illinois. The March 2018 Nebraska report indicated the average market value of farmland declined by three percent compared to one year earlier. The February 2018 Minnesota report showed statewide farmland sales prices declined by eight percent. The land value survey conducted by Purdue University reported a 1.6 percent, 2.1 percent, and 2.4 percent increase for Indiana s statewide top-, medium-, and low-quality farmland values from June 2017 to June 2018; however, their report also showed minor declines from January to June The quarterly AgLetter report by the Chicago Federal Reserve Bank issued in November 2018 indicated a one percent decline in Illinois for the period of October 1, 2017 to October 1, 2018, and a one percent increase in Iowa and Indiana and a four percent increase in Wisconsin. The quarterly Ag Credit survey conducted by the Kansas City Federal Reserve Bank published in November 2018 revealed that non-irrigated farmland values across the seventh district, which includes Nebraska, Kansas, and western Missouri, decreased two percent from one year ago. The fourth decline over the past five years in the land market might trigger panic and memories of the 1980s farm crisis. Stress on farm finances also contributed to an increase in the expected sale of mid- to long-term assets in The number of bankers expecting farm borrowers to sell assets to improve available working capital or make loan payments increased sharply from a year ago. In fact, 8
10 the Federal Reserve Bank of Kansas City reported that nearly 85 percent of bankers reported farm borrowers plan to sell mid- to long-term assets before year s end, up from about 75 percent a year ago. However, I would argue that despite the growing financial stress across the Midwest over the past few years, we are unlikely to see a replay of the 1980s farm crisis marked by the sudden, precipitous collapse of the U.S. agricultural land market and mounting delinquent farm loans and foreclosures. This somewhat optimistic outlook mainly stems from the strong farm income growth from 2003 to 2013, the historically low interest rate environment, and more prudent agricultural lending practices (Zhang and Tidgren 2018). In addition, our analysis suggests that the trajectory of the current farm downturn will likely be gradual like that of the 1920s farm crisis, as opposed to the sudden collapse of the 1980s farm crisis. The stabilization in the land market offered our respondents optimism and confidence in the future farmland market, especially in the medium term, despite growing farm financial stress. Half of the respondents to the 2018 ISU Land Value Survey forecasted an increase in their local land market in one year, while 35 percent expect a lower land value, and 15 percent forecast no change in one year. Looking at the land market five years from now, a vast majority of respondents (81 percent) expect a higher land value than current levels, with only 11 percent forecasting a decline. This is consistent with their corn and soybean price forecast, which is a slow-but-steady improvement in both the corn and soybean cash crop markets. The Ag Economy Barometer led by Purdue University, a nationwide monthly agricultural producer survey, showed that compared to one year ago and even one quarter ago, farmers pessimism about farmland values subsided, with only 22 percent of respondents from the November survey expecting to see lower farmland values in the upcoming year and half of farmers expecting farmland values to move higher over the next five years. Farmland sale activities tend to be correlated with changes in land values with the current farm downturn, landowners tend to continue to hold land parcels and postpone sales, which results in a continuation of less farmland sales. With the continued decline in farm income and profitability, some existing landowners may reconsider retirement and sell their land eventually. The heightening farm financial stress is already putting pressure on some vulnerable producers to liquidate some of their assets. To the extent that this will lead to more land parcels on the market, which is not much given the current tight market, there could be additional downward pressure on the farmland market. Many agricultural professionals have noticed an uptick in the number of land auctions across the state this year. According to the 2017 Iowa Farmland Ownership and Tenure Survey, half of Iowa s farmland has been held by the same owner for more than 20 years. As a result, a large influx of farmland supply is not likely, but this potential rise in farmland sale activity and continued decline in farmland values might present opportunities for beginning farmers and ranchers to enter the market. Farmland has historically been a fairly robust investment that generates relatively stable returns. Since 1941, the nominal and inflation-adjusted Iowa farmland values have averaged a 6.4 percent and 2.6 percent increase per year, respectively. Farmland values have increased 72 percent of years, decreased 27 percent of years, and remained unchanged for three years between 1910 and While 29 percent of farmland in Iowa is primarily owned for family or sentimental reasons, the strong robust returns for farmland have and will continue to attract interested farmers and investors to invest in the farmland market. There are several unique uncertainties worth watching over the next year or two. First, it remains unclear how quickly and by how much the Federal Reserve will raise interest rates. Higher interest rates tend to put further downward pressures on producers working capital, farm income, and land values. Second, it is still highly uncertain how the trade negotiations and disputes with China will turn out, and because China was one of the most important buyers for key agricultural commodities such as soybeans, the impacts of trade disruptions on farm income and land values will likely be significant. It is worth noting that it takes time for the land market to fully capitalize the income shocks resulting from the trade disruptions. The 2019 land values will reflect more of the trade disruptions impacts than current market values. Third, the agricultural sector is closely watching 9
11 possible policy changes, especially whether and when we will have a new Farm Bill and details on commodity and conservation programs. Fourth, it is critical to watch whether the improved farm income and land market lead to landowners growing interest in selling land, or more stressed sales from financially stressed producers. Across the Midwest, there are signs of deteriorating agricultural credit conditions and a continued, prolonged downturn in the agricultural economy, although with a much slower pace. This recent decline in the Iowa farmland market is a result of lower commodity prices and higher interest expenses. Given the rising interest rates and still-high uncertainty regarding U.S. agricultural trade, the land market in Iowa might see another modest decline next year despite an overall stabilizing trend. 10
12 Table 1. Recent Changes in Iowa Farmland Values, Value Per Acre Dollar Change % Change Value Per Acre Dollar Change % Change Table 2. Iowa Farmland Values and Percentage Change by District and Land Quality as of November 2018 District Average Value % Change High Quality % Change Medium Quality % Change Low Quality % Change Northwest $9, % $10, % $8, % $6, % North Central $7, % $8, % $7, % $5, % Northeast $7, % $9, % $7, % $5, % West Central $7, % $8, % $6, % $4, % Central $7, % $9, % $7, % $4, % East Central $8, % $9, % $7, % $4, % Southwest $6, % $7, % $5, % $3, % South Central $4, % $6, % $4, % $2, % Southeast $6, % $9, % $6, % $3, % STATE (avg) $7, % $8, % $6, % $4, % 11
13 Table 3. Iowa Farmland Values by Crop Reporting District and Quality of Land, Year State Avg Northwest North Central Northeast West Central 12 Central East Central Southwest South Central Southeast All Quality High Quality Medium Quality Low Quality
14 Table 4. Level of Sales Activity, 2018 More Less Same (Percent) Northwest North Central Northeast West Central Central East Central Southwest South Central Southeast STATE Table 5. Iowa Land Purchases by Buyer Type, 2018 Existing Local Farmers Existing Relocating Farmers New Farmers Investors Other (Percent) Northwest North Central Northeast West Central Central East Central Southwest South Central Southeast STATE
15 Table 6. Iowa Land Purchases by Seller Type, 2018 Active Farmers Retired Farmers Estate Sales Investors Other (Percent) Northwest North Central Northeast West Central Central East Central Southwest South Central Southeast STATE Table 7. Survey Respondents and Responses by Mode, 2018 (Some respondents report on more than one county) Paper Online Responses Paper Online Respondents (Percent) (Percent) Northwest North Central Northeast West Central Central East Central Southwest South Central Southeast STATE
16 Table 8. Survey Respondents by Occupation, 2018 Farm manager Appraiser Ag lender (Percent) Broker/ Realtor Farmer/ Landowner Government Other Northwest North Central Northeast West Central Central East Central Southwest South Central Southeast STATE Table 9. Experience and Service Area by District and Respondent Occupation, 2018 Crop reporting district Years of experience Number of counties served Occupation Years of experience Number of counties served Northwest 27 6 Farm manager 23 9 North Central 29 7 Appraiser Northeast 21 7 Ag lender 22 4 West Central Brokers/Realtor Central Farmer/Landowner 42 5 East Central 24 6 Government 21 2 Southwest 26 5 Other 26 4 South Central Southeast 25 8 STATE 25 9 STATE
17 Table 10. Predicted Percent Change in Local Land Value One Year Later decrease 10 percent or more decrease 5-10 percent decrease 3-5 percent decrease less than 3 percent increase 5 percent or less increase 5-10 percent increase more than 10 percent no change (Percent) Northwest North Central Northeast West Central Central East Central Southwest South Central Southeast STATE Table 11. Predicted Percent Change in Local Land Value Five Years Later decrease 10 percent or more decrease 5-10 percent decrease less than 5 percent increase 5 percent or less increase 5-10 percent increase percent increase more than 20 percent no change (Percent) Northwest North Central Northeast West Central Central East Central Southwest South Central Southeast STATE Table 12. Iowa Cash Crop Price Predictions for November 2018 and 2023 Cash Corn Prices Cash Soybean Prices One Year Later Five Years Later One Year Later Five Years Later Northwest $3.44 $4.00 $8.36 $9.55 North Central $3.49 $4.11 $8.58 $9.94 Northeast $3.46 $4.16 $8.57 $9.92 West Central $3.44 $4.00 $8.36 $9.55 Central $3.45 $4.05 $8.55 $9.90 East Central $3.61 $4.11 $8.79 $10.04 Southwest $3.55 $4.05 $8.44 $9.64 South Central $3.64 $4.17 $8.29 $9.65 Southeast $3.47 $4.25 $8.43 $9.79 STATE $3.51 $4.10 $8.50 $
18 Table 13. Estimated Average CSR2 and Percent of Land Area by Land Quality, 2018 High Quality Reported Average CSR2 Medium Quality Low Quality High Quality Reported Percent of Land Area Medium Quality Northwest North Central Northeast West Central Central East Central Southwest South Central Southeast STATE Table 14. Estimated Average Mortgage and Operating Loan Rate 20-Year Farmland Mortgage Interest Rates (Percent) Low Quality 1-Year Operating Loan Northwest North Central Northeast West Central Central East Central Southwest South Central Southeast STATE
19 Comparative Iowa Land Values By Crop Reporting District: County Name $/acre $/acre $ change % change District Name $/acre $/acre $ change % change Harrison $ 7,115 $ 7,174 -$ % Northwest $ 9,311 $ 9,388 -$77-0.8% Henry $ 6,617 $ 6,696 -$ % North Central $ 7,789 $ 7,802 -$13-0.2% Howard $ 6,697 $ 6,631 $ % Northeast $ 7,543 $ 7,543 $0 0.0% Humboldt $ 8,273 $ 8,555 -$ % West Central $ 7,413 $ 7,377 $36 0.5% Ida $ 8,195 $ 8,256 -$ % Central $ 7,899 $ 8,097 -$ % Iowa $ 7,114 $ 7,278 -$ % East Central $ 8,004 $ 8,218 -$ % Jackson $ 6,741 $ 6,855 -$ % Southwest $ 6,060 $ 6,058 $3 0.0% Jasper $ 7,438 $ 7,583 -$ % South Central $ 4,329 $ 4,172 $ % Jefferson $ 5,378 $ 5,442 -$ % Southeast $ 6,619 $ 6,864 -$ % Johnson $ 8,676 $ 8,769 -$ % State Average $ 7,264 $ 7,326 -$62-0.8% Jones $ 7,431 $ 7,485 -$ % Keokuk $ 6,320 $ 6,431 -$ % By County: Kossuth $ 8,063 $ 8,326 -$ % Lee $ 6,506 $ 6,539 -$ % County Name $/acre $/acre $ change % change Linn $ 8,720 $ 8,748 -$ % Adair $ 5,527 $ 5,535 -$9-0.16% Louisa $ 7,432 $ 7,507 -$ % Adams $ 4,778 $ 4,763 $ % Lucas $ 3,810 $ 3,801 $9 0.24% Allamakee $ 5,298 $ 5,456 -$ % Lyon $ 9,454 $ 9,400 $ % Appanoose $ 3,656 $ 3,647 $9 0.24% Madison $ 6,067 $ 6,079 -$ % Audubon $ 7,525 $ 7,590 -$ % Mahaska $ 6,622 $ 6,703 -$ % Benton $ 7,994 $ 8,146 -$ % Marion $ 6,536 $ 6,570 -$ % Black Hawk $ 8,936 $ 8,841 $ % Marshall $ 7,471 $ 7,676 -$ % Boone $ 8,174 $ 8,440 -$ % Mills $ 7,285 $ 7,259 $ % Bremer $ 8,501 $ 8,402 $ % Mitchell $ 7,931 $ 7,696 $ % Buchanan $ 8,249 $ 8,153 $ % Monona $ 6,416 $ 6,516 -$ % Buena Vista $ 9,114 $ 9,171 -$ % Monroe $ 4,836 $ 4,868 -$ % Butler $ 7,867 $ 7,806 $ % Montgomery $ 5,938 $ 5,917 $ % Calhoun $ 8,692 $ 8,905 -$ % Muscatine $ 7,847 $ 7,872 -$ % Carroll $ 8,458 $ 8,482 -$ % O'Brien $ 10,413 $ 10,354 $ % Cass $ 6,713 $ 6,737 -$ % Osceola $ 9,122 $ 9,069 $ % Cedar $ 8,386 $ 8,407 -$ % Page $ 5,420 $ 5,400 $ % Cerro Gordo $ 7,773 $ 7,703 $ % Palo Alto $ 8,082 $ 8,244 -$ % Cherokee $ 8,685 $ 8,692 -$6-0.07% Plymouth $ 9,087 $ 9,156 -$ % Chickasaw $ 7,393 $ 7,317 $ % Pocahontas $ 8,384 $ 8,616 -$ % Clarke $ 4,039 $ 4,029 $ % Polk $ 7,534 $ 7,723 -$ % Clay $ 8,593 $ 8,648 -$ % Pottawattamie $ 7,760 $ 7,777 -$ % Clayton $ 6,735 $ 6,936 -$ % Poweshiek $ 7,125 $ 7,287 -$ % Clinton $ 7,361 $ 7,403 -$ % Ringgold $ 4,117 $ 4,106 $ % Crawford $ 7,813 $ 7,870 -$ % Sac $ 8,981 $ 9,005 -$ % Dallas $ 7,573 $ 7,764 -$ % Scott $ 10,537 $ 10,497 $ % Davis $ 4,723 $ 4,752 -$ % Shelby $ 7,656 $ 7,726 -$ % Decatur $ 3,488 $ 3,480 $8 0.24% Sioux $ 10,200 $ 10,202 -$2-0.02% Delaware $ 8,575 $ 8,703 -$ % Story $ 8,382 $ 8,652 -$ % Des Moines $ 7,159 $ 7,244 -$ % Tama $ 7,510 $ 7,667 -$ % Dickinson $ 8,267 $ 8,220 $ % Taylor $ 4,332 $ 4,318 $ % Dubuque $ 7,744 $ 7,951 -$ % Union $ 4,883 $ 4,869 $ % Emmet $ 8,352 $ 8,410 -$ % Van Buren $ 5,033 $ 5,061 -$ % Fayette $ 7,929 $ 8,000 -$ % Wapello $ 5,391 $ 5,459 -$ % Floyd $ 7,742 $ 7,512 $ % Warren $ 6,560 $ 6,588 -$ % Franklin $ 7,599 $ 7,750 -$ % Washington $ 8,194 $ 8,339 -$ % Fremont $ 6,423 $ 6,400 $ % Wayne $ 3,711 $ 3,702 $9 0.24% Greene $ 7,696 $ 7,868 -$ % Webster $ 8,251 $ 8,526 -$ % Grundy $ 8,708 $ 8,816 -$ % Winnebago $ 7,105 $ 7,194 -$ % Guthrie $ 6,748 $ 6,862 -$ % Winneshiek $ 6,791 $ 6,856 -$ % Hamilton $ 8,576 $ 8,861 -$ % Woodbury $ 6,646 $ 6,746 -$ % Hancock $ 7,675 $ 7,772 -$ % Worth $ 7,222 $ 7,158 $ % Hardin $ 7,871 $ 8,133 -$ % Wright $ 8,361 $ 8,645 -$ % 18
20
21 20
22 21
23 22
24 23
25 Iowa Nominal and Inflation-adjusted Average Value per Acre of Iowa Farmland, Nominal and Real Land Values ($/acre) $10,000 $9,000 $8,000 $7,000 $6,000 $5,000 $4,000 $3,000 $2,000 $1,000 Nominal Iowa land values Inflation-adjusted Iowa land values (2015 Dollars) $- Annual Percentage Change in Nominal Iowa Farmland Values, % 30.% Annual Percentage Change (%) 20.% 10.% 0.% -10.% -20.% -30.% -40.%
26 Iowa Farmland Sale Activity, Percent of Respondents More Less Same Iowa farmland sale activity index, Percent Change in Land Value 40.0% 30.0% 20.0% 10.0% 0.0% -10.0% -20.0% Farmland Sale Activity Index Percent_Change Index Benchmark 25
27 Buyers of Iowa Farmland, Percent of Land Existing Farmers Investors New Farmers Other 26
You spoke and we listened - 63 meetings/2,346 participants
 Farm Leasing Arrangements Tim Eggers Field Agricultural Economist teggers@iastate.edu 712-542-5171 www.extension.iastate.edu/feci You spoke and we listened - 63 meetings/2,346 participants Participants
2011 Farmland Value Survey The survey was initiated in 1941 and is sponsored
 File C2-70 January 2012 www.extension.iastate.edu/agdm 2011 Farmland Value Survey The survey was initiated in 1941 and is sponsored annually by the Iowa Agriculture and Home Economics Experiment Station,
The Goal? FARMLAND LEASING ARRANGEMENTS AND LAND VALUES 8/15/2017. Let s get familiar with your Farmland Leasing Arrangements book!
 FARMLAND LEASING ARRANGEMENTS AND LAND VALUES Melissa O Rourke B.S., M.A., J.D. FARM & AGRIBUSINESS MANAGEMENT SPECIALIST Housed at ISU Extension Winneshiek County in Decorah www.extension.iastate.edu/agdm
PURDUE AGRICULTURAL ECONOMICS REPORT SEPTEMBER 2000
 PURDUE AGRICULTURAL ECONOMICS REPORT SEPTEMBER T he Purdue Land Values Survey indicates that the value of an acre of average bare Indiana cropland was $2,173 per acre in June. This was $81 more than the
Agricultural. Credit Conditions. Farmland Values and Farm Income Soar. Burgeoning farm profits accelerated District cropland and ranchland value gains
 SURVEY of TENTH DISTRICT Agricultural Credit Conditions S4 te hp tqeuma br te er r 22 1 FF ee dd ee rraall RReesseerrvvee BBa annk k o of f KKa an ns sa as s C Ci ti ty y Farmland Values and Farm Income
The Current Situation on Farmland Values and Ownership Michael Duffy
 The Current Situation on Farmland Values and Ownership Michael Duffy Abstract: Robust farm incomes have spurred farmland values to their strongest levels since the 1970s. Despite strong farmer and investor
Farmland Ownership and Tenure in Iowa 2007
 Farmland Ownership and Tenure in Iowa 2007 PM 1983 Revised November 2008 Prepared by Michael Duffy, Professor of Economics and Extension Farm Management Specialist, and Darnell Smith, Extension Farm Management
Spring Educational Seminar
 Spring Educational Seminar Iowa Chapter REALTORS Land Institute Land Trends & Values Press Release RLI Land Trends and Values Committee Chairperson Kyle J. Hansen, ALC Hertz Real Estate Services, Nevada,
Iowa Midwest USA Operator Landlords 20, % 107, ,044
 Who buys and rents Iowa s farmland? Wendong Zhang, Assistant Professor of Economics, Iowa State University, wdzhang@iastate.edu [Prepared for Proceedings of 2015 Integrated Crop Management Conference]
Return to Iowa farmland versus S&P 500
 Economics Working Papers (2002 2016) Economics 3-5-2012 Return to Iowa farmland versus S&P 500 Michael Duffy Iowa State University, mduffy@iastate.edu Follow this and additional works at: http://lib.dr.iastate.edu/econ_las_workingpapers
IOWA FARMLAND OWNERSHIP & TENURE : A FIFTEEN-YEAR PERSPECTIVE
 JANUARY 2000 IOWA FARMLAND OWNERSHIP & TENURE 1982-1997: A FIFTEEN-YEAR PERSPECTIVE CHARLES A. PIEPER, RESEARCH ASSISTANT, DEPARTMENT OF ECONOMICS AND NEIL E. HARL, CHARLES F. CURTISS DISTINGUISHED PROFESSOR
Dale Lattz Farmdoc Research Associate at the University of Illinois College of ACES
 Dale Lattz Farmdoc Research Associate at the University of Illinois College of ACES Outlook for Illinois Land Prices and Cash Rents Evolving Dynamics Dale Lattz University of Illinois dlattz@illinois.edu
Farmland Ownership and Tenure in Iowa 2012
 Farmland Ownership and Tenure in Iowa 2012 PM 1983 Revised January 2014 Prepared by Michael Duffy, professor of economics and extension economist Ann Johanns, extension program specialist... and justice
Housing Price Forecasts. Illinois and Chicago PMSA, May 2018
 Housing Price Forecasts Illinois and Chicago PMSA, May 2018 Presented To Illinois Realtors From R E A L Regional Economics Applications Laboratory, Institute of Government and Public Affairs University
Indiana Farmland Values and Cash Rents Continue Downward Adjustments
 Indiana Farmland Values and Cash Rents Continue Downward Adjustments Michael Langemeier, Professor, Center for Commercial Agriculture James Mintert, Professor, Center for Commercial Agriculture Indiana
Housing Price Forecasts. Illinois and Chicago PMSA, January 2018
 Housing Price Forecasts Illinois and Chicago PMSA, January 2018 Presented To Illinois Realtors From R E A L Regional Economics Applications Laboratory, Institute of Government and Public Affairs University
Who Owns, Rents and Buys Farmland Today. Speaker: Dr. Wendong Zhang, Iowa State University Moderator: Dr. LeeAnn Moss, AcreValue
 Who Owns, Rents and Buys Farmland Today Speaker: Dr. Wendong Zhang, Iowa State University Moderator: Dr. LeeAnn Moss, AcreValue Our Speakers Today Featured Guest: Dr. Wendong Zhang, Iowa State University
AGRICULTURAL Finance Monitor
 n Fourth Quarter AGRICULTURAL Finance Monitor Selected Quotes from Banker Respondents Across the Eighth Federal Reserve District Cattle prices have negatively affected overall income for. One large land-owning
Comparing the Stock Market and Iowa Land Values: A Question of Timing Michael Duffy ISU Department of Economics
 Comparing the Stock Market and Iowa Land Values: A Question of Timing Michael Duffy ISU Department of Economics This paper is an update of earlier versions. The purpose of the paper is to examine the question;
The 2018 Land Market Survey
 The 2018 Land Market Survey REALTORS Land Institute National Association ofrealtors Released in January 2019 President s Message As the 2018-2019 National President of the REALTORS Land Institute (RLI),
Land Quality Perceptions in Expert Opinion Surveys: Evidence from Iowa
 Land Quality Perceptions in Expert Opinion Surveys: Evidence from Iowa Wendong Zhang and Michael D. Duffy Working Paper 17-WP 574 January 2017 Center for Agricultural and Rural Development Iowa State University
The Bears Control the 2015 Indiana Farmland Market Craig L. Dobbins, Professor and Kim Cook, Research Associate
 P a g e 1 August 2015 CONTENTS The Bears Control the 2015 Indiana Farmland Market... 1 Indiana Pasture Land, Irrigated Farmland, Hay Ground, and On-Farm Grain Storage Rent... 9 Is Farmland Still an Attractive
ECONOMIC CURRENTS. Vol. 4, Issue 3. THE Introduction SOUTH FLORIDA ECONOMIC QUARTERLY
 ECONOMIC CURRENTS THE Introduction SOUTH FLORIDA ECONOMIC QUARTERLY Vol. 4, Issue 3 Economic Currents provides an overview of the South Florida regional economy. The report presents current employment,
Housing Price Forecasts. Illinois and Chicago PMSA, March 2018
 Housing Price Forecasts Illinois and Chicago PMSA, March 2018 Presented To Illinois Realtors From R E A L Regional Economics Applications Laboratory, Institute of Government and Public Affairs University
Who Buys and Rents Iowa s Farmland
 Who Buys and Rents Iowa s Farmland Dr. Wendong Zhang Assistant Professor of Economics and Extension Economist 2015 Integrated Crop Management Conference, Iowa State University, Ames, IA A Quick Introduction:
Housing and Economy Market Trends
 Housing and Economy Market Trends Mainstreet Organization Prices of single-family, detached homes in suburban Chicago increased 12.1 percent in May 2014 compared with the same period a year ago. Overall,
mmrma BIMONTHLY PUBLICATION OF THE FARM MANAGEMENT STAFF Indiana Land Prices and Cash Rents J. H. Atkinson, Professo; of Agricultural Economics.
 .. g - ~- mmrma BIMONTHLY PUBLICATION OF THE FARM MANAGEMENT STAFF - G. A. HARRISON & J. H. ATKINSON, EDITORS August, 1978 AGRICULTURAL ECONOMICS DEPARTMENT. PURDUE UNIVERSITY '- Indiana Land Prices and
Nothing Draws a Crowd Like a Crowd: The Outlook for Home Sales
 APRIL 2018 Nothing Draws a Crowd Like a Crowd: The Outlook for Home Sales The U.S. economy posted strong growth with fourth quarter 2017 Real Gross Domestic Product (real GDP) growth revised upwards to
Housing Price Forecasts. Illinois and Chicago PMSA, April 2018
 Housing Price Forecasts Illinois and Chicago PMSA, April 2018 Presented To Illinois Realtors From R E A L Regional Economics Applications Laboratory, Institute of Government and Public Affairs University
Housing Market Update
 Housing Market Update March 2017 New Hampshire s Housing Market and Challenges Market Overview Dean J. Christon Executive Director, New Hampshire Housing Finance Authority New Hampshire s current housing
Land Quality Perceptions in Expert Opinion Surveys: Evidence from Iowa
 1 Land Quality Perceptions in Expert Opinion Surveys: Evidence from Iowa 2 3 4 5 6 7 8 9 Wendong Zhang 1 and Mike E. Duffy 2 1: Assistant Professor, Department of Economics, Iowa State University 478C
Housing Price Forecasts Illinois Metropolitan Statistical Areas
 Housing Price s Illinois Metropolitan Statistical Areas R E A L Regional Economics Applications Laboratory, Institute of Government and Public Affairs, University of Illinois Dr. Geoffrey J.D. Hewings,
Flexible Lease Arrangements
 Trends in Nebraska Farm Real Estate and Flexible Lease Arrangements Jim Jansen Extension Economist jjansen4@unl.edu 402-261-7572 Percent of U.S. farmland rented by County US Farmland, Ownership, and Tenure,
CONTENTS. Executive Summary 1. Southern Nevada Economic Situation 2 Household Sector 5 Tourism & Hospitality Industry
 CONTENTS Executive Summary 1 Southern Nevada Economic Situation 2 Household Sector 5 Tourism & Hospitality Industry Residential Trends 7 Existing Home Sales 11 Property Management Market 12 Foreclosure
ARLA Members Survey of the Private Rented Sector
 Prepared for The Association of Residential Letting Agents ARLA Members Survey of the Private Rented Sector Second Quarter 2014 Prepared by: O M Carey Jones 5 Henshaw Lane Yeadon Leeds LS19 7RW June, 2014
2014 Plan of Conservation and Development
 The Town of Hebron Section 1 2014 Plan of Conservation and Development Community Profile Introduction (Final: 8/29/13) The Community Profile section of the Plan of Conservation and Development is intended
Housing Price Forecasts. Illinois and Chicago PMSA, October 2014
 Housing Price Forecasts Illinois and Chicago PMSA, October 2014 Presented To Illinois Association of Realtors From R E A L Regional Economics Applications Laboratory, Institute of Government and Public
2018 Housing Market Remains Strong Despite Limited Inventories
 Date: 1/21/19 For Release: Immediately For More Information Contact: Michael Theo, WRA President & CEO, 608-241-2047, mtheo@wra.org or David Clark, Economist, C3 Statistical Solutions and Professor of
Impact Of Financing Terms On Nominal Land Values: Implications For Land Value Surveys
 Economic Staff Paper Series Economics 11-1983 Impact Of Financing Terms On Nominal Land Values: Implications For Land Value Surveys R.W. Jolly Iowa State University Follow this and additional works at:
Economy. Denmark Market Report Q Weak economic growth. Annual real GDP growth
 Denmark Market Report Q 1 Economy Weak economic growth In 13, the economic growth in Denmark ended with a modest growth of. % after a weak fourth quarter with a decrease in the activity. So Denmark is
Twentieth century trends in farmland values
 Twentieth century trends in farmland values Farmland values have exhibited unprecedented increases in recent years. Nationwide, the compound annual rate of increase in farmland prices has been on the order
City of Lonsdale Section Table of Contents
 City of Lonsdale City of Lonsdale Section Table of Contents Page Introduction Demographic Data Overview Population Estimates and Trends Population Projections Population by Age Household Estimates and
Agricultural FINANCE Monitor
 Agricultural FINANCE Monitor agricultural credit conditions in the Eighth Federal Reserve District 2014 Second Quarter The ninth quarterly survey of agricultural credit con - ditions was conducted by the
Monthly Market Snapshot
 SEPTEMBER 2018 Vacancy continues to fall. Nearing the end of the third quarter, the vacancy rate dropped 10 basis points to 6.4%, compared to this time last month at 6.5%. Occupancy of the 1.1 million
HOME SALES RALLY IN THE FOURTH QUARTER TO KEEP WISCONSIN HOUSING MARKET STABLE
 Date: 2/11/2010 For Release: Immediately For More Information Contact: David E. Clark, Economist C3 Statistical Solutions Inc. Office phone: 414-803-6537 or William Malkasian, President Wisconsin REALTORS
Reveals National Economy Hurting Local Commercial Markets
 Latest SIOR Index Reveals National Economy Hurting Local Commercial Markets Lawrence Yun is Senior Vice President and Chief Economist at the NATIONAL ASSOCIATION OF REALTORS. He writes regular columns
HOUSING MARKET OUTLOOK: SAN LUIS OBISPO, CA AND SURROUNDING AREA
 HOUSING MARKET OUTLOOK: SAN LUIS OBISPO, CA AND SURROUNDING AREA GABE RANDALL SCOTT KELTING April15, 2009 National Market Overview April 15, 2009 2008: A Year in Review Starting between 1999 and 2000,
16 April 2018 KEY POINTS
 16 April 2018 MARKET ANALYTICS AND SCENARIO FORECASTING UNIT JOHN LOOS: HOUSEHOLD AND PROPERTY SECTOR STRATEGIST FNB HOME LOANS 087-328 0151 john.loos@fnb.co.za THULANI LUVUNO: STATISTICIAN 087-730 2254
Housing Price Forecasts. Illinois and Chicago PMSA, March 2017
 Housing Price Forecasts Illinois and Chicago PMSA, March 2017 Presented To Illinois Realtors From R E A L Regional Economics Applications Laboratory, Institute of Government and Public Affairs University
By several measures, homebuilding made a comeback in 2012 (Figure 6). After falling another 8.6 percent in 2011, single-family
. After falling another 8.6 percent in 2011, single-family") 2 Housing Markets With sales picking up, low inventories of both new and existing homes helped to firm prices and spur new single-family construction in 212. Multifamily markets posted another strong year,
2 Housing Markets With sales picking up, low inventories of both new and existing homes helped to firm prices and spur new single-family construction in 212. Multifamily markets posted another strong year,
Agricultural FINANCE Monitor
 Agricultural FINANCE Monitor agricultural credit conditions in the Eighth Federal Reserve District 2014 First Quarter The eighth quarterly survey of agricultural credit conditions was conducted by the
2015 First Quarter Market Report
 2015 First Quarter Market Report CAAR Member Copy Expanded Edition Charlottesville Area First Quarter 2015 Highlights: Median sales price for the region was up 5.1% over Q1-2014, rising from $244,250 to
Preliminary Results from 2017 Iowa Farmland Ownership and Tenure Survey
 Preliminary Results from 2017 Iowa Farmland Ownership and Tenure Survey Wendong Zhang Assistant Professor of Economics and Extension Economist 91 st Soil Management Land Valuation conference, May 16, 2018
Housing Price Forecasts. Illinois and Chicago PMSA, August 2016
 Housing Price Forecasts Illinois and Chicago PMSA, August 2016 Presented To Illinois Association of Realtors From R E A L Regional Economics Applications Laboratory, Institute of Government and Public
Housing Price Forecasts. Illinois and Chicago PMSA, June 2012
 Housing Price Forecasts Illinois and Chicago PMSA, June 2012 Presented To Illinois Association of REALTORS From R E A L Regional Economics Applications Laboratory, Institute of Government and Public Affairs
LANDLORDS CAUTIOUS AHEAD OF TAX CHANGES
 FEBRUARY 2017 Q4 2016 LANDLORDS CAUTIOUS AHEAD OF TAX CHANGES Despite turbulence in the Private Rented Sector (PRS) dating back to the Government s 2015 Summer Budget, Paragon Mortgages latest PRS Trends
TENNESSEE HOUSING MARKET
 1st Quarter 212 TENNESSEE HOUSING MARKET David A. Penn, Director Business and Economic Research Center Jennings A. Jones College of Business Middle Tennessee State University This quarterly series is supported
ARLA Members Survey of the Private Rented Sector
 Prepared for The Association of Residential Letting Agents & the ARLA Group of Buy to Let Mortgage Lenders ARLA Members Survey of the Private Rented Sector Fourth Quarter 2010 Prepared by: O M Carey Jones
Filling the Gaps: Stable, Available, Affordable. Affordable and other housing markets in Ekurhuleni: September, 2012 DRAFT FOR REVIEW
 Affordable Land and Housing Data Centre Understanding the dynamics that shape the affordable land and housing market in South Africa. Filling the Gaps: Affordable and other housing markets in Ekurhuleni:
2013 Arizona Housing Market Mid-Year Report
 2013 Arizona Housing Market Mid-Year Report This mid-year market report outlines the latest trends in Arizona real estate. The housing market hit bottom in mid to late 2011, and has been in recovery mode
A Historical Perspective on Illinois Farmland Sales
 A Historical Perspective on Illinois Farmland Sales Erik D. Hanson and Bruce J. Sherrick Department of Agricultural and Consumer Economics University of Illinois May 3, 2013 farmdoc daily (3):84 Recommended
THE REAL ESTATE BOARD OF NEW YORK
 THE REAL ESTATE BOARD OF NEW YORK REAL ESTATE BROKER CONFIDENCE INDEX FIRST QUARTER 2018 EXECUTIVE SUMMARY The Real Estate Board of New York s (REBNY) Real Estate Broker Index for the first quarter of
Flexible Farm Lease Agreements
 Flexible Farm Lease Agreements Ag Decision Maker File C2-21 Fluctuating markets and uncertain yields make it difficult to arrive at a fair cash rental rate in advance of each crop year. Some owners and
High-priced homes have a unique place in the
 Livin' Large Texas' Robust Luxury Home Market Joshua G. Roberson December 3, 218 Publication 2217 High-priced homes have a unique place in the overall housing market. Their buyer pool, home characteristics,
LIMITED-SCOPE PERFORMANCE AUDIT REPORT
 LIMITED-SCOPE PERFORMANCE AUDIT REPORT Agricultural Land Valuation: Evaluating the Potential Impact of Changing How Agricultural Land is Valued in the State AUDIT ABSTRACT State law requires the value
Single Family Sales Maine: Units
 Maine Home Connection 19 Commercial St Portland, Maine 04101 MaineHomeConnection.com Office: (207) 517-3100 Email: Info@MaineHomeConnection.com For the fourth consecutive year, Maine home sales set a new
2012 Indiana Tax Credit Rental Housing Survey
 2012 Indiana Tax Credit Rental Housing Survey 155 East Columbus Street Suite 220 Pickerington, OH 43147 Bowen National Research conducted a statewide survey of nearly 450 Tax Credit rental housing properties
ARLA Survey of Residential Investment Landlords
 Prepared for The Association of Residential Letting Agents & the ARLA Group of Buy to Let Mortgage Lenders ARLA Survey of Residential Investment Landlords March 2010 Prepared by O M Carey Jones 5 Henshaw
Housing Price Forecasts. Illinois and Chicago PMSA, September 2016
 Housing Price Forecasts Illinois and Chicago PMSA, September 2016 Presented To Illinois Realtors From R E A L Regional Economics Applications Laboratory, Institute of Government and Public Affairs University
REAL ESTATE MARKET OVERVIEW 1 st Half of 2015
 REAL ESTATE MARKET OVERVIEW 1 st Half of 2015 With Comparisons to the 2 nd Half of 2014 September 4, 2015 Prepared for: First Bank of Wyoming Prepared by: Ken Markert, AICP MMI Planning 2319 Davidson Ave.
THE REAL ESTATE BOARD OF NEW YORK REAL ESTATE BROKER CONFIDENCE INDEX THIRD QUARTER 2016
 THE REAL ESTATE BOARD OF NEW YORK REAL ESTATE BROKER CONFIDENCE INDEX THIRD QUARTER 2016 EXECUTIVE SUMMARY REAL ESTATE BROKER CONFIDENCE INDEX THIRD QUARTER 2016 The Real Estate Board of New York s (REBNY)
Direct government payments are
 22 Economic Research Service/USDA Agricultural Outlook/June-July 21 Payments are generally attached to the land, so the rights to receive payments transfer with land ownership. Current landowners capture
PROPERTY BAROMETER Residential Property Affordability Review The recently improving Housing Affordability trend stalled in the 1 st quarter of 2017
 21 June 2017 MARKET ANALYTICS AND SCENARIO FORECASTING UNIT JOHN LOOS: HOUSEHOLD AND PROPERTY SECTOR STRATEGIST FNB HOME LOANS 087-328 0151 john.loos@fnb.co.za LIZE ERASMUS: STATISTICIAN 087-335 6664 lize.erasmus@@fnb.co.za
RESIDENTIAL MARKET ANALYSIS
 RESIDENTIAL MARKET ANALYSIS CLANCY TERRY RMLS Student Fellow Master of Real Estate Development Candidate Oregon and national housing markets both demonstrated shifting trends in the first quarter of 2015
Survey of Emerging Market Conditions
 Survey of Emerging Market Conditions Quarter 1 2008 Preview Edition Published March 18, 2008 Lead Researcher and Analyst Dr. Wayne R. Archer, Executive Director University of Florida Bergstrom Center for
ECONOMIC CURRENTS. Vol. 5 Issue 2 SOUTH FLORIDA ECONOMIC QUARTERLY. Key Findings, 2 nd Quarter, 2015
 ECONOMIC CURRENTS THE Introduction SOUTH FLORIDA ECONOMIC QUARTERLY Economic Currents provides an overview of the South Florida regional economy. The report presents current employment, economic and real
Regression Estimates of Different Land Type Prices and Time Adjustments
 Regression Estimates of Different Land Type Prices and Time Adjustments By Bill Wilson, Bryan Schurle, Mykel Taylor, Allen Featherstone, and Gregg Ibendahl ABSTRACT Appraisers use puritan sales to estimate
So you have inherited a farm...
 So you have inherited a farm... I nheriting a farm can be both exciting and frustrating. Some people know exactly what they would like to do with the farm, but many do not. A number of questions and issues
CONSUMER CONFIDENCE AND REAL ESTATE MARKET PERFORMANCE GO HAND-IN-HAND
 CONSUMER CONFIDENCE AND REAL ESTATE MARKET PERFORMANCE GO HAND-IN-HAND The job market, mortgage interest rates and the migration balance are often considered to be the main determinants of real estate
The Knox County HOUSING MARKET
 T E C H REPORT SERIES The Knox HOUSING MARKET Date: August 2007 For more information: MPC Contact Person: Bryan Berry 215-2500 MPC Website and e-mail www.knoxmpc.org contact@knoxmpc.org INTRODUCTION In
Housing Price Forecasts. Illinois and Chicago PMSA, December 2015
 Housing Price Forecasts Illinois and Chicago PMSA, December 2015 Presented To Illinois Association of Realtors From R E A L Regional Economics Applications Laboratory, Institute of Government and Public
Farm Real Estate Ownership Transfer Patterns in Nebraska s Panhandle Region
 University of Nebraska Lincoln Research Bulletin RB349 Farm Real Estate Ownership Transfer Patterns in Nebraska s Panhandle Region Bruce B. Johnson, Professor, Agricultural Economics Dennis M. Conley,
Procedures Used to Calculate Property Taxes for Agricultural Land in Mississippi
 No. 1350 Information Sheet June 2018 Procedures Used to Calculate Property Taxes for Agricultural Land in Mississippi Stan R. Spurlock, Ian A. Munn, and James E. Henderson INTRODUCTION Agricultural land
TABLE OF CONTENTS. Summary Part. I: The Minnesota Farm Land Market in A. Land Market Trends...
 TABLE OF CONTENTS ] Page Summary... 1... -J... rrut uure...... *..... 3 Part I: The Minnesota Farm Land Market in 1981... A. Land Market Trends...... 5 5 Reporters' Estimates... Actual Sales... Activity
University of St. Thomas Minnesota Commercial Real Estate Survey
 University of St. Thomas Minnesota Commercial Real Estate Survey December 2016 Minnesota Commercial Real Estate Outlook Showing Few Changes Following Election, says University of St Thomas Minnesota Commercial
Cash Rents Down 5% to 10% for 2016
 Despite dour mood, ag bankers see only a modest uptick in farm loan default rates in the year ahead. The March Rural Mainstreet Index (RMI) survey, conducted by Creighton University Economist Dr. Ernie
Report on Nevada s Housing Market
 August 216 Report on Nevada s Housing Market This series of reports on Nevada s Housing Market is presented by the Lied Institute for Real Estate Studies at the University of Nevada, Las Vegas. These reports
WIndicators. Housing Issues Affecting Wisconsin. Volume 1, Number 4. Steven Deller, Todd Johnson, Matt Kures, and Tessa Conroy
 WIndicators Housing Issues Affecting Wisconsin Volume 1, Number 4 Steven Deller, Todd Johnson, Matt Kures, and Tessa Conroy Housing is becoming an issue in Wisconsin. Housing prices are growing while new
Vacancy Inches Higher, Despite Continued Absorption
 Research & Forecast Report GREATER PHOENIX OFFICE 1Q 2017 Vacancy Inches Higher, Despite Continued Absorption Key Takeaways > > Improving conditions in the Greater Phoenix office market took a pause in
Quarterly Housing Market Update
 Quarterly Housing Market Update An Overview New Hampshire s current housing market performance, as well as its overall economy, is slowly improving, with positives such as increasing employment and rising
Housing Price Forecasts. Illinois and Chicago PMSA, March 2019
 Housing Price Forecasts Illinois and Chicago PMSA, March 2019 Presented To Illinois Realtors From R E A L Regional Economics Applications Laboratory, Institute of Government and Public Affairs University
REAL ESTATE SENTIMENT INDEX 2 nd Quarter 2018
 About Real Estate Sentiment Index (RESI) The Real Estate Sentiment Index (RESI) is jointly developed by the Real Estate Developers Association of Singapore (REDAS) and the Department of Real Estate (DRE),
2017 Q1 PROPERTY MARKET REPORT
 2017 Q1 PROPERTY MARKET REPORT OVERVIEW Whilst Q1 of 2016 was a strong start, the forecast for Q1 of 2017 was a little different. Initial predictions suggested 2017 would bring uncertainty caused by the
DATA FOR MAY Published June 23, Sales are up +11.3% month-over-month. The year-over-year comparison shows an increase of +11.1%.
 Permission is granted only to ARMLS Subscribers for reproduction with attribution on to ARMLS COPYRIGHT 2017. For questions regarding this publication contact Brand@ARMLS.com. DATA FOR MAY 2017 - Published
CONTENTS. Executive Summary. Southern Nevada Economic Situation 1 Household Sector 4 Tourism & Hospitality Industry
 CONTENTS Executive Summary Southern Nevada Economic Situation 1 Household Sector 4 Tourism & Hospitality Industry Residential Trends 6 Existing Home Sales 10 Property Management Market 11 Foreclosure Situation
Shadow inventory in Texas
 With the national and local real estate markets turning positive, questions remain about the shadow inventory that was supposed to be holding down the market. Concerns over shadow inventory re-entering
For the Reno MSA employment has historically been based largely on construction and the leisure and hospitality industry. The construction industry
 For the Reno MSA employment has historically been based largely on construction and the leisure and hospitality industry. The construction industry has lost almost 15,000 construction jobs since 2006,
The Seattle MD Apartment Market Report
 The Seattle MD Apartment Market Report Volume 16 Issue 2, December 2016 The Nation s Crane Capital Seattle continues to experience an apartment boom which requires constant construction of new units. At
February 2016 Loudoun County Market Trends Report Contracts and sales activity jump double-digits; Inventories down 15.5 percent
 FOR IMMEDIATE RELEASE Contact: Christine Windle 703-777-2468, cwindle@dullesarea.com Sponsored by: Access National Bank Tom Ciolkosz, (703) 871-1045, tciolkosz@accessnationalbank.com Patty Foster, 703-871-1014,
nd Quarter Market Report
 2015 2 nd Quarter Market Report The voice of real estate in Central Virginia CAAR Member Copy Expanded Edition Charlottesville Area 2 nd Quarter 2015 Highlights: Closed sales in the Greater Charlottesville