Comprehensive Housing Master Plan. Final Report April 2006
|
|
|
- Lenard Shepherd
- 5 years ago
- Views:
Transcription


1 Comprehensive Housing Master Plan Final Report April 2006
2 Section H
3 This page intentionally blank
4 FINANCIAL ANALYSIS OBJECTIVES B&D utilized a system-wide financial model to test the feasibility of the proposed new construction and renovation projects in the context of the financial performance of the entire housing system at MSU. The model analyzes projected revenues, operating expenses, personnel and non-personnel, as well as the general economic performance of each of the residential buildings. The main elements of the financial performance analysis are the debt coverage ratio and the annual cash flow. METHODOLOGY AND ASSUMPTIONS The financial model includes the following of exhibits/documents: Phasing strategy chart showing major assumptions with respect to new construction and renovation over the course of the next 10 years; Outline of the major capital projects; System-wide financial pro forma; and Individual building pro formas (both existing and new). Revenues The revenues primarily include rental revenues during the fall and spring semesters as well as a small percentage of summer rental revenues, conference income, and other revenues. The occupancies shown in the model vary from building to building (70%- 95%). The occupancy projections are based on historical data. The occupancy for the new projects, Phase 5, is assumed to be 90%. The rental revenues for Butler Hall, Alumni Tower, Nunn Hall, Mignon Tower, West and East Mignon, Mignon Hall, Fields Hall, and Thompson Hall are recommended to grow at the following rates (see individual building pro formas in the Exhibit following this text for more details): Approximately 8% for the academic year 2006/07 (vary from building to building see individual pro formas in the Exhibit following this text); 7% for the academic year 2007/08; 6% for the academic year 2008/09; 5% for the academic year 2009/10; and 4% for the academic year 2010/11 and thereafter. The double-occupancy rental rate at Thompson Hall will be adjusted from $1,650 per semester in the academic year 2005/2006 down to $1,450 in the academic year 2006/2007. Rental rates at all other buildings are recommended to be increased by 4% annually. The non-rental revenues are inflated at 3% per year. Morehead State University Comprehensive Housing Master Plan H. 1
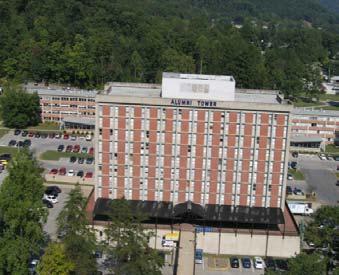
5 FINANCIAL ANALYSIS B&D recommends the following rental rates for the 2006/2007 academic year: COMMUNITY-STYLE (Rates per bed) Per Month Per Semester Alumni Tower Double $262 $1,310 Single $393 $1,965 Butler Hall Double $262 $1,310 Single $393 $1,965 Cartmell Hall Double $262 $1,310 Single $393 $1,965 Fields Hall Double $285 $1,425 Single $428 $2,138 Thompson Hall Double $290 $1,450 SUITE-STYLE Single $435 $2,175 (Rates per bed) Per Month Per Semester East Mignon Hall Quad $275 $1,375 Double $412 $2,062 Mignon Hall Quad $275 $1,375 Double $412 $2,062 Mignon Tower Quad $275 $1,375 Double $412 $2,062 West Mignon Hall Quad $280 $1,400 Double $420 $2,100 Nunn Hall Quad $275 $1,375 Double $412 $2,062 B&D also recommends conversion of family housing (Eagle Lake Apartments and Normal Hall) into single student apartments for upper classmen. The following rental rates are proposed: SINGLE-STUDENT APARTMENTS (Rates per unit) Per Month Per Semester Eagle Lake Apartments 1-Bedroom $676 $3,380 2-Bedroom $884 $4,420 Gilley Apartments 2-Bedroom $884 $4,420 Mays Hall Apartments Efficiency $520 $2,600 1-Bedroom $624 $3,120 2-Bedroom $884 $4,420 Normal Hall 1-Bedroom $580 $2,900 (Furnished) 1-Bedroom $560 $2,800 (Unfurnished) In addition to the revenues generated from operations, the University is projected to continue its $500,000-per-year contribution through the academic year 2012/13. This contribution is necessary to maintain a positive cash flow and support the recommended projects. Morehead State University Comprehensive Housing Master Plan H. 2
6 FINANCIAL ANALYSIS Expenses Operating expenses include both personnel and non-personnel costs. The costs assumptions are based on the current operating budget and have been pro rated based on gross square footages and assigned to individual buildings. A 3% annual inflation rate is applied to all expenses. Project Costs and Debt Service The debt service includes the existing debt (existing facilities including Waterfield, Wilson, Regents, and Series I), new debt on the existing buildings to cover the cost of renovations (all to be financed with debt), and new debt for the proposed new complex (Phase 5). B&D used a 20-year debt term and 5.50% interest rate as assumptions for all proposed renovation projects and a 20-year debt term and 5.25% interest rate for the proposed new facility. The following projects have been identified: Renovations: Nunn Hall renovation (Phase 2) - $5.0 million ($421,000 of annual debt service); Alumni Tower renovation (Phase 3) $2.4 million ($200,000 of annual debt service); Mignon Tower renovation (Phase 4) - $2.4 million ($200,000 of annual debt service); East Mignon Hall renovation (Phase 5) - $2.2 million ($180,000 of annual debt service); West Mignon Hall renovation (Phase 6) - $2.4 million ($200,000 of annual debt service); Mignon Hall renovation (Phase 7) - $3.7 million ($313,000 of annual debt service); and Cartmell Hall renovation (Phase 8) - $3.7 million ($311,000 of annual debt service). New Construction: New Apartment Complex (Phase 5) - $20.2 million ($1.66 million of annual debt service). Phase 1 includes taking Cooper Hall off line and has no capital cost assigned to it. Reserve & Replacement Account B&D recommends establishing a Reserve & Replacement Account specific to the housing system. Contributions to that account are shown on a system-wide basis and range for $0, when the system generates no cash flow beyond the break-even point, to $250,000 in the academic year 2015/16 when the system stabilizes itself financially after the implementation of all the recommended projects. Morehead State University Comprehensive Housing Master Plan H. 3
7 FINANCIAL ANALYSIS FINDINGS The entire housing system breaks even or maintains a positive annual cash flow during every year of the master plan implementation, which results in a growing cumulative cash flow. The debt coverage ratio is projected to vary from 1.00:1 in the most critical academic year 2012/13 to 1.15:1 upon full implementation of the master plan in the academic year 2015/16. In the academic year 2006/07, the debt coverage ratio is projected to be 1.23:1 due to the fact that no new debt service is included in the calculations (first capital project is scheduled to start in 2007/2008). $6,000,000 $5,000,000 $4,000,000 $3,000,000 Net Operating Income Total Annual Debt Service $2,000,000 $1,000,000 $0 2006/ / / / / / / / / /2016 Relatively aggressive rental rate increases, approximately 8% in the academic year 2006/07 being the highest, in the first four years of the master plan s implementation are necessary to build up the debt capacity necessary for the proposed projects. The current $500,000 annual institutional contribution can terminate in the academic year 2013/14, at which point the housing system will become entirely self-supportive. The individual pro formas for the residential buildings demonstrate that the facilities perform with various degrees of efficiency. As expenses are pro rated based on square footages rather than measured and quantified individually for each building, the system-wide pro forma provides the best tool in evaluating the financial performance of the MSU housing program. Morehead State University Comprehensive Housing Master Plan H. 4
8 TABLE OF CONTENTS A Executive Summary B Recommended Development Strategy Exhibit: Phasing Strategy Outline C Competitive Context Analysis Exhibit: Summary Charts D Focus Group Report E Survey Analysis Exhibit: Student Survey Results F Demand Analysis Exhibit: Demand Analysis Tables G Off-Campus Market Analysis Exhibit: Summary Charts H Financial Analysis Exhibit: System-Wide Financial Model I Student Recreation Center Location Analysis Morehead State University Comprehensive Housing Master Plan Brailsford & Dunlavey
9 Section A
10 This page intentionally blank
11 EXECUTIVE SUMMARY OBJECTIVES AND METHODOLOGY In September 2005, Morehead State University ( MSU or University ) engaged Brailsford & Dunlavey ( B&D ) to prepare a Comprehensive Housing Master Plan. The goal of the master planning effort was to develop a long-term strategy for the residential program with respect to the existing buildings and potential new construction. B&D developed the strategy in the context of MSU s institutional objectives, market demand, and financial reality. B&D s scope of work included a peer institution analysis, an offcampus market survey, student focus groups, a web-based survey, a housing demand analysis, and financial modeling that led to the development of a 10-year phasing approach. In addition to the housing related issues, B&D assisted the University in the site selection process for the proposed student recreation center. Recommendations regarding the location of the new facility are also included in this report. FINDINGS The Housing Master Plan Steering Committee, consisting of the MSU s senior administrators, identified the following key strategic objectives as the major guidelines for the planning team: Reinforcement of MSU s reputation as a top-quality regional institution; Provision of marketable housing options for all students, regardless of their enrollment status, with a heavy emphasis on freshmen and sophomores who are required to live on campus; Solution of the deferred maintenance problems that many of the residential buildings face today; and Improvement of the financial performance of the housing system to eliminate the current operating deficit and create a debt capacity needed to fund future projects. In the context of these objectives, B&D conducted its research and developed the recommended strategy. With the assistance of MSU, B&D selected the following schools for the peer analysis: Eastern Kentucky University, Murray State, Shawnee State, University of Kentucky, James Madison University, and Marshall University. MSU offers less expensive tuition than its peers. Only Marshall University is more affordable with respect to the in-state tuition and Shawnee State offers less expensive out-of-state tuition. MSU can house approximately 56% of its undergraduates. The closest competitors, Eastern Kentucky University, University of Kentucky, and James Madison University can house only 36% of their undergraduate populations. The annual room and board rates at the peer schools varied from $4,900 at Murray State to $6,800 at Shawnee State with an average of $5,850. MSU, at $3,800, is well below the average and less expensive than its nearest competitor, Murray State. The off-campus market offers choices ranging from studio apartments to five-bedroom units. According to the Census information for the City of Morehead, the majority (43%) of the 1,100 multi-family units in the city are in a two-bedroom configuration. Based on B&D s analysis, the average monthly rental rates vary form $335 per month for a studio to $690 per month for a three bedroom unit. These rates generally include water, sewer, and trash disposal. All other utilities are paid separately by the tenants. The average Morehead State University Comprehensive Housing Master Plan A. 1

12 EXECUTIVE SUMMARY monthly per-student cost of utilities, based on B&D s survey, is $60. According to the city planner, no new building permits for multi-family housing have been filed in the past year, but the city would encourage off-campus developments in the future. B&D s demand analysis showed a surplus of double-occupancy community-style rooms and quad-occupancy suites. The analysis also demonstrated strong demand for singleoccupancy, community-style rooms, and double-occupancy-suites. In addition, B&D determined a demand for approximately 500 beds in apartments offering private bedrooms. B&D s model showed a maximum market demand for approximately 3,185 beds, if the offered units closely matched student preferences. RECOMMENDATIONS At the conclusion of the planning process, B&D formulated a recommended development strategy that includes the following: Renovations of Nunn Hall, Alumni Tower, Mignon Tower, East Mignon Hall, West Mignon Hall, Mignon Hall, and Cartmell Hall; Construction of a new 400-bed apartment complex; Taking Cooper Hall and Butler Hall off line; Gradual increase of the rental rates to build up debt capacity needed to finance the proposed projects; Creation of a housing-system Reserve & Replacement Account to fund the on-going non-capital facility projects; and Construction of a new dining hall and a new student recreation center. B&D also recommends that the new student recreation center be located in the residential neighborhood on the site currently occupied by Regents Hall and Wilson Hall. These recommendations are a set of guidelines that can be adjusted as the MSU s Strategic Plan evolves through its formulation and, later, implementation. Any modifications to this strategy should be considered in the context of the housing systemwide cash flow that has to remain positive throughout. Thompson Hall offers accommodations to upper classmen Morehead State University Comprehensive Housing Master Plan A. 2
13 Morehead State University Residential Life Master Plan Phasing Strategy Diagram Beds As Currently Rented Maximum Design Capacity (Singles & Doubles) 2005/ / / / / / / / / / /15 Butler Hall Cartmell Hall Fields Hall Waterfield Hall Regents Hall Thompson Hall Alumni Tower Cooper Hall Wilson Hall Mignon Tower West Mignon Hall East Mignon Hall Mignon Hall Nunn Hall Mays Hall Apartments Gilley Apartments Normal Hall (Units) Eagle Lake Apartments (Units) New Complex 1 (Apartments/Suites) Total 3,690 2,934 2,934 2,777 2,425 2,429 2,477 2,973 2,921 2,817 2,944 2,944 2,944 Freshman/Sophomore Beds (1) 3,466 2,710 2,710 2,517 2,165 2,169 2,217 2,313 2,261 2,157 2,284 2,284 2,284 Upperclass/Graduate Beds (2) (1) Freshman/Sophomore beds include the following buildings: Butler, Cartmel, Fields, Thompson, Alumni, Cooper, Mignon Tower, East Mignon, West Mignon, Mignon Hall, and Nunn. (1) Upperclass/Graduat beds include the following buildings: Mays (double-occupancy bedrooms), Gilley (double-occupancy bedrooms), Normal (single-occupancy bedrooms), Eagle Lake (double-occupancy bedrooms), and the New Complex (single-occupancy bedrooms).
14 Section B
15 This page intentionally blank
16 RECOMMENDED DEVELOPMENT STRATEGY STRATEGY OUTLINE At the conclusion of the master planning process for student housing at MSU, B&D developed a phasing strategy that addresses the existing housing program with respect to both renovations and new construction. MSU s design capacity, including Waterfield Hall, Wilson Hall, and Regents Hall is approximately 3,690 beds. The housing system currently operates at slightly over 2,930 beds with Waterfield, Wilson and Regents being off-line and some of the double occupancy rooms rented as singles. The capacity target, determined through the market research in the context of the institutional objectives, is between 2,600 beds, 35% of the projected student population at MSU over the next 10 years, and 3,185 beds, the maximum potential market demand. B&D recommends realizing this objective by first, reducing the capacity of the housing system to approximately 2,400 beds, and then, gradually increasing the total bed count to 2,900. The decrease of capacity due to taking beds off-line, either permanently or temporarily for renovations, combined with higher-than-average rental rate increases will make the housing system more efficient and, therefore, will generate debt capacity needed for the proposed projects. Upon completion of all the renovations and construction of a new residential complex, MSU s housing program will increase to approximately 2,900 beds and will generate a positive cash flow on a system-wide basis. In addition, B&D recommends the creation of a housing-specific Reserve & Replacement Account which will allow independent (within the housing system) financing of housing projects that are currently being subsidized by the University. DEVELOPMENT PHASES The following phases are recommended in the implementation of the Comprehensive Housing Master Plan: Phase 1 (academic year 2006/07) Cooper Hall will go off-line and rental rates at Butler, Alumni, Nunn, Mignon Tower, West and East Mignon, Mignon Hall, and Fields Hall will increase by approximately 8% (increases vary from building to building - detailed breakdown is included in the Financial Analysis section of this report). All other rental rates are projected at 4%. Family housing will be converted to single-student apartment housing. Reduction of the capacity for lower classmen by 193 beds in Cooper will increase the occupancies of the remaining residence halls due to the freshman and sophomore live-on requirement. Phase 2 (academic year 2007/08) Nunn Hall will be taken off-line for a year to undergo renovations. The scope of the renovations will be defined within the constraints of a preliminary budget of $5.0 million. The budget, assumed to be financed with debt, will result in an annual debt service of $421,000. Rental rates at Butler, Alumni, Nunn, Mignon Tower, West and East Mignon, Mignon Hall, Fields Hall, and Thompson Hall will increase by 7% while all other rental rates increase by 4%. Phase 3 (academic year 2008/09) Nunn Hall will come back on-line while Alumni Tower will be closed for renovations. The project budget for the renovations is approximately $2.4 million, which will add additional $200,000 to the annual systemwide debt service. The dining facility at Alumni Hall will be replaced with a new dining hall. The lower section of Alumni Tower, currently occupied by the dining facility, will be converted into new student-oriented spaces such as lounges, classrooms, etc. Rental rates at Butler, Alumni, Nunn, Mignon Tower, West and East Mignon, Mignon Morehead State University Comprehensive Housing Master Plan B. 1
 Alumni Tower will reopen while Mignon Tower will undergo renovations with a preliminary budget of $2.")
17 RECOMMENDED DEVELOPMENT STRATEGY Hall, Fields Hall, and Thompson Hall will increase by 6% while all other rental rate increases are projected at 4%. Design of a new, 400-bed apartment complex will begin. Phase 4 (academic year 2009/10) Alumni Tower will reopen while Mignon Tower will undergo renovations with a preliminary budget of $2.5 million resulting in a $200,000 debt service per year. Rental rates at Butler, Alumni, Nunn, Mignon Tower, West and East Mignon, Mignon Hall, Fields Hall, and Thompson Hall will increase by 5% while all other rental rates increase by 4%. Construction of the new apartment complex is scheduled to start as part of Phase 4. Phase 5 (academic year 2010/11) East Mignon Hall will go off-line for renovations budgeted at $2.2 million ($180,000 annual debt service). Mignon Tower renovation will be completed and the building will reopen. All rental rate increases will stabilize at 4% per year. In addition, the new apartment complex will open providing 400 beds (100 four-bedroom units with single occupancy bedrooms) for upper classmen. Four-bedroom unit recommended for Phase 5 Phase 6 (academic year 2011/12) Substantial renovation of West Mignon Hall will take place while the building remains off-line during that academic year. The estimated budget for the renovations is approximately $2.4 million ($200,000 annual debt service). East Mignon Hall will come on-line after completion of the renovations with a reduced occupancy of three students per suite. The system-wide rental rate increase is projected at 4%. Phase 7 (academic year 2012/13) Mignon Hall will go off line for renovations budgeted at $3.7 million while West Mignon Hall will reopen. The system-wide rental rate increase remains at 4%. Phase 8 (academic year 2013/14) Mignon Hall will reopen. The housing system will have sufficient debt capacity to finance $3.7 million dollars for renovation of Cartmell Hall and other facilities, as needed. These renovations may have to take place during semester breaks in order to preserve the capacity of the housing system. Butler Hall will go off-line and may be demolished. Morehead State University Comprehensive Housing Master Plan B. 2
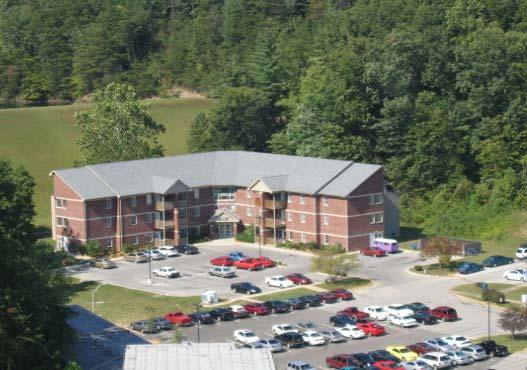
18 RECOMMENDED DEVELOPMENT STRATEGY OTHER CONSIDERATIONS Capacity to house freshmen and sophomores MSU currently requires its freshmen and sophomores to live on campus. In the Fall of 2005, 1,324 freshmen (62% of the freshmen class) and 536 sophomores (39% of the sophomore class) resided in University housing. These relatively low numbers are a result of a fairly significant number of exemptions granted to freshmen and sophomores who qualify and prefer to live off-campus. If the current number of on-campus freshmen and sophomores, approximately 1,860 students, remained constant, MSU s housing system would provide sufficient capacity to house these students during the implementation of this master plan. The non-apartment residential facilities (Butler Hall, Cartmell Hall, Fields Hall, Thompson Hall, Alumni Tower, Cooper Hall, Mignon Tower, West and East Mignon Hall, Mignon Hall, and Nunn Hall) currently provide approximately 2,700 beds. If all these buildings were designated as freshman/sophomore facilities, their combined capacity would not decrease below approximately 2,160 beds (academic years 2007/08 and 2008/2009) which exceeds the number of on-campus freshmen and sophomores by 300. This 300-bed margin could accommodate increased demand due to the changes in enforcement of the live-on requirement. During the formulation of this master plan, the exact implications of these changes were not known. The new residential complex projected to open in the Fall of 2010, could provide units for both upperclassmen and freshmen/sophomores (combination of apartments and suites) if needed. Butler Hall could also remain on-line, if needed, to accommodate approximately 170 students. Renovations of Butler Hall would be possible due to the housing system s positive cash flow that is expected to stabilize in the academic year 2014/15. Capacity to house upper classmen If all non-apartment residential facilities (Butler Hall, Cartmell Hall, Fields Hall, Thompson Hall, Alumni Tower, Cooper Hall, Mignon Tower, West and East Mignon Hall, Mignon Hall, and Nunn Hall) provided housing for freshmen and sophomores, only approximately 260 beds would be available to upper classmen in the apartment complexes. This number could be increased by the 300-bed excess capacity for freshmen and sophomores, as discussed above, assuming that the demand for freshmen/sophomore beds remained at the current level. The new apartment complex, scheduled to open in the Fall of 2010, will provide 400 additional beds, which combined with the existing 260 apartment-style beds, will likely satisfy the upper classmen housing demand (approximately 670 juniors and seniors resided on campus in the Fall 2005). Family housing MSU provides housing for students with families at Normal Hall and Eagle Lake Apartments. While Normal Hall is a stabilized operation producing a positive cash flow, Eagle Lake Apartments generates a substantial deficit. Based on the consensus reached with the Housing Master Plan Steering Committee, B&D recommends that a consideration be given to converting both Normal Hall and Eagle Lake apartments into single student units for upper classmen and graduate students. Location of the proposed projects. During the master-planning process, the Steering Committee discussed construction of three new quality of life facilities at MSU: a new 400-bed, apartment-style complex, a new dining facility to replace the one currently located in Alumni Tower, and a new, dedicated student recreation center. The map below shows the proposed locations for these projects. Morehead State University Comprehensive Housing Master Plan B. 3
19 RECOMMENDED DEVELOPMENT STRATEGY 1. Proposed location for the new 400-bed apartment complex; 2. Alternative location for the new apartment complex; 3. Proposed location for the new dining facility (B&D recommends that the size and configuration of the facility be determined through a separate feasibility study); 4. Proposed location for the new student recreation center (exact size of the facility to be determined through programming and financial analysis); 5. Alternative location for the proposed new dining facility. Implementation of B&D s recommendation will require demolition of some of the following existing structures: Waterfield Hall, Hagggan, Perkins, Holbrook, Regents Hall, Wilson Hall, and Cooper Hall Proposed locations of new quality of life facilities at MSU Morehead State University Comprehensive Housing Master Plan B. 4
20 Morehead State University Comprehensive Housing Master Plan Competitive Context Analysis Brailsford & Dunlavey Average Annual University Affiliation Annual Tuition & Fees (1) Room & City/ Web Address Out-of-State In-State Board (2) State Morehead State University Public $11,480 $4,320 $3,818 Morehead, KY Peer Universities Eastern Kentucky University Public $13,070 $4,660 $5,450 Richmond, KY Murray State Public $12,036 $4,428 $4,890 Murray, KY Shawnee State Public $9,396 $5,508 $6,791 Portsmouth, OH University of Kentucky Public $12,970 $5,980 $5,623 Lexington, KY James Madison University Public $15,322 $5,886 $6,124 Harrisonburg, VA Marshall University Public $10,634 $3,932 $6,272 Huntington, WV Average without Morehead State $12,238 $5,066 $5,858 NOTES: University statistics are approximate based on the most current Academic Year as presented in the universities' own world wide web sites. (1) - Based on full-time undergraduate tuition. 12 credit hours were assumed for schools charging by-credit-hour. (2) - Standard double residence hall room and full board plan, as published by the institution NP - Not Provided NA - Information Not Available Page 1
21 Morehead State University Comprehensive Housing Master Plan Competitive Context Analysis Brailsford & Dunlavey University Enrollment Undergraduate Gender Enrollment Status Undergrad % % Freshman %Male %Female %Full-time %Part-time Out-of-State Retained Morehead State University 7,452 6,523 38% 62% 82% 18% 15% 63% Peer Universities Eastern Kentucky University 16,183 13,837 37% 63% 70% 30% 8% 70% Murray State 10,128 8,371 41% 59% 74% 26% 29% 78% Shawnee State 3,500 3,500 38% 62% 80% 20% 9% 54% University of Kentucky 25,686 18,434 47% 53% 88% 12% 17% 78% James Madison University 16,938 15,618 39% 61% 92% 8% 29% 92% Marshall University 13,920 9,859 40% 60% 70% 30% 17% 72% Average without Morehead State 14,393 11,603 40% 60% 79% 21% 18% 74% NOTES: University statistics are approximate based on the most current Academic Year as presented in the universities' own world wide web sites. The Common Data Sets for each institution were used as a basis for the most recent, uniform data. The 2004 Fact Book was used for Murray State University Additional Source: Barron's Profiles of American Colleges, 25th Edition, NP - Not Provided NA - Information Not Available Page 2
22 Morehead State University Comprehensive Housing Master Plan Competitive Context Analysis Brailsford & Dunlavey University Enrolled/ Accepted Accepted/ Applicants SAT Mean Verbal Math ACT Mean Morehead State University 42% 73% NP NP 20 Peer Universities Eastern Kentucky University 57% 79% NP NP 21 Murray State 54% 88% NP NP 23 Shawnee State 31% 100% NP NP 19 University of Kentucky 47% 79% NP NP 24 James Madison University 35% 63% NP Marshall University 55% 84% NP NP 23 Average without Morehead State 47% 82% NOTES: University statistics are approximate based on the most current Academic Year as presented in the universities' own world wide web s NA - Information Not Available NP - Information Not Provided Page 3
23 Morehead State University Comprehensive Housing Master Plan Competitive Context Analysis Brailsford & Dunlavey University Design % Can Capacity (1) House (2) Occupancy Rate Fall 2005 Live-on Requirement Years Guaranteed Mandatory Meal Plan Traditional (3) Number of Beds Suite (4) Student (6) Apartments Number of Units Family New Construction Morehead State University 3,622 56% 85% Freshmen & Sophomores No guarantee Freshmen & Sophomores 2,122 1, No Peer Universities Eastern Kentucky University 4,983 36% 98% Freshmen & Sophomores No guarantee Freshmen 3, No Murray State 2,958 35% 100% Freshmen & Sophomores Freshmen & Sophomore Yes 545 2, No Shawnee State % 100% Freshmen Freshmen Yes (all housing residents) Two new apartment units with 48 beds in 2005 University of Kentucky 6,648 36% 89% No No guarantee Yes (all housing residents) 4, new semi-suite beds opened in 2005 James Madison University 5,616 36% 101% Freshmen Freshmen Yes (all housing residents) 5, Planning stages Marshall University 2,182 22% 92% Under 21 No guarantee Yes 1, new suite beds opened in 2003 Average without Morehead State 3,817 30% 97% NOTES: (1) - Design Capacity - Total Revenue Generating Beds (excluding family apartments). (2) - Approximate percentage of undergraduate students that can be housed on-campus. (3) - Traditional double-loaded corridor layout; does not include bathroom, living room, or kitchen. (4) - Includes shared bathroom and/or living room, but no individual kitchen (5) - Includes bathroom, living room, and kitchen in the unit (6) - Student Apartment denotes an apartment that is shared and leased at a per-person rate; figure is number of beds University statistics are approximate based on the universities' own world wide web sites and telephone interviews with the universities' administrators. Page 4
24 Morehead State University Comprehensive Housing Master Plan Competitive Context Analysis Brailsford & Dunlavey University Traditional Rooms Suites Apartments Cost Per Student Per Semester (2) Cost Per Student Per Semester Singles Shared- Double Shared-Quad Singles Shared-Double Shared-Quad Singles Shared (Per Person Per Semester Rate) Family (Per Unit Rate Per Month) Morehead State University $1,815 $1,210 NA $3,780 $1,890 $1,260 $500 to $600/month $250 to $400 / month 1 BR: $425 to $500; 2BR: $700 Peer Universities Eastern Kentucky University $1703 to $1864 $1104 to $1214 NA $1,947 $1,270 NA NA $1380 (shared BR) Murray State $1,893 $1,183 NA $1,893 $1,183 NA NA NA 1BR: $423, 2BR: $487 Shawnee State NA NA NA NA NA NA NA $1989 (shared BR) to $2538 (private BR) NA University of Kentucky $2,467 $1,682 NA $2467 to $3133 $1682 to $2125 NA NA $1735 (Shared BR) $2548 (Private BR) Efficiency: $467, 1 BR: $578, 2 BR: $628 James Madison University NA $1,639 NA NA $1,639 NA NA $2,139 NA Marshall University $1845 to $2269 $1578 to $1748 NA $2,723 $2,098 NA NA NA Notes (1) Shawnee State follows an academic quarter system. The rental rates have been adjusted for comparison with the semester systems at the peer institutions NA - Not Applicable Housing statistics are based on the universities' own housing world wide web sites and telephone interviews with the housing administrators. Page 5
25 Morehead State University Comprehensive Housing Master Plan Competitive Context Analysis Brailsford & Dunlavey Affinity Housing Housing Amenities Living/Learning Honors International/Ethnic Healthy Lifestyle Single Sex Ethernet/Internet Voice Mail Cable TV Computer Lab Study Room 12 Month Lease Freshmen May Bring Cars Game Room A/C Overnight Visitation Over 21 Alcohol Permissive (In Room) Morehead State University x x x x x x x x x x x x Peer Universities Eastern Kentucky University x x x x x x x x x x x Murray State x x x x x x x x x x Shawnee State x x x x x x University of Kentucky x x x x x x x x x x x x x x x James Madison University x x x x x x x x x x Marshall University x x x x x x x x x x x x Total Number of Schools (without MSU) Page 6
26 Section C
27 This page intentionally blank
28 COMPETITIVE CONTEXT OBJECTIVES The objective of the competitive context analysis is to understand Morehead State University s market position among its peer institutions. The analysis also identifies current trends and highlights the attributes of successful housing programs. METHODOLOGY With the assistance of MSU, B&D selected six schools to use as a basis of comparison. Some schools are on the University s list of academic benchmark institutions while others have regional and cross-applicant similarities. The following is a list of these institutions: Eastern Kentucky University Murray State Shawnee State University of Kentucky James Madison University Marshall University B&D sought to understand the driving vision behind each of the housing programs and the supporting quantitative data. Housing administrators at each school were contacted and asked a series of program- and campus-specific questions pertaining to their offerings. The subsequent quantitative research relied on printed documentation readily accessible and typically used by students researching the schools studied. In order to remain consistent with information available to the student market, B&D used these publicly available sources even when minor inaccuracies in the data were evident. While B&D is confident that the information gathered through these telephone interviews is accurate, none of the information was validated by physical inspection of the facilities. Additional floor plans and photographs were reviewed when they were readily available. OVERALL FINDINGS MSU compared well to the peer institutions based on several considerations. Generally, these competitive areas include the existing quantity and mix of housing options, amenities offered to students living on campus, and policies requiring students to live on campus or purchase a meal plan. On these grounds, MSU competes well against its peers. There were also areas of distinction for Morehead in the study. MSU excels on the basis of price. Both in and out-of-state tuition rates at MSU were below the average of the group, and room and board fees were the lowest in the study. Morehead accepts a lower percentage of applicants, but enrolls a lower percentage of accepted applicants. MSU has a much greater capacity to house its undergraduate students with beds for 56% of the enrolled undergraduates. This quantity of beds does not, however, translate into the freshmen retention, which is only 63% at MSU. Morehead State University Comprehensive Housing Master Plan C. 1
29 COMPETITIVE CONTEXT 92% 70% 78% 78% 72% 63% 54% 56% 36% 35% 36% 36% 15% 22% Undergrads Housed Freshmen Retained Eastern Kentucky University Murray State Shawnee State University of Kentucky James Madison University Marshall University Morehead State University Housing Capacity and Freshman Retention General Institution and Admission Features Tuition and fees for competitor schools varied. In-state tuition ranged from roughly $3,900 to $6,000, with Marshall University the least, and University of Kentucky the most expensive. Out-of-state tuition ranged from $9,000 to $15,000 with Shawnee State the lowest priced, and James Madison the highest priced for out-of-state students. MSU tuition and fees for both in-state and outof-state students are well below the average of the peer institutions. Peer University Annual Tuition & Fees Out-of-State In-State Eastern Kentucky University $13,070 $4,660 Murray State $12,036 $4,428 Shawnee State $9,396 $5,508 University of Kentucky $12,970 $5,980 James Madison University $15,322 $5,886 Marshall University $10,634 $3,932 average without Morehead State $12,238 $5,066 Morehead State University $11,480 $4,320 Most of the schools selected for the analysis had total and undergraduate enrollments much larger than MSU s 7,452 total students, including 6,523 undergraduates for the 2004/2005 academic year. Enrollment at the University of Kentucky is more than three times greater than at MSU. Most of the peer institutions were 3,000 to 10,000 greater in enrollment. Only Shawnee State was smaller, at slightly less than half the size of MSU. Morehead State University Comprehensive Housing Master Plan C. 2
30 COMPETITIVE CONTEXT Peer institutions compared in the study ranged in both the rate of acceptance and the proportion of accepted students that enroll. The percent of applicants accepted ranged from 63% (James Madison University) to 100% (Shawnee State), with the peer group average at 82% of the applicants accepted. Morehead State University falls below this average, with 73% of applicants accepted. MSU also is below the average of accepted students that enrolled. The peer institutions ranged from 31% (Shawnee State) to 57% (Eastern Kentucky University) with the group average of 47%. At MSU, 42% of the accepted students enroll. Housing Program Features Comparable institutions housed around 30% of their student populations. Design capacities ranged widely from about 500 beds at Shawnee State to around 6,650 beds at Eastern Kentucky University. MSU has an average supply of beds, but can house a greater share of the student body at 56%. Correspondingly it has the lowest occupancy rate in the study: at 85%, this is below any of the competitor institutions and well below the average. Peer University Design Capacity % of Undergrad. Students Can House Occupancy Rate Fall 2005 Eastern Kentucky University 4,983 36% 98% Murray State 2,958 35% 100% Shawnee State % 100% University of Kentucky 6,648 36% 89% James Madison University 5,616 36% 101% Marshall University 2,182 22% 92% average without Morehead State 3,817 30% 97% Morehead State University 3,618 56% 85% Average annual room and board rates also ranged from around $4,900 at Murray State, to $6,800 at Shawnee State. The average room and board rate of the peer institutions was around $5,850. MSU was by far much less expensive. At $3,800, MSU was well below the average, and less expensive than its nearest competitor, Murray State. Housing Policies and Plans Almost all of the schools require freshmen to live on campus. Only the University of Kentucky did not impose this requirement and half of the schools studied require more than one year of on-campus residence. All of the Universities also provide some assortment of apartment and/or suitestyle housing options for upper-class students to encourage on-campus living. Morehead State University Comprehensive Housing Master Plan C. 3
31 COMPETITIVE CONTEXT Four of the six competitor institutions reported that they are either planning for new construction, or are currently underway in developing new housing. Additionally, all of the six universities reported meal plan requirements. Eastern Kentucky University only requires freshmen living on campus to secure a meal plan, but all others require all university housing residents to purchase some form of meal plan. Housing Existing Conditions All but one of the schools offer living-learning options for the students in their oncampus residence halls. Every school reported having traditional (dormitory) style units as well as a suite or apartment style option available primarily to upperclassmen. The percent mix of housing types (by bed count) offered by MSU exactly matches the average of the peer institutions analyzed in the study. Non-Family Apartments - 4% Non-Family Apartments - 4% Suite - 37% Suite - 37% Traditional - 59% Traditional - 59% Housing Type Mix - Morehead Housing Type Mix - Peers Affinity options offered by select competitor peer institutions but not offered by MSU include international or ethnic designated housing. Housing Amenities In general, all of the institutions offer a consistent set of amenities. Overall, the most popular amenities available for on-campus housing were: Ethernet/Internet Cable Television Air Conditioning Computer Lab Game Room Study Room MSU provides all of the above popular amenities to residents. Other amenities commonly offered included voice mail, overnight visitation, and the option for freshmen to bring vehicles to campus. The only popular amenity not offered at MSU is overnight visitation. Morehead State University Comprehensive Housing Master Plan C. 4
32 Section D
33 This page intentionally blank
34 FOCUS GROUP REPORT OBJECTIVES The purpose of the focus group interviews was to engage a variety of current and prospective residents in dynamic conversation about their residential living needs and preferences at Morehead State University. Because a subsequent survey was planned for the project, the intent of the focus groups was not to provide rigid, statistically reliable responses from a demographically representative sample of the population. Rather, the focus groups were intended to yield qualitative data, reveal hidden sensitivities, and raise issues not previously considered by the researchers. METHODOLOGY A series of focus group interviews was conducted on the MSU campus in September, The University recruited a diverse cross-section of the campus population. Nineteen students attended five sessions. A moderator from B&D led each of the focus groups and guided the conversation to focus on the salient points of the Comprehensive Housing Master Plan. The moderator followed a series of intentionally open-ended questions to afford participants freedom to discuss tangential issues and engage in dynamic group conversation. The focus group interviews were recorded on audiotape to free the moderator from taking extensive notes and to ensure that the participants had the moderator s complete attention. The detailed findings are included in this section. Focus Group Participation Students with Families 5 students (2 female, 3 male) Freshmen 4 students (3 female, 1 male) Greek Students 5 students (5 female) Upperclass Students 4 students (2 female, 2 male) Graduate Students 1 student (1 female) FINDINGS 1. Why did you choose to attend Morehead State? Many students came to MSU because it was close to home but far enough away to enable independence. Most students recognized that MSU is the largest institution in eastern Kentucky. Some students received family and alumni encouragement to attend MSU. Other students recognized that MSU had more programs in their chosen academic field than other schools in the region. The strength of the academic majors was also commonly cited as a positive influence. Many students cited the friendly and helpful people in the region and at MSU. Many students were drawn to the beauty and atmosphere of the area. Morehead State University Comprehensive Housing Master Plan D. 1
35 FOCUS GROUP REPORT Some students returned for a second degree. Many students noted the affordability of attending and the availability of academic scholarships. Many students appreciated the small size of the institution. Students looked at University of Kentucky, Eastern Kentucky University, Kent State, Georgetown, University of Louisville, Ohio State, Thomas Moore College, Transylvania, and community colleges as alternatives to MSU. Out-of-state students came to MSU because in-state tuition was offered to them. 2. How well has Morehead State met your expectations? Many students were satisfied with the positive experiences with many of the instructors. Students also agreed that the quality of the education they received at MSU was exceptional. Some students would recommend MSU to other students but would warn that it is in a remote location. Many students were satisfied that the professors were willing to work with new students to transition from high school to college on a one-on-one basis. Others found that professors were difficult to reach. Some out-of-state students found that MSU did not have a strong reputation beyond the immediate region. Many students were generally satisfied with their experience. Students were appreciative of President Andrews involvement with student life. 3. What are you planning to do after graduation? Some students said they would stay within the region because it is very comfortable. Others thought they would move outside the state to the west coast or the Cincinnati area. Some students planned to attend a graduate school outside of the region. 4. How critical was on-campus housing to your decision to attend Morehead State? Most of the students with families had not toured the residence halls before deciding to attend MSU, although they agreed they would have selected an alternate college or university if family housing were not available on MSU s campus. Some students appreciated the opportunity to live on campus versus driving up to an hour because of the high gas prices. 5. In general, what is your perception of the residence halls and apartments at Morehead State? What do you like the most? What could be improved? Morehead State University Comprehensive Housing Master Plan D. 2
36 FOCUS GROUP REPORT One graduate student thought that they should be able to live in on-campus studio apartments but still be independent. Many graduate students live offcampus now. Students appreciated the opportunity to select their own roommate, and there were only a few who have been matched poorly with roommates. Some students felt that the RA s should not have roommates because of the specific responsibilities and issues associated with the job (keeping the door open, using the phone, private meetings). Students stated that freshmen should be separated from upperclassmen, but they thought it would be acceptable to mix sophomores, juniors, and seniors. Many students agreed that the University should build apartment-style units for upperclassmen. Some students requested the installation of individual unit controls for the heating and air conditioning. 6. What are the reputations of the different residence halls? What do you like about them? What could be improved? Butler One student described Butler as hideous with concrete walls and poor ventilation. Students appreciated the additional peer advisors and supplemental instructors available for tutoring and in-building classes. Students spoke about how a strong community was built within the first week of classes. The lobby is the place where the community is built. The community bathrooms are not a nightmare, and there is an ability to have conversations with the neighbors. The staff encourages everyone to keep their doors open which makes it is easier to build a sense of community in the building. Upper-class students felt that Butler would be best-suited for freshmen. Cartmell One student believed that moving to Cartmell was an upgrade from living in Butler. Rooms are smaller than at Butler, but are nice. There are more people on each floor and more of a community atmosphere. Some students felt that it really needs a lot of work to improve the physical condition. The rooms are too small for two students. Some students noted the good views from the rooms. Mignon Hall, West Mignon, East Mignon Students appreciated the semi-private bathrooms in the suites. However, other students did not appreciate the location of the vanities in the bedrooms, noting that they were disruptive when roommates were trying to sleep. Mignon Tower Students appreciated the good views. Many students found that residents seldom leave their suites. Morehead State University Comprehensive Housing Master Plan D. 3
37 FOCUS GROUP REPORT Some students recognized the benefits of the rooftop penthouse for programming events. Other students noted that there was enough room for four residents in a suite. Nunn Hall Students appreciated the semi-private bathrooms in the suites. Students stated that the renovations and new furniture were positive. Many students did not like the open corridors. Students also complained about the poor temperature controls. Residents see few people regularly because they are located so far apart within the building, and some admitted to not knowing their neighbors. Some thought that Nunn was cliquey because of the sororities located there. Some students complained about its remote location on the hill. Some students criticized the lack of general cleanliness of the building. Fields and Thompson Students felt that these are the highest quality residential facilities on campus. Alumni Tower Students recognized the challenges to personal privacy while using the community bathrooms but recognized that the building s condition was better than the condition of Wilson Hall. The tower is known for its all-male resident demographic. Some recognized that a strong community existed at Alumni Tower because many residents leave their doors open. Cooper Hall Some students noted that the water temperature was sometimes unreliable. Normal Hall One student described it as very nice but a little small and also requested the addition of an elevator. Some students with families were concerned about other students driving in parking lots where their children were sometimes present. Students recognized the cost savings available through living in Normal Hall versus Eagle Lake Apartments. Eagle Lake Apartments Students agreed that the insulation between units could be improved. Students appreciate the cleanliness, unit layout, garbage disposal, kitchen, and dishwashers. Students would like to have a laundry card machine and an ATM in the building. Gilley Apartments Students described Gilley as similar to living in an off-campus apartment, but they appreciated the convenience of paying one bill for the entire semester. 7. How much are you willing to pay for improved on-campus housing? Morehead State University Comprehensive Housing Master Plan D. 4
38 FOCUS GROUP REPORT Many felt that students would not be willing to pay more for new residence halls and apartments. Some students indicated they would be willing to pay up to $300 per semester more to live in new apartment-style buildings on-campus. 8. Why do students live on-campus? Students with families perceived that living on campus was safer and quieter than in the off-campus market. Many students live on campus so that they do not need to spend money commuting. Many students praised the good work by maintenance services and cleaning staff. Students appreciated the free laundry day. Some upperclass students moved back on-campus after experiencing poor conditions, lack of property manager responsiveness, and the presence of slum lords in the off-campus market. Ability to get involved in campus activities was cited as a reason why students choose to live on campus. Some students appreciated that smoking was prohibited. Some students described living on-campus as a test of maturity and independence versus living at home. Many students felt that it was easier to meet more people while living on campus. Some students felt that it was more affordable to live on campus. 9. Describe the options available in the off-campus market. Students thought that Pinnacle Apartments compares to Eagle Lake in terms of quality. One student paid $519 per month for a two-bedroom off-campus apartment. Another paid $300 per month for an off-campus studio apartment. Many students commented on landlords who subdivide single family houses and create multiple single leases for many people. Some participants thought that quite a few students live in trailers. Most students agreed that all of the off-campus apartments are student friendly. 10. Why do students live off-campus? Students with families thought that younger students live off-campus in order to be able to drink alcohol, have parties, and have no rules. Students commonly cited more freedom, no smoking rules, no one looking over their shoulder as main reasons students live off campus. Many students felt that living off-campus was a rite of passage. Students who used their cars regularly appreciated the availability of parking proximate to their units. Students who were over the age of 21 felt that they should be able to have alcohol in their rooms if they chose to do so. Many students felt that they would have more control over who their roommates were in the off-campus apartments. Morehead State University Comprehensive Housing Master Plan D. 5
39 FOCUS GROUP REPORT One student stated that her grades and health have improved since she moved off-campus because she has not had to deal with problematic roommates. 11. How do you feel about the existing residence life programming? Students recognized that some programs are mandatory. The level of students interest was contingent on the subject matter. Some students thought that the programming should be mandatory for freshmen. 12. Describe campus life outside of class. Participants indicated that about 50% of students stay on campus during the weekends. One student thought that the town of Morehead doesn t want students to stay on weekends. Other students disagreed, recognizing that the students support the local economy. Most students thought that the free movies were good. Some students stay on campus for activities, such as the color guard. Other students go home to work on weekends because they had pre-existing jobs. Many students felt that MSU is a leave on the weekend school because there are few on-campus activities on the weekends. Students felt that there should be a place to hang out, perhaps a place for dances. Many students thought that there should be a passive recreation area in ADUC, such as a game room. Students who do stay on the weekends try to make the best of the opportunity, noting that campus is more peaceful when fewer students are around. They also appreciated the movies on Friday night. Higher gas prices were commonly cited as a reason for students to stay oncampus during the weekends. 13. What is your perception of on-campus dining? What is your preferred location? Many students were disappointed that the dining options at ADUC close early at night and are not open on weekends. Students who were not on meal plans thought that it was very expensive to purchase meals at Alumni Hall. Students with families would appreciate a modified meal plan that would allow their spouses to utilize campus dining services. One student was concerned about how food on the meal plans is double-taxed and thus more expensive. Some students felt that the quality of the food was average. Many students thought they would use community kitchens in the residence halls. Students felt that the range of offerings at ADUC was good. Morehead State University Comprehensive Housing Master Plan D. 6
40 FOCUS GROUP REPORT Some students thought it would be advantageous to use the meal plan at offcampus establishments. Few upperclassmen were on meal plans. Morehead State University Comprehensive Housing Master Plan D. 7
41 Results from Morehead State University Housing Survey Total Responses: 1167 Q1 Q2 Q3 Q4 Q5 How important was the availability of on-campus housing in your decision to attend MSU? SELECT ONE Very Important % Important % Somewhat Important % Not at all Important % When you first decided to attend MSU, how did you learn about your housing options? MSU Application Materials % Friends / Acquaintances % MSU Campus Tour % MSU Admissions Presentation % MSU website % Other website % MSU Faculty / Staff % Other % I did not learn about housing options % Please indicate where you currently live SELECT ONE Alumni Tower % Butler Hall % Cartmell Hall % Cooper Hall % Fields Hall % Gilley Apartments % Mays Hall Apartments % Mignon Tower % West Mignon Hall % East Mignon Hall % Mignon Hall % Nunn Hall % Thompson Hall % Eagle Lake Apartments % Normal Hall % Off-campus % Off-campus Greek-affiliated housing % How would you describe your current living conditions? SELECT ONE Excellent % Good % Fair % Poor % Do you own a vehicle? SELECT ONE Yes % No %
42 Q6 Please rate each of the following factors on how important they were in your decision of where to live this year: Total cost of rent and utilities Very Important % Important % Somewhat Important % Not at all Important % Variety and availability of different types of housing (e.g.: apartments, houses, etc.) Very Important % Important % Somewhat Important % Not at all Important % Proximity to classes Very Important % Important % Somewhat Important % Not at all Important % Proximity to other students Very Important % Important % Somewhat Important % Not at all Important % Proximity to or availability of parking Very Important % Important % Somewhat Important % Not at all Important % Proximity to campus activities Very Important % Important % Somewhat Important % Not at all Important % Proximity to work Very Important % Important % Somewhat Important % Not at all Important % Proximity to / availability of child care Very Important % Important % Somewhat Important % Not at all Important % Availability of high speed internet access Very Important % Important % Somewhat Important % Not at all Important % Maintenance, repairs, and general condition of building Very Important % Important % Somewhat Important % Not at all Important % Custodial services/cleanliness Very Important % Important % Somewhat Important % Not at all Important %
43 Availability of educational and leadership opportunities Very Important % Important % Somewhat Important % Not at all Important % Less restrictive rules and supervision Very Important % Important % Somewhat Important % Not at all Important % Ability to stay during breaks Very Important % Important % Somewhat Important % Not at all Important % Availability of a quiet place to study Very Important % Important % Somewhat Important % Not at all Important % Access to resources and information Very Important % Important % Somewhat Important % Not at all Important % Ability to become involved in campus and housing communities (including: programs, organizations, etc.) Very Important % Important % Somewhat Important % Not at all Important % Safety / security Very Important % Important % Somewhat Important % Not at all Important % Single bedroom Very Important % Important % Somewhat Important % Not at all Important %
44 Private bedroom Very Important % Important % Somewhat Important % Not at all Important % Private living room space Very Important % Important % Somewhat Important % Not at all Important % Kitchen Very Important % Important % Somewhat Important % Not at all Important % Sufficient space Very Important % Important % Somewhat Important % Not at all Important % Large number of washers / dryers in one room in the residence hall building Very Important % Important % Somewhat Important % Not at all Important % Washers / dryers on my floor Very Important % Important % Somewhat Important % Not at all Important % Washer / dryer hook-ups in my apartment Very Important % Important % Somewhat Important % Not at all Important % Q7 Please rate how important each of the following factors should be to the University as it considers improvements to on-campus housing: Provide housing that is suitable for juniors, seniors, and graduate students Very Important % Important % Somewhat Important % Not at all Important % Provide modern and attractive living environments to students Very Important % Important % Somewhat Important % Not at all Important % Create more living-learning communities Very Important % Important % Somewhat Important % Not at all Important %
45 Help retain students at MSU Very Important % Important % Somewhat Important % Not at all Important % Increase the residential population of students on-campus Very Important % Important % Somewhat Important % Not at all Important % Make MSU more attractive to prospective students Very Important % Important % Somewhat Important % Not at all Important % Keep housing affordable Very Important % Important % Somewhat Important % Not at all Important % Provide housing for non-traditionally aged students Very Important % Important % Somewhat Important % Not at all Important % Provide housing for student families Very Important % Important % Somewhat Important % Not at all Important % Provide on-campus Greek housing Very Important % Important % Somewhat Important % Not at all Important % Q8 How interested would you be in each of the following housing opportunities? Living with people within your college and major Very Interested % Interested % Somewhat Interested % Not Interested % Living with people with related majors Very Interested % Interested % Somewhat Interested % Not Interested % Living with people with related career or professional interests Very Interested % Interested % Somewhat Interested % Not Interested %
46 Living with people with related social or organizational interests Very Interested % Interested % Somewhat Interested % Not Interested % Living with students of different years (freshmen, sophomores, juniors, seniors) Very Interested % Interested % Somewhat Interested % Not Interested % Additional Residential Living academic programming Very Interested % Interested % Somewhat Interested % Not Interested % Additional Residential Living social programming Very Interested % Interested % Somewhat Interested % Not Interested % Taking core academic classes with people with whom you live Very Interested % Interested % Somewhat Interested % Not Interested % Having supplemental instruction available in the building or complex Very Interested % Interested % Somewhat Interested % Not Interested % Informal faculty-led discussion groups Very Interested % Interested % Somewhat Interested % Not Interested % Living in a residence hall with faculty, advisors, and / or senior scholars Very Interested % Interested % Somewhat Interested % Not Interested % Living in a co-ed building Very Interested % Interested % Somewhat Interested % Not Interested % Living in a single-sex building Very Interested % Interested % Somewhat Interested % Not Interested %
47 Classroom/workspace in the residence hall/apartment complex Very Interested % Interested % Somewhat Interested % Not Interested % Q9 Q10 Q11 Q12 Q13 Which of the below best reflects your opinion? SELECT ONE Keeping housing costs low is more important than providing a wide range of amenities % Offering a wide range of amenities is more important than keeping housing costs low % Neither of the above, a balance of housing costs and amenities is preferable % How far from campus do you currently live? SELECT ONE Less than 2 miles from the MSU campus % 2-10 miles from the MSU campus % miles from the MSU campus % miles from the MSU campus % miles from the MSU campus % More than 75 miles from the MSU campus % What type of unit do you live in? SELECT ONE Apartment / condo (rented) % Apartment / condo (owned) % Apartment / condo (parent-owned) % House (rented) % House (owned) % House (parent-owned) % Mobile home % Other % How many bedrooms are there in the unit where you currently live? SELECT ONE 1 room / studio % 1 bedroom % 2 bedrooms % 3 bedrooms % 4 or more bedrooms % With whom do you currently live off campus? SELECT ONE I live alone % With other MSU student(s) % With roommate(s) who are not students at MSU % With my parent(s) or other relative(s) % With my spouse / partner and /or children %
48 Q14 Q15 Q16 Q17 Q18 With how many people do you share your cost of rent? SELECT ONE No other people % % % % % 5 or more % What is your personal share of monthly rent / housing costs, ***excluding utilities***? SELECT ONE Less than $ % $100 - $ % $200 - $ % $300 - $ % $400 - $ % $500 - $ % $600 - $ % $700 - $ % $800 - $ % $900 - $ % $1,000 or more % Don't know % Which of the following utilities do you currently pay for, in addition to your rent? Cable / Satellite Television % Gas % Internet % Electric % Water % Sewer % Trash % How much is your average monthly total bill for all utility costs (that you selected in the previous question)? SELECT ONE Less than $ % $25 - $ % $50 - $ % $100 - $ % $150 - $ % $200 or more % Don't know % How long is your current lease? SELECT ONE 12 months % Academic year / 9 months % Month-to-month % Other % Not applicable %
49 Q19 Q20 What was the total deposit amount required for your current lease? SELECT ONE None required % Less than $ % $50 - $ % $100 - $ % $150 - $ % $200 - $ % $250 - $ % $300 - $ % $350 - $ % $500 - $ % $550 - $ % $600 - $ % $700 - $ % $800 - $ % $900 - $ % $1,000 or more % Don't know % If MSU built new housing, which five features would be the most important to you? Single bedroom % Private bathroom % Kitchen % Living room % Additional storage space % Fitness center in building / complex % Computer lab in building / complex % Not having to purchase any kind of meal plan % Dining services nearby % Retail nearby % Air conditioning % Parking garages % Quiet study area in building % Classrooms / academic facilities in building % Large number of washers / dryers in one central location % Washers / dryers on my floor % Washer / dryer hook-ups in the apartment % Washer / dryer in the apartment % Social lounge / TV room in building % In-room Internet access % Furnished room/apartment % Unfurnished room/apartment % 24-hour on-site staff % Other % Not interested in MSU campus housing %
50 Q21 Q22 Q23 Q24 If all of the unit types described above were available on the MSU campus, what would have been your preferred housing configuration for this academic year ( )? SELECT ONE Unit 1A - Traditional Double % Unit 2A - Traditional Single % Unit 1B - Suite Quad % Unit 2B - Suite Double % Unit 1C - Suite Double % Unit 2C - Suite Single % Unit 1D - 4-BR Apartment % Unit 1E - 1-BR Apartment % Unit 1F - 2-BR Apartment % Unit 1G - 3 BR Townhouse % Would still prefer to live off-campus % If you selected a suite or apartment, how many other people would you want in the unit? SELECT ONE Not applicable % No other people % 1 other person % 2 other people % 3 other people % 4 other people % 5 or more other people % If you selected a suite or apartment, how many bedrooms would you want in the unit? SELECT ONE Not applicable % 1 bedroom % 2 bedrooms % 3 bedrooms % 4 bedrooms % If your preferred unit type were unavailable, what would your second choice have been for this academic year ( )? SELECT ONE Unit 1A - Traditional Double % Unit 2A - Traditional Single % Unit 1B - Suite Quad % Unit 2B - Suite Double % Unit 1C - Suite Double % Unit 2C - Suite Single % Unit 1D - 4-BR Apartment % Unit 1E - 1-BR Apartment % Unit 1F - 2-BR Apartment % Unit 1G - 3 BR Townhouse % Would still prefer to live off-campus %
51 Q25 Q26 Q27 Q28 Q29 If you indicated your preference for off-campus housing in Question 21, please indicate why? Not applicable - I indicated preference for on-campus housing % On-campus housing policies % Better location % Closer to my work % More available parking % Lower cost % To avoid a wait list % Faster Internet access % Better study atmosphere/less noise % To live with friends % To have more privacy % To have a living room space % To prepare my own meals % To have a kitchen % To have a washer / dryer in the unit % Physical condition of University residence facilities % Better accessibility for those with physical disabilities % To have more freedom / independence % To establish (state name) state residency % I am graduating from MSU % Leaving MSU % Other % Which lease term do you prefer (inclusive of break periods)? SELECT ONE 9-month lease % 12-month lease % Semester-based lease % Month-to-month % Are you interested in summer lease? SELECT ONE Yes % No % How important was the availability in on-campus family housing in your decision to attend MSU? SELECT ONE Very Important % Important % Somewhat Important % Not at all Important % If on-campus family housing were not available, what would you have done this academic year? SELECT ONE Lived in an off-campus apartment % Lived in an off-campus house % Attended another college or university that provided on-campus family housing % I would not have attended any college or university % I do not live in on-campus family housing %
52 Q30 Q31 Q32 Q33 Q34 Q35 Q36 Are you currently in a meal plan? SELECT ONE Yes % No % How would you describe the quality of dining offerings at MSU? SELECT ONE Excellent % Good % Fair % Poor % Do not take advantage of dining offerings at MSU % How important would it be to locate new housing near campus dining options? SELECT ONE Very Important % Important % Somewhat Important % Not at all Important % Do you belong to a fraternity or sorority? SELECT ONE Yes % No % No, but I plan to join one this year % If an on-campus, University Greek Housing were provided, what would be your interest in living there? SELECT ONE Very Interested % Interested % Somewhat Interested % Not at all Interested % When you would use the Student Recreation Center, where would you typically be coming from: SELECT ONE Classrooms / Academic buildings % ADUC (Adron Doran University Center) % On campus housing % Off campus apartment / home within a 5 minute drive of campus % Off campus apartment / home within more than a 5 minute drive of campus % Other location % Of the following locations, which would be your preferred location for the Student Recreation Center: SELECT ONE Adjacent to ADUC (Adron Doran University Center) % Behind the Camden-Carroll Library % Adjacent to Cartmell Hall and the Police Department % Adjacent to the existing wellness center % Within the existing neighborhood of residence halls on campus % Other location %
53 Q37 Q38 Q39 Q40 Q41 Q42 Q43 What is your gender/sex? SELECT ONE Male % Female % What is your age? SELECT ONE 18 or under % % % % % % % 25 or older % What is your class status? SELECT ONE Freshman % Sophomore % Junior % Senior % Graduate % Other % At what MSU campus are most of your classes? SELECT ONE Morehead % West Liberty % Ashland % Mt. Sterling % Jackson % Prestonburg % What is your enrollment status? SELECT ONE Full-time % Part-time % In which college are you enrolled? SELECT ONE College of Humanities % College of Business % College of Education % College of Science and Technology % Institute for Regional Analysis and Public Policy % Undecided % What is your marital and family status? SELECT ONE Single without children % Single with children % Married / partner without children % Married / partner with children % Other %
54 Q44 What is your ethnic background? SELECT ONE Black, non-hispanic % American Indian or Alaskan Native % Asian Pacific Islander % Hispanic % White, non-hispanic % Other % Prefer not to answer % Q45 What is your local (academic year) ZIP code? Top 13 zip codes Q46 Where is your permanent residence / home? SELECT ONE Rowan County % Bath, Menifee, Morgan, Elliot, Carter, Lewis, and Fleming Counties % Elsewhere in Eastern Kentucky % Elsewhere in Kentucky % Tennessee % Ohio % West Virginia % Elsewhere in USA % Outside of USA % Q47 Please let us know if you have any other comments regarding current or future housing at MSU: % Q48 Where do you currently live? SELECT ONE On-campus % Off-campus %
55 Section E
56 This page intentionally blank
57 SURVEY ANALYSIS OBJECTIVES AND METHODOLOGY B&D conducted electronic surveys via the Internet that tested students housing preferences. Survey questions were designed to assess current housing preferences, housing selection criteria, price sensitivity, and unit type preferences. Response options were structured to maximize information in the projection of desirable facility characteristics and demand for specific housing and amenities. All of the responses could be sorted by various demographic characteristics to identify discrepancies in demand results. The survey was ed to all MSU students. In total, 1,167 student surveys were completed and compiled in the survey results. The number of responses represents 15% of the Morehead student population. Survey responses were collected only in the electronic format. The surveys remained on-line for a period of two weeks. The total number of student survey responses generated a margin of error of +/-2.9% assuming a 95% confidence interval based on the total headcount of 7,452 students on the Morehead campus. In the analysis of the demographic breakdown of the student survey response group versus the overall student population the following discrepancies were identified: Female students were overrepresented while male students were underrepresented; Freshmen were overrepresented while seniors were slightly underrepresented; Full-time student were overrepresented while part-time students were underrepresented; Students from Kentucky were underrepresented while students from Ohio were overrepresented. All other demographic discrepancies fall within +/-5% margin of over/underrepresentation. A comparison of the student survey demographics versus MSU demographics and survey responses are included in the exhibits following this text. OVERALL FINDINGS According to survey responses, the availability of oncampus housing was very important to more than a third (36%) of survey respondents. More than a quarter (26%) of survey participants believed the availability of on-campus housing was important. The third highest (20%) response was not at all important. Somewhat Important 18% Not at all Important 20% Important 26% Very Important 36% Survey respondents were generally positive when describing their current living conditions. Almost half (49%) of survey participants described their current living conditions as good. The next highest (25%) responses were those that described their living conditions as excellent. Only a few (3%) respondents chose poor. Many students bring an automobile with them to campus as most of the survey respondents (85%) own a car. Morehead State University Comprehensive Housing Master Plan E. 1
58 SURVEY ANALYSIS A majority of students (53%) live less than 10 miles from the MSU campus. There are also some student populations that live miles (20%) and miles (15%) from campus. The students that live further from campus are more likely to opt for on-campus housing. When asked their interest in on-campus Greek housing (right), the majority of students (73%) were not at all interested. Further analysis of those that responded very interested (11%) reflects a preference for apartment style living. Almost half (49%) of those very interested in on-campus Greek housing showed a preference for single-student apartments. Off-Campus Students Not at all Interested 73% Very Interested 11% Interested 7% Somewhat Interested 9% In general, off-campus students tend to live in offcampus apartments with multiple roommates. The highest percentage (26%) of off-campus survey participants rent an apartment, followed by a portion (20%) of off-campus students that live with their parents. Other living arrangements include renting a house (19%), living in a mobile home (16%), and owning a house (16%). Almost half (43%) of off-campus survey respondents live in three bedroom units and almost a third (30%) live in two bedroom units (right). 4 or more bedrooms 18% 3 bedrooms 43% 1 room / studio 3% 1 bedroom 5% 2 bedrooms 30% Off-campus students pay a range of rents according to survey responses. The most commonly (21%) paid monthly rent is $200 - $299. The next most frequently paid rents are less than $100 (19%) and $100-$199 (18%). Average monthly utility costs also vary with the most common (26%) cost being $200 or more. Other common monthly utility costs include $50-$99 (20%) and $100-$149 (17%). Apartment leases are typically one year in length with some landlords offering month-to-month leases. More than one quarter (26%) of survey respondents have 12-month leases while some students (13%) have month-to-month leases. Few (5%) survey respondents have 9-month or academic lease terms. Morehead State University Comprehensive Housing Master Plan E. 2
59 SURVEY ANALYSIS Location Preferences, Housing Selection Criteria, and Features The following ranking of housing opportunities is based on the percentages of survey respondents that were very interested and interested in the presented housing factors (top 10 opportunities are shown): Housing Opportunity % 1. Living in a co-ed building 76% 2. Classroom/workspace in the residence hall/apartment complex 62% 3. Living with people with related social or organizational interests 56% 4. Living with people within your college and major 49% 5. Living with people with related majors 48% 6. Living with people with related career or professional interests 47% 7. Having supplemental instruction available in the building or complex 44% 8. Taking core academic classes with people with whom you live 42% 9. Additional Residential Living social programming 34% 10. Living with students of different years (freshmen, sophomores, juniors, seniors) 33% In the survey, students were presented with a variety of potential housing features to be offered in the new units. The following ranking is based on the percentages of respondents expressing high interest and somewhat high interest in those features (top 10 features are shown): Important Factors % 1. Sufficient space 87% 2. Safety / security 84% 3. Maintenance, repairs, and general condition of building 84% 4. Custodial services/cleanliness 82% 5. Availability of a quiet place to study 75% 6. Total cost of rent and utilities 72% 7. Availability of high speed internet access 72% 8. Proximity to classes 66% 9. Less restrictive rules and supervision 65% 10. Access to resources and information 65% Morehead State University Comprehensive Housing Master Plan E. 3
60 SURVEY ANALYSIS Students were also asked to name the five features they believe to be the most important. The following ranking of housing features is based on the percentage of students who selected that housing feature (top 5 features are shown): Housing Features % 1. Air conditioning 62% 2. In-room Internet access 55% 3. Private bathroom 52% 4. Kitchen 46% 5. Living room 36% Dining Analysis A majority (61%) of students currently use meal plans. Not surprisingly, most (97%) of the students that have meal plans also live on campus. When asked about the quality of MSU dining offerings, the largest percentage (38%) of students described the offerings as fair. The next highest number (34%) of students believed dining offerings were good. Twice the number of students described the dining offerings as poor rather than excellent (12% versus 6%, respectively). Do not dine at MSU 10% Interestingly, when students dining opinions were cross-referenced with where they lived, the majority (28%) of off-campus students described MSU dining offerings as good. More than a quarter (27%) of off-campus students believed the food options were fair. For on-campus students, the majority (41%) used fair to describe their MSU dining options. Slightly fewer (36%) students believed their food offerings were good. When asked where new housing should be located, 59% of students thought it was very important or important for new housing to be located near campus dining options. A moderate number (26%) of survey participants believed new housing s proximity to dining was only somewhat important. Preferred Housing Options Poor 12% Fair 38% Somewhat Important 26% Not at all Important 14% Excellent 6% Good 34% Very Important 22% Important 38% Six proposed on-campus unit layouts were presented to students. Each layout was accompanied by a brief description of rental rates, lease terms, and utilities included. Students were asked about their preferences for the academic year 2005/2006 Morehead State University Comprehensive Housing Master Plan E. 4
 1A - Double Approximate rent: $1,200-$1,300 / semester / person 5% of survey respondents indicated that they would")

61 SURVEY ANALYSIS A. Traditional Double (one shared bedroom with a community bathroom on each floor) 1A - Double Approximate rent: $1,200-$1,300 / semester / person 5% of survey respondents indicated that they would prefer to live in this unit this academic year ( ). 2A - Single Approximate rent: $1,800 - $1,900 / semester / person 5% of survey respondents indicated that they would prefer to live in this unit this academic year ( ). B. Semi-Suite (two shared bedrooms with a shared bathroom in the unit but no living room or kitchen). 1B - Double Approximate rent: $1,500-$1,600 / semester / person 6% of survey respondents indicated that they would prefer to live in this unit this academic year ( ). 2B - Single Approximate rent: $1,900-$2,000 / semester / person 5% of survey respondents indicated that they would prefer to live in this unit this academic year ( ). C. Suite with Bathroom and Living Room (Full-Suite) (one shared bedroom with shared bathroom and living room in the unit but no kitchen). 1C - Quad (4 students) Approximate rent: $1,200-$1,300 / person / semester Morehead State University Comprehensive Housing Master Plan E. 5
 Approximate rent: $1,850-$1,950 / person / semester 5% of survey respondents indicated that they would prefer to live in this unit this")

62 SURVEY ANALYSIS 6% of survey respondents indicated that they would prefer to live in this unit this academic year ( ). 2C - Semi-Private (2 students) Approximate rent: $1,850-$1,950 / person / semester 5% of survey respondents indicated that they would prefer to live in this unit this academic year ( ). D. 4-Bedroom Apartment (for Single Students) (four shared bedrooms with two bathrooms in the unit and a living room and kitchen). 1D - Single - Approximate rent: $2,000-$2,100 / semester / person 29% of survey respondents indicated that they would prefer to live in this unit this academic year ( ). Morehead State University Comprehensive Housing Master Plan E. 6
 (one bedroom with one bathroom in the unit and a living room and kitchen) 1E Approximate rent: $500-$600 / month / family 3% of survey respondents")
 (two bedrooms with two bathrooms in the unit and a living room and kitchen).")
63 SURVEY ANALYSIS E. 1-Bedroom Apartment (for Student Families) (one bedroom with one bathroom in the unit and a living room and kitchen) 1E Approximate rent: $500-$600 / month / family 3% of survey respondents indicated that they would prefer to live in this unit this academic year ( ). F. 2-Bedroom Apartment (for Student Families) (two bedrooms with two bathrooms in the unit and a living room and kitchen). 1F Approximate rent: $700-$800 / month / family 3% of survey respondents indicated that they would prefer to live in this unit this academic year ( ). G. 3-Bedroom Townhouse (for Single Students or Student Families) (three bedrooms with two shared bathrooms in the unit and a living room and kitchen). Morehead State University Comprehensive Housing Master Plan E. 7
 preferred to have three other people living with them, followed by one other person living with them (22%).")
64 SURVEY ANALYSIS 1G Single Approximate rent: $2,150 - $2,250 / semester / person 12% of survey respondents indicated that they would prefer to live in this unit this academic year ( ). Of those who selected a suite or apartment, most of the respondents (31%) preferred to have three other people living with them, followed by one other person living with them (22%). Of those that selected a suite or apartment, the most frequently (33%) selected number of preferred bedrooms was two, followed by four (25%). Detailed discussion of quantified demand for each of the presented units is included in the Demand Analysis section of this report. Morehead State University Comprehensive Housing Master Plan E. 8
65 Morehead State University Student Housing Master Plan Potential On-Campus Housing Demand Current Class Enrolled Capture On-Campus Population Rate Population Undergraduate - Freshmen 2,143 62% 1,324 Undergraduate - Sophmore 1,384 39% 536 Undergraduate - Junior 1,262 30% 376 Undergraduate - Senior 1,734 17% 297 Graduate % 80 Other 171 4% 6 Total Campus Population 7,452 35% 2, through Distribution of Demand Current Current Maximum Single-Student Units Family Units Class Enrollment Capture Demand Traditional Double Traditional Single Semi-Suite Double Semi-Suite Single Suite Quad Suite Double 4-BR Apartment 1-BR Apartment 2-BR Apartment Townhouse Rate Undergraduate - Freshmen 2,143 68% Undergraduate - Sophomore 1,384 42% Undergraduate - Junior 1,262 38% Undergraduate - Senior 1,734 29% Total Undergraduate 6,523 46% 3, Graduate % Actual Beds Provided by Unit Type - Current 3,690 1, , Current Surplus / (Deficit) of Beds 669 1,687 (97) (607) (346) 940 (310) (491) 9 (1) (265)
66 Section F
67 This page intentionally blank
68 DEMAND ANALYSIS OBJECTIVES & METHODOLOGY B&D developed a student housing demand model to project the specific quantity of demand for each unit type, either existing or considered for future development. The model projects demand under the assumption that housing would be designed to match students preferences closely in the future. The model derives demand based on responses from the student survey, as well as enrollment figures provided by the University. These figures may be analyzed in the future as necessary to reflect changes in enrollment. CAPTURE RATES AND DEMAND/SUPPLY RECONCILIATION The model allowed B&D to analyze each class to project demand. The capture rates reflect the percentages of students, within the target market, indicating their intention to live in the proposed units. For example, the number of all juniors included in the target market and interested in living in the proposed units, divided by the junior sample size results in the capture rate for the current academic year. Later, the capture rates are applied to the enrollment figures for each class. The projected demand is multiplied by weight factors to ensure a demographic balance between the survey respondents and the entire target market population. At the conclusion, the demand is reconciled with the supply to demonstrate potential surpluses and deficits. TARGET MARKET & CAPTURE RATE CONSIDERATIONS Although B&D surveyed the entire MSU student population, certain demographic groups were excluded from the target market. The target market was narrowed down to the following groups of students: Only students enrolled on the Morehead campus; Only full-time students; Only renters (both on- and off-campus). In addition to the above criteria, B&D determined that the lowest on-campus rental rate, inclusive of utility charges is approximately $200 per month for single student units and $400 for family units. Therefore, off-campus students who indicated their preference to live on campus and who currently pay less than the above rates were excluded from the target market as the future on-campus housing accommodations are likely to be unaffordable to them. Furthermore, B&D, in consultation with the project committee, determined that freshmen would not be allowed in apartment-style housing and, therefore, reallocated freshmen demand for apartments into units types selected as the students second choices. Morehead State University Comprehensive Housing Master Plan F. 1
 attending classes on the Morehead campus, exclusive of the distance learners, is expected to remain at the current level during the course of the next ten")
69 DEMAND ANALYSIS ENROLLMENT TRENDS As the enrollment figures have critical impact on demand for on-campus living, B&D analyzed the future enrollment projections provided by MSU. The total enrollment of students (headcount) attending classes on the Morehead campus, exclusive of the distance learners, is expected to remain at the current level during the course of the next ten years. QUANTIFIED DEMAND In the Fall of 2005, approximately 2,620 students resided on campus. This number translated into a 35% capture rate, inclusive of both undergraduate and graduate students. The demand model shows that, if appropriate units were provided, MSU could capture up to 3,185 residents, 46% of the undergraduate student population and 22% of its graduate students. Since the enrollment projections are flat, these capture rates translate into a steady demand through 2014/2015. Morehead State University Comprehensive Housing Master Plan F. 2
70 DEMAND ANALYSIS The demand analysis for individual unit types revealed the following: Surplus of nearly 1,700 community-style (traditional) beds in double-occupancy rooms; Deficit of nearly 100 community-style (traditional) beds in single-occupancy rooms; Deficit of over 600 semi-suite-style beds in double-occupancy rooms; Deficit of over 340 semi-suite-style beds in single-occupancy rooms; Surplus of over 900 suite-style beds in quad-occupancy rooms; Deficit of over 300 suite-style beds in double-occupancy rooms; Deficit of nearly 500 apartment-style beds for upper classmen. B&D s model also demonstrated a relative balance between the demand and supply of family units, with a slight surplus of one-bedroom apartments. During the course of the analysis, B&D established three reference points with respect to the size of MSU s housing program: Current design capacity of 3,690 beds (including Waterfield, Regents, and Wilson); Maximum market demand of approximately 3,185 beds; and Institutional objectives of housing the minimum of 35% of its student population, which translates into approximately 2,600 beds. The project committee, with B&D s input, established a housing capacity target between 2,600 and 3,185 beds upon the full build-out of the housing master plan in 2014/2015. Morehead State University Comprehensive Housing Master Plan F. 3
71 Morehead State University Comprehensive Housing Master Plan Off-Campus Housing Survey Selected Student Oriented Properties No. Property Address One Bedroom Rent Two Bedroom Rent Three Bedroom Rent Studio Rent Per Month Semester* Per Month Semester* Per Month Semester* Per Month Semester* S. Blair Avenue $500 $2, Tippet Street $450 $2, , 324, 326 Tripplet Street $450 $2, West First Street $450 $2, West First Street $500 $2, Copperas Hollow Road $400 $1,800 7 Brass Eagle Apartments $388 $1,746 $450 $2,025 8 Cedar Creek Village $420 $1,890 $490 $2,205 $530 $2,385 9 Creekside Simplex Apartments $635 $2, Creekside Townhouses $645 $2, Creekside Value Apartments $535 $2, Divide Hill Duplex $550 $2, Mountain View $303 $1,364 $335 $1,508 $340 $1, Pinecrest $410 $1,845 $460 $2, Pine Oak Townhomes $650 $2,925 $850 $3, Pinnacle $500 $2, Sycamore Townhomes $530 $2, Towne Place $360 $1,620 $340 $1, TracSide $390 $1,755 $325 $1, Whispering Pines $485 $2,183 average rent: $379 $1,703 $501 $2,254 $690 $3,105 $335 $1,508 average rent per person: $379 $1,703 $250 $1,127 $230 $1,035 $335 $1,508 Notes: *Semester rate was obtained by multiplying landlord-quoted monthly rate times 4.5 months per semester. NP = Not provided N/A = Not applicable
72 Morehead State University Comprehensive Housing Master Plan Off-Campus Housing Survey Selected Student Oriented Properties Security Utilities Number of No. Property Address Deposit Included Units Notes Required S. Blair Avenue $400 w, s, t 10 Hollan Properties Tippet Street $400 no 4 Hollan Properties 3 322, 324, 326 Tripplet Street $400 w, s, t 16 Hollan Properties West First Street $400 w,s,t 4 Hollan Properties West First Street $400 w,s,t 4 Hollan Properties Copperas Hollow Road $400 no 8 Hollan Properties 7 Brass Eagle Apartments NP w,g,e 18 8 Cedar Creek Village $300 no NP Houses 9 Creekside Simplex Apartments $525 w,s,t,e 40 Creekside Realty 10 Creekside Townhouses $525 w,s,t,e 34 Creekside Realty 11 Creekside Value Apartments $525 w,s,t,e 26 Creekside Realty 12 Divide Hill Duplex $450 w,s,t,g NP 13 Mountain View NP w,s,t NP Rents based on income 14 Pinecrest $300 w,s,t,g NP 15 Pine Oak Townhomes $500 no NP 16 Pinnacle $300 t % occupied 17 Sycamore Townhomes $400 no NP 18 Towne Place $250 no NP Abner Apartments 19 TracSide $300 w,s,t,g NP Abner Apartments 20 Whispering Pines $450 w,s,t,g NP Notes: NP = Not provided N/A = Not applicable Legend: w = water t = trash e = electricity s = sewer g = gas
73 Morehead State University Comprehensive Housing Master Plan Off-Campus Housing Survey Selected Student Oriented Properties - Studio/1BR No. Property Address One Bedroom Rent Studio Rent Per Month Semester* Per Month Semester* 1 Brass Eagle Apartments $388 $1,746 2 Cedar Creek Village $420 $1,890 3 Mountain View $303 $1,364 $340 $1,530 4 Pinecrest $410 $1,845 5 Towne Place $360 $1,620 $340 $1,530 6 TracSide $390 $1,755 $325 $1,463 average rent: $379 $1,703 $335 $1,508 average rent per person: $379 $1,703 $335 $1,508 Notes: *Semester rate was obtained by multiplying landlord-quoted monthly rate times 4.5 months per semester. NP = Not provided N/A = Not applicable
74 Morehead State University Comprehensive Housing Master Plan Off-Campus Housing Survey Selected Student Oriented Properties - 2BR No. Property Address Two Bedroom Rent Per Month Semester* S. Blair Avenue $500 $2, Tippet Street $450 $2, , 324, 326 Tripplet Street $450 $2, West First Street $450 $2, West First Street $500 $2, Copperas Hollow Road $400 $1,800 7 Brass Eagle Apartments $450 $2,025 8 Cedar Creek Village $490 $2,205 9 Creekside Simplex Apartments $635 $2, Creekside Townhouses $645 $2, Creekside Value Apartments $535 $2, Divide Hill Duplex $550 $2, Mountain View $335 $1, Pinecrest $460 $2, Pine Oak Townhomes $650 $2, Pinnacle $500 $2, Sycamore Townhomes $530 $2, Whispering Pines $485 $2,183 average rent: $501 $2,254 average rent per person: $250 $1,127 Notes: *Semester rate was obtained by multiplying landlord-quoted monthly rate times 4.5 months per semester. NP = Not provided N/A = Not applicable
75 Morehead State University Comprehensive Housing Master Plan Off-Campus Housing Survey Selected Student Oriented Properties No. Property Address Three Bedroom Rent Per Month Semester* 1 Cedar Creek Village $530 $2,385 2 Pine Oak Townhomes $850 $3,825 average rent: $690 $3,105 average rent per person: $230 $1,035 Notes: *Semester rate was obtained by multiplying landlord-quoted monthly rate times 4.5 months per semester. NP = Not provided N/A = Not applicable
76 Section G
77 This page intentionally blank
78 OFF-CAMPUS HOUSING OBJECTIVES The objective of the off-campus housing market analysis was to identify the nature of the private rental housing market, allowing a comparison of non-university housing options that are available to students at Morehead State University. Data was collected for the neighborhoods surrounding the campus that were most likely to be populated with University students. METHODOLOGY Through community tours, conversations with students, and internet searches B&D analyzed the quality of 20 apartment complexes that were further categorized by property manager or individual apartment facilities. Three property managers own 12 apartment facilities and another nine apartment communities were not affiliated with a property manager. Quantitative information, such as rental rates, lease terms, and amenities, were also analyzed and compared to on-campus rental rates. Property Managers # of Properties 1. Abner Apartment Rentals 7 2. Creekside Realty 3 3. Hollan Properties 2 Individual Apartment Facilities 1. Cedar Creek Apartments 2. Divide Hill Duplex 3. Mountain View 4. Pinecrest 5. Pine Ridge Apartments (rents according to income - not included in rental cost analysis) 6. Pinnacle 7. Pine Oak Townhomes 8. Sycamore Townhomes 9. Whispering Pines Morehead State University Comprehensive Housing Master Plan G. 1


79 OFF-CAMPUS HOUSING FINDINGS Census information for the City of Morehead shows that there are approximately 1,100 multi-family units in the city. Of these, the majority (43%) are configured as two-bedroom units. Bedrooms in Renter-Occupied Housing Units Quantity Percentage Studios 89 8% One BR % Two BR % Three BR % Four BR 73 7% Five or more 36 3% total 1, % According to the city planner, no new building permits for multi-family housing have been filed in the past year. The city would encourage off-campus development in the future, however. The selected private sector properties offer choices ranging from studio apartments to three-bedroom units at comparable housing costs. Apartment complex sizes range from four units to 40 units in the largest complexes. Photos of selected properties: Mountain View Tripplet View Pinnacle Brass Eagle Creekside Abner Morehead State University Comprehensive Housing Master Plan G. 2
80 OFF-CAMPUS HOUSING According to students, off-campus housing is perceived to be less expensive than the on-campus alternatives. Also, many students commented that off-campus apartments offered them more freedom and fewer restrictions. Based on B&D s analysis, the average monthly rental rates are (as of fall 2005): $335 for a studio apartment: $379 for a one bedroom apartment; $501 for a two-bedroom apartment, and $690 for a three-bedroom unit. Off-campus rental rates generally include water, sewer, and trash. For purposes of comparing off-campus housing costs with on-campus housing costs which include all utilities, an average utility rate per semester was determined, based on input from the student survey. The actual utility costs depend on the range of services residents contract for, the number of people splitting the various costs, and the efficiency of the unit. B&D estimated the average cost to be $60 per month per person. B&D compared the cost of apartment living on campus with the average cost in the off-campus market. The off-campus rates include the average rate for each unit type plus the $60 per month utility cost per person ($60 for studio and one-bedroom units and $120 for a two-bedroom unit). Analysis of studio units reveals that students who live in Mays Hall, the only building offering studios, pay a 27% premium in comparison to the off-campus costs. Oncampus Studio Unit Off- Campus % Difference Mays Hall $500 $395 27% Normal Hall NA NA NA Eagle Lake NA NA NA Analysis of one-bedroom units shows that the unfurnished unit in Normal Hall offers a 15% discount when compared to the off-campus average. One-bedroom apartments in Mays Hall and Eagle Lake can be rented at a premium of 37% and 14%, respectively. Oncampus One-Bedroom Unit Off- % Campus Difference Mays Hall $600 $439 37% Normal Hall $375 $439-15% Eagle Lake $500 $439 14% Morehead State University Comprehensive Housing Master Plan G. 3
81 OFF-CAMPUS HOUSING Comparison of two-bedroom units demonstrates that the on-campus apartments are more expensive than the off-campus alternatives, 29% at Mays Hall and 15% at Eagle Lake. Oncampus Two-Bedroom Unit Off- Campus % Difference Mays Hall $800 $621 29% Normal Hall NA $621 NA Eagle Lake $700 $621 13% B&D did not directly compare the cost of on-campus community-style and suite-style units to the off-campus alternatives as these units offer different amenities and typically are occupied as doubles and quads. Morehead State University Comprehensive Housing Master Plan G. 4
82 Morehead State University Residential Life Master Plan Phasing Strategy Diagram Beds As Currently Rented Maximum Design Capacity (Singles & Doubles) 2005/ / / / / / / / / / /15 Butler Hall Cartmell Hall Fields Hall Waterfield Hall Regents Hall Thompson Hall Alumni Tower Cooper Hall Wilson Hall Mignon Tower West Mignon Hall East Mignon Hall Mignon Hall Nunn Hall Mays Hall Apartments Gilley Apartments Normal Hall (Units) Eagle Lake Apartments (Units) New Complex 1 (Apartments/Suites) Total 3,690 2,934 2,934 2,777 2,425 2,429 2,477 2,973 2,921 2,817 2,944 2,944 2,944 Freshman/Sophomore Beds (1) 3,466 2,710 2,710 2,517 2,165 2,169 2,217 2,313 2,261 2,157 2,284 2,284 2,284 Upperclass/Graduate Beds (2) (1) Freshman/Sophomore beds include the following buildings: Butler, Cartmel, Fields, Thompson, Alumni, Cooper, Mignon Tower, East Mignon, West Mignon, Mignon Hall, and Nunn. (1) Upperclass/Graduat beds include the following buildings: Mays (double-occupancy bedrooms), Gilley (double-occupancy bedrooms), Normal (single-occupancy bedrooms), Eagle Lake (double-occupancy bedrooms), and the New Complex (single-occupancy bedrooms).
83 Morehead State University Residential Life Master Plan Capital Projects 2005/ / / / / / / / / / /15 RENOVATIONS Building: NA NA Nunn Hall Alumni Tower Mignon Tower East Mignon Hall West Mignon Hall Mignon Hall Cartmell Hall NA NA Budget: $0 $0 $5,031,000 $2,413,000 $2,455,000 $2,166,000 $2,436,000 $3,742,000 $3,714,000 $0 $0 Annual Debt Service: $0 $0 $421,000 $202,000 $205,000 $181,000 $204,000 $313,000 $311,000 $0 $0 NEW CONSTRUCTION Building: NA NA NA NA NA New Complex NA NA NA NA NA Budget: $0 $0 $0 $0 $0 $20,223,000 $0 $0 $0 $0 $0 Annual Debt Service: $0 $0 $0 $0 $0 $1,657,000 $0 $0 $0 $0 $0 Cumulative New Debt Service $0 $0 $421,000 $623,000 $828,000 $2,666,000 $2,870,000 $3,183,000 $3,494,000 $3,494,000 $3,494,000 University Contribution $500,000 $500,000 $500,000 $500,000 $500,000 $500,000 $500,000 $500,000 $0 $0 $0 Annual Rental Rate Increase* 0% 8% 7% 6% 5% 4% 4% 4% 4% 4% 4% Notes: * Actual rental rate increases at residence halls vary from hall to hall in 2006/2007 (see individual pro formas). Apartment rate increases at 4% annually, starting in 2007/2008
84 Morehead State University Residential Life Master Plan System-Wide Pro Forma Current Year / / / / / / / / / / /2016 Revenues Rental Revenues $6,014,453 $6,127,038 $5,715,805 $6,084,443 $6,436,902 $9,039,106 $9,373,202 $9,405,559 $10,170,637 $10,577,463 $11,000,561 Summer & Break Revenues $75,427 $79,817 $82,426 $85,122 $87,907 $90,785 $93,759 $96,833 $100,009 $103,291 $106,683 Conference Revenues $79,903 $77,907 $66,899 $69,467 $75,919 $81,407 $83,851 $84,656 $90,376 $93,087 $95,880 Other Revenues $178,373 $175,304 $154,985 $160,710 $173,903 $222,602 $229,284 $232,885 $245,965 $253,344 $260,945 Institutional Contribution $500,000 $500,000 $500,000 $500,000 $500,000 $500,000 $500,000 $500,000 $0 $0 $0 Total Revenues $6,848,000 $6,960,000 $6,520,000 $6,900,000 $7,275,000 $9,934,000 $10,280,000 $10,320,000 $10,607,000 $11,027,000 $11,464,000 Expenses Personnel Expenses Residential Life $520,251 $511,300 $452,039 $468,734 $507,216 $649,253 $668,742 $679,244 $717,396 $738,918 $761,085 Benefits $186,368 $183,161 $161,932 $167,913 $181,698 $232,580 $239,561 $243,323 $256,990 $264,700 $272,641 Auxilliary Personnel $1,641,373 $1,613,133 $1,426,166 $1,478,840 $1,600,247 $2,048,370 $2,109,857 $2,142,992 $2,263,358 $2,331,259 $2,401,197 Non-Personnel Expenses Residential Life-Non-Personnel $1,450,436 $1,422,745 $1,249,134 $1,295,696 $1,405,366 $1,729,453 $1,781,369 $1,807,093 $1,912,840 $1,970,225 $2,029,332 Services $426,001 $418,671 $370,146 $383,817 $415,327 $531,632 $547,590 $556,190 $587,430 $605,053 $623,204 Capital Projects $64,264 $63,158 $55,838 $57,900 $62,653 $80,198 $82,606 $83,903 $88,616 $91,274 $94,012 Total Expenses $4,289,000 $4,212,000 $3,715,000 $3,853,000 $4,173,000 $5,271,000 $5,430,000 $5,513,000 $5,827,000 $6,001,000 $6,181,000 Net Operating Income $2,559,000 $2,748,000 $2,805,000 $3,047,000 $3,102,000 $4,663,000 $4,850,000 $4,807,000 $4,780,000 $5,026,000 $5,283,000 Existing Debt Service $2,104,000 $2,096,000 $2,106,000 $2,115,000 $2,117,000 $1,777,000 $1,483,000 $1,482,000 $945,000 $946,000 $948,000 New Debt Service $0 $0 $421,029 $622,956 $828,417 $2,666,675 $2,870,526 $3,183,671 $3,494,451 $3,494,451 $3,494,451 Debt Service (Waterfield, Wilson, Regents) $139,174 $137,617 $138,227 $138,585 $138,679 $138,498 $138,032 $137,314 $138,653 $137,537 $138,539 Series I Debt Service $182,700 $0 $0 $0 $0 $0 $0 $0 $0 $0 $0 Total Annual Debt Service $2,426,000 $2,234,000 $2,665,000 $2,877,000 $3,084,000 $4,582,000 $4,492,000 $4,803,000 $4,578,000 $4,578,000 $4,581,000 Cash Flow After Debt Service $133,000 $514,000 $140,000 $170,000 $18,000 $81,000 $358,000 $4,000 $202,000 $448,000 $702,000 R&R Account Contribution $150,000 $100,000 $120,000 $0 $40,000 $120,000 $0 $120,000 $120,000 $250,000 Cash Flow After R&R Contribution $364,000 $40,000 $50,000 $18,000 $41,000 $238,000 $4,000 $82,000 $328,000 $452,000 Cumulative Cash Flow $364,000 $404,000 $454,000 $472,000 $513,000 $751,000 $755,000 $837,000 $1,165,000 $1,617,000 Debt Coverage Ratio
85 Morehead State University Residential Life Master Plan Alumni Tower Revenue Assumptions Expense Assumptions Capital Cost Assumptions Summer & Break Revenue/SF $0.00 Existing Square Footage 100,546 Construction Hard Cost $2,010,920 Conference Revenues/SF $0.12 Res. Life Resonnel/SF $0.67 Soft Costs (% of Hard) 20% Other Revenues /SF $0.23 Benefit Rate 36% Soft Costs $402,184 Auxilliary Personnel/SF $2.12 Total Project Cost $2,413,104 Other Revenue Inflation Rate 3% Res. Life Non-Personnel/SF $1.94 Debt Term 20 Services/SF $0.55 Interest Rate 5.50% Capital Projects/SF $0.08 Annual Debt Service $201,927 ` Expense Inflation Rate 3% Number of New Beds 383 Square Feet/Bed 263 Renovation Cost/SF $20.00 Master Plan Implementation Year Current Year Beds in Double Rooms Rental Rate (Double) $1,210 $1,310 $1,402 $1,486 $1,561 $1,623 $1,688 $1,755 $1,826 $1,899 $1,975 Beds in Private Rooms Rental Rate (Single) $1,815 $1,965 $2,103 $2,229 $2,341 $2,435 $2,532 $2,633 $2,739 $2,848 $2,962 Non-Revenue Beds Total Beds (Max. Design Capacity) Average Annual Occupancy 78% 78% 78% 78% 78% 78% 78% 78% 78% 78% 78% Annual Rental Rate Inflation Rate 8% 7% 6% 5% 4% 4% 4% 4% 4% 4% Premium For Singles 50% 50% 50% 50% 50% 50% 50% 50% 50% 50% 50% 2005/ / / / / / / / / / /2016 Double Room Revenues $575,718 $623,503 $667,148 $0 $742,535 $772,237 $803,126 $835,251 $868,661 $903,408 $939,544 Private Room Revenues $99,099 $107,281 $114,837 $0 $127,813 $132,926 $138,243 $143,773 $149,524 $155,505 $161,725 Summer & Break Revenues $0 $0 $0 $0 $0 $0 $0 $0 $0 $0 $0 Conference Revenues $12,066 $12,427 $12,800 $0 $13,580 $13,987 $14,407 $14,839 $15,284 $15,743 $16,215 Other Revenues $23,126 $23,819 $24,534 $0 $26,028 $26,809 $27,613 $28,442 $29,295 $30,174 $31,079 Total Revenues $710,000 $767,000 $819,000 $0 $910,000 $946,000 $983,000 $1,022,000 $1,063,000 $1,105,000 $1,149,000 Personnel Expenses Residential Life $67,449 $69,473 $71,557 $0 $75,915 $78,192 $80,538 $82,954 $85,443 $88,006 $90,646 Benefits $24,162 $24,887 $25,634 $0 $27,195 $28,011 $28,851 $29,716 $30,608 $31,526 $32,472 Auxilliary Personnel $212,800 $219,184 $225,760 $0 $239,508 $246,694 $254,094 $261,717 $269,569 $277,656 $285,986 Non-Personnel Expenses Residential Life-Non-Personnel $195,561 $201,428 $207,470 $0 $220,105 $226,708 $233,510 $240,515 $247,730 $255,162 $262,817 Services $55,230 $56,887 $58,593 $0 $62,162 $64,027 $65,947 $67,926 $69,964 $72,063 $74,224 Capital Projects $8,332 $8,582 $8,839 $0 $9,377 $9,659 $9,948 $10,247 $10,554 $10,871 $11,197 Total Expenses $564,000 $580,000 $598,000 $0 $634,000 $653,000 $673,000 $693,000 $714,000 $735,000 $757,000 Net Operating Income $146,000 $187,000 $221,000 $0 $276,000 $293,000 $310,000 $329,000 $349,000 $370,000 $392,000 Existing Debt Service $144,000 $145,000 $145,000 $145,000 $145,000 $144,000 $145,000 $144,000 $145,000 $145,000 $145,000 New Debt Service $0 $0 $0 $201,927 $201,927 $201,927 $201,927 $201,927 $201,927 $201,927 $201,927 Total Debt Service $144,000 $145,000 $145,000 $346,927 $346,927 $345,927 $346,927 $345,927 $346,927 $346,927 $346,927 Annual Cash Flow $2,000 $42,000 $76,000 ($346,927) ($70,927) ($52,927) ($36,927) ($16,927) $2,073 $23,073 $45,073 Debt Coverage Ratio
86 Morehead State University Residential Life Master Plan Butler Hall Revenue Assumptions Expense Assumptions Capital Cost Assumptions Summer & Break Revenue/SF $0.00 Existing Square Footage 35,784 Construction Hard Cost $0 Conference Revenues/SF $0.12 Res. Life Resonnel/SF $0.67 Soft Costs (% of Hard) 30% Other Revenues /SF $0.23 Benefit Rate 36% Soft Costs $0 Auxilliary Personnel/SF $2.12 Total Project Cost $0 Other Revenue Inflation Rate 3% Res. Life Non-Personnel/SF $1.94 Debt Term NA Services/SF $0.55 Interest Rate NA Capital Projects/SF $0.08 Annual Debt Service $0 ` Expense Inflation Rate 3% Master Plan Implementation Year Current Year Beds in Double Rooms Rental Rate (Double) $1,210 $1,310 $1,402 $1,486 $1,561 $1,623 $1,688 $1,755 $1,826 $1,899 $1,975 Beds in Private Rooms Rental Rate (Single) $1,815 $1,965 $2,103 $2,229 $2,341 $2,435 $2,532 $2,633 $2,739 $2,848 $2,962 Non-Revenue Beds Total Beds (Max. Design Capacity) Average Annual Occupancy 90% 90% 90% 90% 90% 90% 90% 90% 90% 90% 90% Annual Rental Rate Inflation Rate 8% 7% 6% 5% 4% 4% 4% 4% 4% 4% Premium For Singles 50% 50% 50% 50% 50% 50% 50% 50% 50% 50% 50% 2005/ / / / / / / / / / /2016 Double Room Revenues $335,412 $363,251 $388,679 $412,000 $432,599 $449,903 $467,900 $486,616 $0 $0 $0 Private Room Revenues $35,937 $38,899 $41,644 $44,143 $46,350 $48,204 $50,132 $52,137 $0 $0 $0 Summer & Break Revenues $0 $0 $0 $0 $0 $0 $0 $0 $0 $0 $0 Conference Revenues $4,294 $4,423 $4,556 $4,692 $4,833 $4,978 $5,127 $5,281 $0 $0 $0 Other Revenues $8,230 $8,477 $8,732 $8,993 $9,263 $9,541 $9,827 $10,122 $0 $0 $0 Total Revenues $384,000 $415,000 $444,000 $470,000 $493,000 $513,000 $533,000 $554,000 $0 $0 $0 Personnel Expenses Residential Life $24,005 $24,725 $25,467 $26,231 $27,018 $27,828 $28,663 $29,523 $0 $0 $0 Benefits $8,599 $8,857 $9,123 $9,397 $9,678 $9,969 $10,268 $10,576 $0 $0 $0 Auxilliary Personnel $75,735 $78,007 $80,347 $82,758 $85,240 $87,797 $90,431 $93,144 $0 $0 $0 Non-Personnel Expenses Residential Life-Non-Personnel $69,599 $71,687 $73,838 $76,053 $78,335 $80,685 $83,105 $85,599 $0 $0 $0 Services $19,656 $20,246 $20,853 $21,479 $22,123 $22,787 $23,470 $24,175 $0 $0 $0 Capital Projects $2,965 $3,054 $3,146 $3,240 $3,337 $3,437 $3,541 $3,647 $0 $0 $0 Total Expenses $201,000 $207,000 $213,000 $219,000 $226,000 $233,000 $239,000 $247,000 $0 $0 $0 Net Operating Income $183,000 $208,000 $231,000 $251,000 $267,000 $280,000 $294,000 $307,000 $0 $0 $0 Existing Debt Service $101,000 $100,000 $101,000 $101,000 $101,000 $102,000 $102,000 $102,000 $35,000 $35,000 $35,000 New Debt Service $0 $0 $0 $0 $0 $0 $0 $0 $0 $0 $0 Total Debt Service $101,000 $100,000 $101,000 $101,000 $101,000 $102,000 $102,000 $102,000 $35,000 $35,000 $35,000 Annual Cash Flow $82,000 $108,000 $130,000 $150,000 $166,000 $178,000 $192,000 $205,000 ($35,000) ($35,000) ($35,000) Debt Coverage Ratio
87 Morehead State University Residential Life Master Plan Cartmell Hall Revenue Assumptions Expense Assumptions Capital Cost Assumptions Summer & Break Revenue/SF $0.00 Existing Square Footage 103,165 Construction Hard Cost $3,094,950 Conference Revenues/SF $0.12 Res. Life Resonnel/SF $0.67 Soft Costs (% of Hard) 20% Other Revenues /SF $0.23 Benefit Rate 36% Soft Costs $618,990 Auxilliary Personnel/SF $2.12 Total Project Cost $3,713,940 Other Revenue Inflation Rate 3% Res. Life Non-Personnel/SF $1.94 Debt Term 20 Services/SF $0.55 Interest Rate 5.50% Capital Projects/SF $0.08 Annual Debt Service $310,780 ` Expense Inflation Rate 3% Number of New Beds 510 Square Feet/Bed 202 Renovation Cost/SF $30.00 Master Plan Implementation Year Current Year Beds in Double Rooms Rental Rate (Double) $1,210 $1,310 $1,402 $1,486 $1,561 $1,623 $1,688 $1,755 $1,826 $1,899 $1,975 Beds in Private Rooms Rental Rate (Single) $1,815 $1,965 $2,103 $2,229 $2,341 $2,435 $2,532 $2,633 $2,739 $2,848 $2,962 Non-Revenue Beds Total Beds (Max. Design Capacity) Average Annual Occupancy 70% 70% 70% 70% 70% 70% 70% 70% 70% 70% 70% Annual Rental Rate Inflation Rate 8% 7% 6% 5% 4% 4% 4% 4% 4% 4% Premium For Singles 50% 50% 50% 50% 50% 50% 50% 50% 50% 50% 50% 2005/ / / / / / / / / / /2016 Double Room Revenues $542,080 $587,073 $628,168 $665,858 $699,151 $727,117 $756,201 $786,449 $817,907 $850,624 $884,649 Private Room Revenues $221,067 $239,304 $256,175 $271,545 $285,122 $296,527 $308,388 $320,724 $333,553 $346,895 $360,771 Summer & Break Revenues $0 $0 $0 $0 $0 $0 $0 $0 $0 $0 $0 Conference Revenues $12,380 $12,751 $13,134 $13,528 $13,934 $14,352 $14,782 $15,226 $15,682 $16,153 $16,637 Other Revenues $23,728 $24,440 $25,173 $25,928 $26,706 $27,507 $28,332 $29,182 $30,058 $30,960 $31,888 Total Revenues $799,000 $864,000 $923,000 $977,000 $1,025,000 $1,066,000 $1,108,000 $1,152,000 $1,197,000 $1,245,000 $1,294,000 Personnel Expenses Residential Life $69,206 $71,282 $73,421 $75,623 $77,892 $80,229 $82,636 $85,115 $87,668 $90,298 $93,007 Benefits $24,791 $25,535 $26,301 $27,090 $27,903 $28,740 $29,602 $30,490 $31,405 $32,347 $33,318 Auxilliary Personnel $218,343 $224,893 $231,640 $238,589 $245,747 $253,119 $260,713 $268,534 $276,591 $284,888 $293,435 Non-Personnel Expenses Residential Life-Non-Personnel $200,655 $206,674 $212,874 $219,261 $225,839 $232,614 $239,592 $246,780 $254,183 $261,809 $269,663 Services $56,669 $58,369 $60,120 $61,923 $63,781 $65,694 $67,665 $69,695 $71,786 $73,940 $76,158 Capital Projects $8,549 $8,805 $9,069 $9,341 $9,622 $9,910 $10,208 $10,514 $10,829 $11,154 $11,489 Total Expenses $578,000 $596,000 $613,000 $632,000 $651,000 $670,000 $690,000 $711,000 $732,000 $754,000 $777,000 Net Operating Income $221,000 $268,000 $310,000 $345,000 $374,000 $396,000 $418,000 $441,000 $465,000 $491,000 $517,000 Existing Debt Service $71,000 $72,000 $72,000 $72,000 $72,000 $71,000 $72,000 $71,000 $72,000 $72,000 $72,000 New Debt Service $0 $0 $0 $0 $0 $0 $0 $0 $310,780 $310,780 $310,780 Total Debt Service $71,000 $72,000 $72,000 $72,000 $72,000 $71,000 $72,000 $71,000 $382,780 $382,780 $382,780 Annual Cash Flow $150,000 $196,000 $238,000 $273,000 $302,000 $325,000 $346,000 $370,000 $82,220 $108,220 $134,220 Debt Coverage Ratio
88 Morehead State University Residential Life Master Plan Cooper Hall Revenue Assumptions Expense Assumptions Capital Cost Assumptions Summer & Break Revenue/SF $0.00 Existing Square Footage 35,543 Construction Hard Cost $0 Conference Revenues/SF $0.12 Res. Life Resonnel/SF $0.67 Soft Costs (% of Hard) 30% Other Revenues /SF $0.23 Benefit Rate 36% Soft Costs $0 Auxilliary Personnel/SF $2.12 Total Project Cost $0 Other Revenue Inflation Rate 3% Res. Life Non-Personnel/SF $1.94 Debt Term NA Services/SF $0.55 Interest Rate NA Capital Projects/SF $0.08 Annual Debt Service $0 ` Expense Inflation Rate 3% Master Plan Implementation Year Current Year Beds in Double Rooms Rental Rate (Double) $1,210 $1,310 $1,402 $1,486 $1,561 $1,623 $1,688 $1,755 $1,826 $1,899 $1,975 Beds in Private Rooms Rental Rate (Single) $1,815 $1,965 $2,103 $2,229 $2,341 $2,435 $2,532 $2,633 $2,739 $2,848 $2,962 Non-Revenue Beds Total Beds (Max. Design Capacity) Average Annual Occupancy 84% 84% 84% 84% 84% 84% 84% 84% 84% 84% 84% Annual Rental Rate Inflation Rate 8% 7% 6% 5% 4% 4% 4% 4% 4% 4% Premium For Singles 50% 50% 50% 50% 50% 50% 50% 50% 50% 50% 50% 2005/ / / / / / / / / / /2016 Double Room Revenues $382,166 $0 $0 $0 $0 $0 $0 $0 $0 $0 $0 Private Room Revenues $15,246 $0 $0 $0 $0 $0 $0 $0 $0 $0 $0 Summer & Break Revenues $0 $0 $0 $0 $0 $0 $0 $0 $0 $0 $0 Conference Revenues $4,265 $0 $0 $0 $0 $0 $0 $0 $0 $0 $0 Other Revenues $8,175 $0 $0 $0 $0 $0 $0 $0 $0 $0 $0 Total Revenues $410,000 $0 $0 $0 $0 $0 $0 $0 $0 $0 $0 Personnel Expenses Residential Life $23,843 $0 $0 $0 $0 $0 $0 $0 $0 $0 $0 Benefits $8,541 $0 $0 $0 $0 $0 $0 $0 $0 $0 $0 Auxilliary Personnel $75,225 $0 $0 $0 $0 $0 $0 $0 $0 $0 $0 Non-Personnel Expenses Residential Life-Non-Personnel $69,131 $0 $0 $0 $0 $0 $0 $0 $0 $0 $0 Services $19,524 $0 $0 $0 $0 $0 $0 $0 $0 $0 $0 Capital Projects $2,945 $0 $0 $0 $0 $0 $0 $0 $0 $0 $0 Total Expenses $199,000 $0 $0 $0 $0 $0 $0 $0 $0 $0 $0 Net Operating Income $211,000 $0 $0 $0 $0 $0 $0 $0 $0 $0 $0 Existing Debt Service $25,000 $25,000 $25,000 $25,000 $25,000 $25,000 $25,000 $25,000 $25,000 $25,000 $25,000 New Debt Service $0 $0 $0 $0 $0 $0 $0 $0 $0 $0 $0 Total Debt Service $25,000 $25,000 $25,000 $25,000 $25,000 $25,000 $25,000 $25,000 $25,000 $25,000 $25,000 Annual Cash Flow $186,000 ($25,000) ($25,000) ($25,000) ($25,000) ($25,000) ($25,000) ($25,000) ($25,000) ($25,000) ($25,000) Debt Coverage Ratio
89 Morehead State University Residential Life Master Plan Fields Hall Revenue Assumptions Expense Assumptions Capital Cost Assumptions Summer & Break Revenue/SF $0.00 Existing Square Footage 35,602 Construction Hard Cost $0 Conference Revenues/SF $0.12 Res. Life Resonnel/SF $0.67 Soft Costs (% of Hard) 30% Other Revenues /SF $0.23 Benefit Rate 36% Soft Costs $0 Auxilliary Personnel/SF $2.12 Total Project Cost $0 Other Revenue Inflation Rate 3% Res. Life Non-Personnel/SF $1.94 Debt Term NA Services/SF $0.55 Interest Rate NA Capital Projects/SF $0.08 Annual Debt Service $0 ` Expense Inflation Rate 3% Master Plan Implementation Year Current Year Beds in Double Rooms Rental Rate (Double) $1,320 $1,425 $1,524 $1,616 $1,697 $1,764 $1,835 $1,908 $1,985 $2,064 $2,147 Beds in Private Rooms Rental Rate (Single) $1,980 $2,138 $2,286 $2,424 $2,545 $2,647 $2,752 $2,863 $2,977 $3,096 $3,220 Non-Revenue Beds Total Beds (Max. Design Capacity) Average Annual Occupancy 72% 72% 72% 72% 72% 72% 72% 72% 72% 72% 72% Annual Rental Rate Inflation Rate 8% 7% 6% 5% 4% 4% 4% 4% 4% 4% Premium For Singles 50% 50% 50% 50% 50% 50% 50% 50% 50% 50% 50% 2005/ / / / / / / / / / /2016 Double Room Revenues $212,890 $229,750 $245,833 $260,583 $273,612 $284,557 $295,939 $307,776 $320,087 $332,891 $346,207 Private Room Revenues $14,256 $15,395 $16,462 $17,450 $18,322 $19,055 $19,817 $20,610 $21,434 $22,292 $23,183 Summer & Break Revenues $0 $0 $0 $0 $0 $0 $0 $0 $0 $0 $0 Conference Revenues $4,272 $4,400 $4,532 $4,668 $4,808 $4,953 $5,101 $5,254 $5,412 $5,574 $5,742 Other Revenues $8,188 $8,434 $8,687 $8,948 $9,216 $9,493 $9,777 $10,071 $10,373 $10,684 $11,005 Total Revenues $240,000 $258,000 $276,000 $292,000 $306,000 $318,000 $331,000 $344,000 $357,000 $371,000 $386,000 Personnel Expenses Residential Life $23,883 $24,599 $25,337 $26,097 $26,880 $27,687 $28,517 $29,373 $30,254 $31,162 $32,097 Benefits $8,555 $8,812 $9,077 $9,349 $9,629 $9,918 $10,216 $10,522 $10,838 $11,163 $11,498 Auxilliary Personnel $75,350 $77,610 $79,938 $82,337 $84,807 $87,351 $89,971 $92,671 $95,451 $98,314 $101,264 Non-Personnel Expenses Residential Life-Non-Personnel $69,245 $71,323 $73,462 $75,666 $77,936 $80,274 $82,683 $85,163 $87,718 $90,350 $93,060 Services $19,556 $20,143 $20,747 $21,370 $22,011 $22,671 $23,351 $24,052 $24,773 $25,516 $26,282 Capital Projects $2,950 $3,039 $3,130 $3,224 $3,320 $3,420 $3,523 $3,628 $3,737 $3,849 $3,965 Total Expenses $200,000 $206,000 $212,000 $218,000 $225,000 $231,000 $238,000 $245,000 $253,000 $260,000 $268,000 Net Operating Income $40,000 $52,000 $64,000 $74,000 $81,000 $87,000 $93,000 $99,000 $104,000 $111,000 $118,000 Existing Debt Service $323,000 $323,000 $324,000 $327,000 $327,000 $152,000 $0 $0 $0 $0 $0 New Debt Service $0 $0 $0 $0 $0 $0 $0 $0 $0 $0 $0 Total Debt Service $323,000 $323,000 $324,000 $327,000 $327,000 $152,000 $0 $0 $0 $0 $0 Annual Cash Flow ($283,000) ($271,000) ($260,000) ($253,000) ($246,000) ($65,000) $93,000 $99,000 $104,000 $111,000 $118,000 Debt Coverage Ratio NA NA NA NA NA
90 Morehead State University Residential Life Master Plan Thompson Hall Revenue Assumptions Expense Assumptions Capital Cost Assumptions Summer & Break Revenue/SF $1.26 Existing Square Footage 35,249 Construction Hard Cost $0 Conference Revenues/SF $0.12 Res. Life Resonnel/SF $0.67 Soft Costs (% of Hard) 30% Other Revenues /SF $0.23 Benefit Rate 36% Soft Costs $0 Auxilliary Personnel/SF $2.12 Total Project Cost $0 Other Revenue Inflation Rate 3% Res. Life Non-Personnel/SF $1.94 Debt Term NA Services/SF $0.55 Interest Rate NA Capital Projects/SF $0.08 Annual Debt Service $0 ` Expense Inflation Rate 3% Master Plan Implementation Year Current Year Beds in Double Rooms Rental Rate (Double) $1,650 $1,450 $1,552 $1,645 $1,727 $1,796 $1,868 $1,942 $2,020 $2,101 $2,185 Beds in Private Rooms Rental Rate (Single) $2,475 $2,176 $2,327 $2,467 $2,590 $2,694 $2,802 $2,914 $3,030 $3,151 $3,277 Non-Revenue Beds Total Beds (Max. Design Capacity) Average Annual Occupancy 72% 72% 72% 72% 72% 72% 72% 72% 72% 72% 72% Annual Rental Rate Inflation Rate -12% 7% 6% 5% 4% 4% 4% 4% 4% 4% Premium For Singles 50% 50% 50% 50% 50% 50% 50% 50% 50% 50% 50% 2005/ / / / / / / / / / /2016 Double Room Revenues $237,600 $208,800 $223,416 $236,821 $248,662 $258,608 $268,953 $279,711 $290,899 $302,535 $314,637 Private Room Revenues $17,820 $15,665 $16,756 $17,762 $18,650 $19,396 $20,171 $20,978 $21,817 $22,690 $23,598 Summer & Break Revenues $44,277 $45,605 $46,974 $48,383 $49,834 $51,329 $52,869 $54,455 $56,089 $57,772 $59,505 Conference Revenues $4,230 $4,357 $4,487 $4,622 $4,761 $4,904 $5,051 $5,202 $5,358 $5,519 $5,685 Other Revenues $8,107 $8,350 $8,601 $8,859 $9,125 $9,399 $9,681 $9,971 $10,270 $10,578 $10,895 Total Revenues $312,000 $283,000 $300,000 $316,000 $331,000 $344,000 $357,000 $370,000 $384,000 $399,000 $414,000 Personnel Expenses Residential Life $23,646 $24,355 $25,086 $25,839 $26,614 $27,412 $28,235 $29,082 $29,954 $30,853 $31,778 Benefits $8,471 $8,725 $8,987 $9,256 $9,534 $9,820 $10,114 $10,418 $10,730 $11,052 $11,384 Auxilliary Personnel $74,603 $76,841 $79,146 $81,520 $83,966 $86,485 $89,079 $91,752 $94,504 $97,339 $100,260 Non-Personnel Expenses Residential Life-Non-Personnel $68,559 $70,616 $72,734 $74,916 $77,164 $79,479 $81,863 $84,319 $86,848 $89,454 $92,137 Services $19,362 $19,943 $20,541 $21,158 $21,792 $22,446 $23,120 $23,813 $24,528 $25,263 $26,021 Capital Projects $2,921 $3,008 $3,099 $3,192 $3,287 $3,386 $3,488 $3,592 $3,700 $3,811 $3,925 Total Expenses $198,000 $203,000 $210,000 $216,000 $222,000 $229,000 $236,000 $243,000 $250,000 $258,000 $266,000 Net Operating Income $114,000 $80,000 $90,000 $100,000 $109,000 $115,000 $121,000 $127,000 $134,000 $141,000 $148,000 Existing Debt Service $311,000 $310,000 $312,000 $315,000 $314,000 $146,000 $0 $0 $0 $0 $0 New Debt Service $0 $0 $0 $0 $0 $0 $0 $0 $0 $0 $0 Total Debt Service $311,000 $310,000 $312,000 $315,000 $314,000 $146,000 $0 $0 $0 $0 $0 Annual Cash Flow ($197,000) ($230,000) ($222,000) ($215,000) ($205,000) ($31,000) $121,000 $127,000 $134,000 $141,000 $148,000 Debt Coverage Ratio NA NA NA NA NA
91 Morehead State University Residential Life Master Plan Mignon Hall Revenue Assumptions Expense Assumptions Capital Cost Assumptions Summer & Break Revenue/SF $0.00 Existing Square Footage 56,700 Construction Hard Cost $3,118,500 Conference Revenues/SF $0.12 Res. Life Resonnel/SF $0.67 Soft Costs (% of Hard) 20% Other Revenues /SF $0.23 Benefit Rate 36% Soft Costs $623,700 Auxilliary Personnel/SF $2.12 Total Project Cost $3,742,200 Other Revenue Inflation Rate 3% Res. Life Non-Personnel/SF $1.94 Debt Term 20 Services/SF $0.55 Interest Rate 5.50% Capital Projects/SF $0.08 Annual Debt Service $313,145 ` Expense Inflation Rate 3% Number of New Beds 300 Square Feet/Bed 189 Renovation Cost/SF $55.00 Master Plan Implementation Year Current Year Beds in Quad Units Rental Rate (Quad) $1,260 $1,375 $1,471 $1,559 $1,637 $1,703 $1,771 $1,842 $1,915 $1,992 $2,071 Beds in Double Units Rental Rate (Double) $1,890 $2,062 $2,206 $2,339 $2,456 $2,554 $2,656 $2,762 $2,873 $2,988 $3,107 Non-Revenue Beds Total Beds (Max. Design Capacity) Average Annual Occupancy 84% 84% 84% 84% 84% 84% 84% 84% 84% 84% 84% Annual Rental Rate Inflation Rate 9% 7% 6% 5% 4% 4% 4% 4% 4% 4% Premium For Double 50% 50% 50% 50% 50% 50% 50% 50% 50% 50% 50% 2005/ / / / / / / / / / /2016 Quad Unit Revenues $624,456 $681,281 $728,971 $772,709 $811,345 $843,799 $877,551 $0 $949,159 $987,125 $1,026,610 Double Unit Revenues $0 $0 $0 $0 $0 $0 $0 $0 $0 $0 $0 Summer & Break Revenues $0 $0 $0 $0 $0 $0 $0 $0 $0 $0 $0 Conference Revenues $6,804 $7,008 $7,218 $7,435 $7,658 $7,888 $8,124 $0 $8,619 $8,878 $9,144 Other Revenues $13,041 $13,432 $13,835 $14,250 $14,678 $15,118 $15,572 $0 $16,520 $17,016 $17,526 Total Revenues $644,000 $702,000 $750,000 $794,000 $834,000 $867,000 $901,000 $0 $974,000 $1,013,000 $1,053,000 Personnel Expenses Residential Life $38,036 $39,177 $40,352 $41,563 $42,810 $44,094 $45,417 $0 $48,183 $49,628 $51,117 Benefits $13,626 $14,034 $14,455 $14,889 $15,336 $15,796 $16,270 $0 $17,260 $17,778 $18,312 Auxilliary Personnel $120,002 $123,603 $127,311 $131,130 $135,064 $139,116 $143,289 $0 $152,016 $156,576 $161,273 Non-Personnel Expenses Residential Life-Non-Personnel $110,281 $113,589 $116,997 $120,507 $124,122 $127,846 $131,681 $0 $139,700 $143,891 $148,208 Services $31,145 $32,080 $33,042 $34,033 $35,054 $36,106 $37,189 $0 $39,454 $40,638 $41,857 Capital Projects $4,698 $4,839 $4,985 $5,134 $5,288 $5,447 $5,610 $0 $5,952 $6,130 $6,314 Total Expenses $318,000 $327,000 $337,000 $347,000 $358,000 $368,000 $379,000 $0 $403,000 $415,000 $427,000 Net Operating Income $326,000 $375,000 $413,000 $447,000 $476,000 $499,000 $522,000 $0 $571,000 $598,000 $626,000 Existing Debt Service $40,000 $40,000 $40,000 $40,000 $40,000 $40,000 $40,000 $40,000 $40,000 $40,000 $40,000 New Debt Service $0 $0 $0 $0 $0 $0 $0 $313,145 $313,145 $313,145 $313,145 Total Debt Service $40,000 $40,000 $40,000 $40,000 $40,000 $40,000 $40,000 $353,145 $353,145 $353,145 $353,145 Annual Cash Flow $286,000 $335,000 $373,000 $407,000 $436,000 $459,000 $482,000 ($353,145) $217,855 $244,855 $272,855 Debt Coverage Ratio
92 Morehead State University Residential Life Master Plan East Mignon Hall Revenue Assumptions Expense Assumptions Capital Cost Assumptions Summer & Break Revenue/SF $0.00 Existing Square Footage 45,127 Construction Hard Cost $1,805,080 Conference Revenues/SF $0.12 Res. Life Resonnel/SF $0.67 Soft Costs (% of Hard) 20% Other Revenues /SF $0.23 Benefit Rate 36% Soft Costs $361,016 Auxilliary Personnel/SF $2.12 Total Project Cost $2,166,096 Other Revenue Inflation Rate 3% Res. Life Non-Personnel/SF $1.94 Debt Term 20 Services/SF $0.55 Interest Rate 5.50% Capital Projects/SF $0.08 Annual Debt Service $181,257 ` Expense Inflation Rate 3% Number of New Beds 196 Square Feet/Bed 230 Renovation Cost/SF $40.00 Master Plan Implementation Year Current Year Beds in Quad Units Rental Rate (Quad) $1,260 $1,375 $1,471 $1,559 $1,637 $1,703 $1,771 $1,842 $1,915 $1,992 $2,071 Beds in Double/Triple Units Rental Rate (Double) $1,890 $2,062 $2,206 $2,339 $2,456 $2,554 $2,302 $2,394 $2,490 $2,589 $2,693 Non-Revenue Beds Total Beds (Max. Design Capacity) Average Annual Occupancy 87% 87% 87% 87% 87% 87% 87% 87% 87% 87% 87% Annual Rental Rate Inflation Rate 9% 7% 6% 5% 4% 4% 4% 4% 4% 4% Premium For Double 50% 50% 50% 50% 50% 50% 30% 30% 30% 30% 30% 2005/ / / / / / / / / / /2016 Quad Unit Revenues $416,556 $454,463 $486,275 $515,451 $541,224 $0 $0 $0 $0 $0 $0 Double Unit Revenues $0 $0 $0 $0 $0 $0 $520,687 $541,515 $563,175 $585,702 $609,130 Summer & Break Revenues $0 $0 $0 $0 $0 $0 $0 $0 $0 $0 $0 Conference Revenues $5,415 $5,578 $5,745 $5,917 $6,095 $0 $6,466 $6,660 $6,860 $7,066 $7,278 Other Revenues $10,379 $10,691 $11,011 $11,342 $11,682 $0 $12,393 $12,765 $13,148 $13,543 $13,949 Total Revenues $432,000 $471,000 $503,000 $533,000 $559,000 $0 $540,000 $561,000 $583,000 $606,000 $630,000 Personnel Expenses Residential Life $30,273 $31,181 $32,116 $33,080 $34,072 $0 $36,147 $37,231 $38,348 $39,499 $40,684 Benefits $10,844 $11,170 $11,505 $11,850 $12,206 $0 $12,949 $13,337 $13,737 $14,150 $14,574 Auxilliary Personnel $95,509 $98,374 $101,325 $104,365 $107,496 $0 $114,043 $117,464 $120,988 $124,617 $128,356 Non-Personnel Expenses Residential Life-Non-Personnel $87,771 $90,405 $93,117 $95,910 $98,788 $0 $104,804 $107,948 $111,186 $114,522 $117,957 Services $24,788 $25,532 $26,298 $27,087 $27,899 $0 $29,598 $30,486 $31,401 $32,343 $33,313 Capital Projects $3,739 $3,852 $3,967 $4,086 $4,209 $0 $4,465 $4,599 $4,737 $4,879 $5,025 Total Expenses $253,000 $261,000 $268,000 $276,000 $285,000 $0 $302,000 $311,000 $320,000 $330,000 $340,000 Net Operating Income $179,000 $210,000 $235,000 $257,000 $274,000 $0 $238,000 $250,000 $263,000 $276,000 $290,000 Existing Debt Service $79,000 $78,000 $79,000 $79,000 $79,000 $79,000 $79,000 $79,000 $79,000 $79,000 $79,000 New Debt Service $0 $0 $0 $0 $0 $181,257 $181,257 $181,257 $181,257 $181,257 $181,257 Total Debt Service $79,000 $78,000 $79,000 $79,000 $79,000 $260,257 $260,257 $260,257 $260,257 $260,257 $260,257 Annual Cash Flow $100,000 $132,000 $156,000 $178,000 $195,000 ($260,257) ($22,257) ($10,257) $2,743 $15,743 $29,743 Debt Coverage Ratio
93 Morehead State University Residential Life Master Plan West Mignon Hall Revenue Assumptions Expense Assumptions Capital Cost Assumptions Summer & Break Revenue/SF $0.00 Existing Square Footage 45,113 Construction Hard Cost $2,030,085 Conference Revenues/SF $0.12 Res. Life Resonnel/SF $0.67 Soft Costs (% of Hard) 20% Other Revenues /SF $0.23 Benefit Rate 36% Soft Costs $406,017 Auxilliary Personnel/SF $2.12 Total Project Cost $2,436,102 Other Revenue Inflation Rate 3% Res. Life Non-Personnel/SF $1.94 Debt Term 20 Services/SF $0.55 Interest Rate 5.50% Capital Projects/SF $0.08 Annual Debt Service $203,851 ` Expense Inflation Rate 3% Number of New Beds 196 Square Feet/Bed 230 Renovation Cost/SF $45.00 Master Plan Implementation Year Current Year Beds in Quad Units Rental Rate (Quad) $1,260 $1,400 $1,498 $1,588 $1,667 $1,734 $1,803 $1,875 $1,950 $2,028 $2,109 Beds in Double Units Rental Rate (Double) $1,890 $2,100 $2,247 $2,382 $2,501 $2,601 $2,705 $2,813 $2,925 $3,042 $3,164 Non-Revenue Beds Total Beds (Max. Design Capacity) Average Annual Occupancy 80% 80% 80% 80% 80% 80% 80% 80% 80% 80% 80% Annual Rental Rate Inflation Rate 11% 7% 6% 5% 4% 4% 4% 4% 4% 4% Premium For Double 50% 50% 50% 50% 50% 50% 50% 50% 50% 50% 50% 2005/ / / / / / / / / / /2016 Quad Unit Revenues $383,040 $425,557 $455,346 $482,667 $506,801 $527,073 $0 $570,082 $592,885 $616,600 $641,264 Double Unit Revenues $0 $0 $0 $0 $0 $0 $0 $0 $0 $0 $0 Summer & Break Revenues $0 $0 $0 $0 $0 $0 $0 $0 $0 $0 $0 Conference Revenues $5,414 $5,576 $5,743 $5,916 $6,093 $6,276 $0 $6,658 $6,858 $7,063 $7,275 Other Revenues $10,376 $10,687 $11,008 $11,338 $11,678 $12,029 $0 $12,761 $13,144 $13,538 $13,944 Total Revenues $399,000 $442,000 $472,000 $500,000 $525,000 $545,000 $0 $590,000 $613,000 $637,000 $662,000 Personnel Expenses Residential Life $30,263 $31,171 $32,106 $33,069 $34,061 $35,083 $0 $37,220 $38,336 $39,487 $40,671 Benefits $10,841 $11,166 $11,501 $11,846 $12,202 $12,568 $0 $13,333 $13,733 $14,145 $14,569 Auxilliary Personnel $95,479 $98,344 $101,294 $104,333 $107,463 $110,687 $0 $117,427 $120,950 $124,579 $128,316 Non-Personnel Expenses Residential Life-Non-Personnel $87,744 $90,377 $93,088 $95,880 $98,757 $101,720 $0 $107,914 $111,152 $114,486 $117,921 Services $24,781 $25,524 $26,290 $27,078 $27,891 $28,727 $0 $30,477 $31,391 $32,333 $33,303 Capital Projects $3,738 $3,850 $3,966 $4,085 $4,207 $4,334 $0 $4,598 $4,735 $4,878 $5,024 Total Expenses $253,000 $260,000 $268,000 $276,000 $285,000 $293,000 $0 $311,000 $320,000 $330,000 $340,000 Net Operating Income $146,000 $182,000 $204,000 $224,000 $240,000 $252,000 $0 $279,000 $293,000 $307,000 $322,000 Existing Debt Service $79,000 $78,000 $79,000 $79,000 $79,000 $79,000 $79,000 $79,000 $79,000 $79,000 $79,000 New Debt Service $0 $0 $0 $0 $0 $0 $203,851 $203,851 $203,851 $203,851 $203,851 Total Debt Service $79,000 $78,000 $79,000 $79,000 $79,000 $79,000 $282,851 $282,851 $282,851 $282,851 $282,851 Annual Cash Flow $67,000 $104,000 $125,000 $145,000 $161,000 $173,000 ($282,851) ($3,851) $10,149 $24,149 $39,149 Debt Coverage Ratio
94 Morehead State University Residential Life Master Plan Mignon Tower Revenue Assumptions Expense Assumptions Capital Cost Assumptions Summer & Break Revenue/SF $0.00 Existing Square Footage 68,204 Construction Hard Cost $2,046,120 Conference Revenues/SF $0.12 Res. Life Resonnel/SF $0.67 Soft Costs (% of Hard) 20% Other Revenues /SF $0.23 Benefit Rate 36% Soft Costs $409,224 Auxilliary Personnel/SF $2.12 Total Project Cost $2,455,344 Other Revenue Inflation Rate 3% Res. Life Non-Personnel/SF $1.94 Debt Term 20 Services/SF $0.55 Interest Rate 5.50% Capital Projects/SF $0.08 Annual Debt Service $205,462 ` Expense Inflation Rate 3% Number of New Beds 300 Square Feet/Bed 227 Renovation Cost/SF $30.00 Master Plan Implementation Year Current Year Beds in Quad Units Rental Rate (Quad) $1,260 $1,375 $1,471 $1,559 $1,637 $1,703 $1,771 $1,842 $1,915 $1,992 $2,071 Beds in Double Units Rental Rate (Double) $1,890 $2,062 $2,206 $2,339 $2,456 $2,554 $2,656 $2,762 $2,873 $2,988 $3,107 Non-Revenue Beds Total Beds (Max. Design Capacity) Average Annual Occupancy 87% 87% 87% 87% 87% 87% 87% 87% 87% 87% 87% Annual Rental Rate Inflation Rate 9% 7% 6% 5% 4% 4% 4% 4% 4% 4% Premium For Double 50% 50% 50% 50% 50% 50% 50% 50% 50% 50% 50% 2005/ / / / / / / / / / /2016 Quad Unit Revenues $627,026 $684,086 $731,972 $775,890 $0 $847,272 $881,163 $916,409 $953,066 $991,188 $1,030,836 Double Unit Revenues $0 $0 $0 $0 $0 $0 $0 $0 $0 $0 $0 Summer & Break Revenues $0 $0 $0 $0 $0 $0 $0 $0 $0 $0 $0 Conference Revenues $8,184 $8,430 $8,683 $8,943 $0 $9,488 $9,773 $10,066 $10,368 $10,679 $10,999 Other Revenues $15,687 $16,158 $16,642 $17,142 $0 $18,185 $18,731 $19,293 $19,872 $20,468 $21,082 Total Revenues $651,000 $709,000 $757,000 $802,000 $0 $875,000 $910,000 $946,000 $983,000 $1,022,000 $1,063,000 Personnel Expenses Residential Life $45,753 $47,126 $48,540 $49,996 $0 $53,041 $54,632 $56,271 $57,959 $59,698 $61,489 Benefits $16,390 $16,882 $17,388 $17,910 $0 $19,001 $19,571 $20,158 $20,762 $21,385 $22,027 Auxilliary Personnel $144,350 $148,681 $153,141 $157,735 $0 $167,341 $172,362 $177,532 $182,858 $188,344 $193,994 Non-Personnel Expenses Residential Life-Non-Personnel $132,656 $136,636 $140,735 $144,957 $0 $153,785 $158,398 $163,150 $168,045 $173,086 $178,278 Services $37,464 $38,588 $39,746 $40,938 $0 $43,432 $44,735 $46,077 $47,459 $48,883 $50,349 Capital Projects $5,652 $5,821 $5,996 $6,176 $0 $6,552 $6,748 $6,951 $7,159 $7,374 $7,595 Total Expenses $382,000 $394,000 $406,000 $418,000 $0 $443,000 $456,000 $470,000 $484,000 $499,000 $514,000 Net Operating Income $269,000 $315,000 $351,000 $384,000 $0 $432,000 $454,000 $476,000 $499,000 $523,000 $549,000 Existing Debt Service $47,000 $47,000 $47,000 $47,000 $47,000 $47,000 $47,000 $47,000 $47,000 $47,000 $47,000 New Debt Service $0 $0 $0 $0 $205,462 $205,462 $205,462 $205,462 $205,462 $205,462 $205,462 Total Debt Service $47,000 $47,000 $47,000 $47,000 $252,462 $252,462 $252,462 $252,462 $252,462 $252,462 $252,462 Annual Cash Flow $222,000 $268,000 $304,000 $337,000 ($252,462) $179,538 $201,538 $223,538 $246,538 $270,538 $296,538 Debt Coverage Ratio
95 Morehead State University Residential Life Master Plan Nunn Hall Revenue Assumptions Expense Assumptions Capital Cost Assumptions Summer & Break Revenue/SF $0.00 Existing Square Footage 104,822 Construction Hard Cost $4,192,880 Conference Revenues/SF $0.12 Res. Life Resonnel/SF $0.67 Soft Costs (% of Hard) 20% Other Revenues /SF $0.23 Benefit Rate 36% Soft Costs $838,576 Auxilliary Personnel/SF $2.12 Total Project Cost $5,031,456 Other Revenue Inflation Rate 3% Res. Life Non-Personnel/SF $1.94 Debt Term 20 Services/SF $0.55 Interest Rate 5.50% Capital Projects/SF $0.08 Annual Debt Service $421,029 ` Expense Inflation Rate 3% Number of New Beds 352 Square Feet/Bed 298 Renovation Cost/SF $40.00 Master Plan Implementation Year Current Year Beds in Quad Units Rental Rate (Quad) $1,260 $1,375 $1,471 $1,559 $1,637 $1,703 $1,771 $1,842 $1,915 $1,992 $2,071 Beds in Double Units Rental Rate (Double) $1,890 $2,062 $2,206 $2,339 $2,456 $2,554 $2,656 $2,762 $2,873 $2,988 $3,107 Non-Revenue Beds Total Beds (Max. Design Capacity) Average Annual Occupancy 81% 81% 81% 81% 81% 81% 81% 81% 81% 81% 81% Annual Rental Rate Inflation Rate 9% 7% 6% 5% 4% 4% 4% 4% 4% 4% Premium For Double 50% 50% 50% 50% 50% 50% 50% 50% 50% 50% 50% 2005/ / / / / / / / / / /2016 Quad Unit Revenues $702,173 $766,071 $0 $868,877 $912,321 $948,814 $986,766 $1,026,237 $1,067,287 $1,109,978 $1,154,377 Double Unit Revenues $0 $0 $0 $0 $0 $0 $0 $0 $0 $0 $0 Summer & Break Revenues $0 $0 $0 $0 $0 $0 $0 $0 $0 $0 $0 Conference Revenues $12,579 $12,956 $0 $13,745 $14,157 $14,582 $15,020 $15,470 $15,934 $16,412 $16,905 Other Revenues $24,109 $24,832 $0 $26,345 $27,135 $27,949 $28,787 $29,651 $30,541 $31,457 $32,401 Total Revenues $739,000 $804,000 $0 $909,000 $954,000 $991,000 $1,031,000 $1,071,000 $1,114,000 $1,158,000 $1,204,000 Personnel Expenses Residential Life $70,318 $72,427 $0 $76,838 $79,143 $81,518 $83,963 $86,482 $89,076 $91,749 $94,501 Benefits $25,190 $25,945 $0 $27,525 $28,351 $29,202 $30,078 $30,980 $31,910 $32,867 $33,853 Auxilliary Personnel $221,850 $228,506 $0 $242,422 $249,694 $257,185 $264,901 $272,848 $281,033 $289,464 $298,148 Non-Personnel Expenses Residential Life-Non-Personnel $203,877 $209,994 $0 $222,782 $229,466 $236,350 $243,440 $250,744 $258,266 $266,014 $273,994 Services $57,579 $59,306 $0 $62,918 $64,805 $66,750 $68,752 $70,815 $72,939 $75,127 $77,381 Capital Projects $8,686 $8,947 $0 $9,491 $9,776 $10,069 $10,371 $10,683 $11,003 $11,333 $11,673 Total Expenses $587,000 $605,000 $0 $642,000 $661,000 $681,000 $702,000 $723,000 $744,000 $767,000 $790,000 Net Operating Income $152,000 $199,000 $0 $267,000 $293,000 $310,000 $329,000 $348,000 $370,000 $391,000 $414,000 Existing Debt Service $103,000 $102,000 $102,000 $102,000 $103,000 $102,000 $102,000 $102,000 $103,000 $102,000 $102,000 New Debt Service $0 $0 $421,029 $421,029 $421,029 $421,029 $421,029 $421,029 $421,029 $421,029 $421,029 Total Debt Service $103,000 $102,000 $523,029 $523,029 $524,029 $523,029 $523,029 $523,029 $524,029 $523,029 $523,029 Annual Cash Flow $49,000 $97,000 ($523,029) ($256,029) ($231,029) ($213,029) ($194,029) ($175,029) ($154,029) ($132,029) ($109,029) Debt Coverage Ratio
96 Morehead State University Residential Life Master Plan Eagle Lake Apartments Revenue Assumptions Expense Assumptions Capital Cost Assumptions Summer & Break Revenue (%) 5.0% Existing Square Footage 37,005 Construction Hard Cost $0 Conference Revenues/SF $0.00 Res. Life Resonnel/SF $0.67 Soft Costs (% of Hard) 30% Other Revenues /SF $0.23 Benefit Rate 36% Soft Costs $0 Auxilliary Personnel/SF $2.12 Total Project Cost $0 Other Revenue Inflation Rate 3% Res. Life Non-Personnel/SF $1.42 Debt Term NA Services/SF $0.55 Interest Rate NA Capital Projects/SF $0.08 Annual Debt Service $0 ` Expense Inflation Rate 3% Master Plan Implementation Year Current Year Bedroom Apartments Rental Rate (1-B Apt)/Month $650 $676 $703 $731 $760 $791 $822 $855 $890 $925 $962 2-Bedroom Apartments Rental Rate (2-B Apt)/Month $850 $884 $919 $956 $994 $1,034 $1,076 $1,119 $1,163 $1,210 $1,258 Non-Revenue Units Total Units (Max. Design Capacity) Average Annual Occupancy 90% 90% 90% 90% 90% 90% 90% 90% 90% 90% 90% Annual Rental Rate Inflation Rate 4% 4% 4% 4% 4% 4% 4% 4% 4% 4% Premium For Other Units NA NA NA NA NA NA NA NA NA NA NA 2005/ / / / / / / / / / / Bedroom Revenues $122,850 $127,764 $132,875 $138,190 $143,717 $149,466 $155,444 $161,662 $168,129 $174,854 $181,848 2-Bedroom Revenues $38,250 $39,780 $41,371 $43,026 $44,747 $46,537 $48,398 $50,334 $52,348 $54,442 $56,619 Summer & Break Revenues $8,055 $8,377 $8,712 $9,061 $9,423 $9,800 $10,192 $10,600 $11,024 $11,465 $11,923 Conference Revenues $0 $0 $0 $0 $0 $0 $0 $0 $0 $0 $0 Other Revenues $8,511 $8,766 $9,029 $9,300 $9,579 $9,867 $10,163 $10,468 $10,782 $11,105 $11,438 Total Revenues $178,000 $185,000 $192,000 $200,000 $207,000 $216,000 $224,000 $233,000 $242,000 $252,000 $262,000 Personnel Expenses Residential Life $24,824 $25,569 $26,336 $27,126 $27,940 $28,778 $29,641 $30,530 $31,446 $32,390 $33,361 Benefits $8,893 $9,159 $9,434 $9,717 $10,009 $10,309 $10,618 $10,937 $11,265 $11,603 $11,951 Auxilliary Personnel $78,319 $80,669 $83,089 $85,581 $88,149 $90,793 $93,517 $96,323 $99,212 $102,189 $105,254 Non-Personnel Expenses Residential Life-Non-Personnel $52,417 $53,989 $55,609 $57,277 $58,996 $60,766 $62,588 $64,466 $66,400 $68,392 $70,444 Services $20,327 $20,937 $21,565 $22,212 $22,878 $23,564 $24,271 $24,999 $25,749 $26,522 $27,318 Capital Projects $3,066 $3,158 $3,253 $3,351 $3,451 $3,555 $3,661 $3,771 $3,884 $4,001 $4,121 Total Expenses $188,000 $193,000 $199,000 $205,000 $211,000 $218,000 $224,000 $231,000 $238,000 $245,000 $252,000 Net Operating Income -$10,000 -$8,000 -$7,000 -$5,000 -$4,000 -$2,000 $0 $2,000 $4,000 $7,000 $10,000 Existing Debt Service $294,000 $292,000 $293,000 $295,000 $295,000 $296,000 $295,000 $295,000 $293,000 $296,000 $297,000 New Debt Service $0 $0 $0 $0 $0 $0 $0 $0 $0 $0 $0 Total Debt Service $294,000 $292,000 $293,000 $295,000 $295,000 $296,000 $295,000 $295,000 $293,000 $296,000 $297,000 Annual Cash Flow ($304,000) ($300,000) ($300,000) ($300,000) ($299,000) ($298,000) ($295,000) ($293,000) ($289,000) ($289,000) ($287,000) Debt Coverage Ratio
97 Morehead State University Residential Life Master Plan Gilley Apartments Revenue Assumptions Expense Assumptions Capital Cost Assumptions Summer & Break Revenue/SF 5.0% Existing Square Footage 7,500 Construction Hard Cost $0 Conference Revenues/SF $0.00 Res. Life Resonnel/SF $0.67 Soft Costs (% of Hard) 30% Other Revenues /SF $0.23 Benefit Rate 36% Soft Costs $0 Auxilliary Personnel/SF $2.12 Total Project Cost $0 Other Revenue Inflation Rate 3% Res. Life Non-Personnel/SF $1.42 Debt Term NA Services/SF $0.55 Interest Rate NA Capital Projects/SF $0.08 Annual Debt Service $0 ` Expense Inflation Rate 3% Master Plan Implementation Year Current Year B Units Rental Rate (2-B Units)/Month $850 $884 $919 $956 $994 $1,034 $1,076 $1,119 $1,163 $1,210 $1,258 Other Units Rental Rate (Other Units) $0 $0 $0 $0 $0 $0 $0 $0 $0 $0 $0 Non-Revenue Units Total Units (Max. Design Capacity) Average Annual Occupancy 88% 88% 88% 88% 88% 88% 88% 88% 88% 88% 88% Annual Rental Rate Inflation Rate 4% 4% 4% 4% 4% 4% 4% 4% 4% 4% Premium For Other Units 0% 0% 0% 0% 0% 0% 0% 0% 0% 0% 0% 2005/ / / / / / / / / / / B Unit Revenue $59,840 $62,234 $64,723 $67,312 $70,004 $72,805 $75,717 $78,745 $81,895 $85,171 $88,578 Other Unit Revenue $0 $0 $0 $0 $0 $0 $0 $0 $0 $0 $0 Summer & Break Revenues $2,992 $3,112 $3,236 $3,366 $3,500 $3,640 $3,786 $3,937 $4,095 $4,259 $4,429 Conference Revenues $0 $0 $0 $0 $0 $0 $0 $0 $0 $0 $0 Other Revenues $1,725 $1,777 $1,830 $1,885 $1,942 $2,000 $2,060 $2,122 $2,185 $2,251 $2,318 Total Revenues $65,000 $67,000 $70,000 $73,000 $75,000 $78,000 $82,000 $85,000 $88,000 $92,000 $95,000 Personnel Expenses Residential Life $5,031 $5,182 $5,338 $5,498 $5,663 $5,833 $6,008 $6,188 $6,373 $6,565 $6,762 Benefits $1,802 $1,856 $1,912 $1,969 $2,029 $2,089 $2,152 $2,217 $2,283 $2,352 $2,422 Auxilliary Personnel $15,873 $16,350 $16,840 $17,345 $17,866 $18,402 $18,954 $19,522 $20,108 $20,711 $21,332 Non-Personnel Expenses Residential Life-Non-Personnel $10,624 $10,942 $11,271 $11,609 $11,957 $12,316 $12,685 $13,066 $13,458 $13,861 $14,277 Services $4,120 $4,243 $4,371 $4,502 $4,637 $4,776 $4,919 $5,067 $5,219 $5,375 $5,537 Capital Projects $621 $640 $659 $679 $699 $720 $742 $764 $787 $811 $835 Total Expenses $38,000 $39,000 $40,000 $42,000 $43,000 $44,000 $45,000 $47,000 $48,000 $50,000 $51,000 Net Operating Income $27,000 $28,000 $30,000 $31,000 $32,000 $34,000 $37,000 $38,000 $40,000 $42,000 $44,000 Existing Debt Service $0 $0 $0 $0 $0 $0 $0 $0 $0 $0 $0 New Debt Service $0 $0 $0 $0 $0 $0 $0 $0 $0 $0 $0 Total Debt Service $0 $0 $0 $0 $0 $0 $0 $0 $0 $0 $0 Annual Cash Flow $27,000 $28,000 $30,000 $31,000 $32,000 $34,000 $37,000 $38,000 $40,000 $42,000 $44,000 Debt Coverage Ratio NA NA NA NA NA NA NA NA NA NA NA
98 Morehead State University Residential Life Master Plan Mays Hall Apartments Revenue Assumptions Expense Assumptions Capital Cost Assumptions Summer & Break Revenue (%) 5.0% Existing Square Footage 37,903 Construction Hard Cost $0 Conference Revenues/SF $0.00 Res. Life Resonnel/SF $0.67 Soft Costs (% of Hard) 30% Other Revenues /SF $0.23 Benefit Rate 36% Soft Costs $0 Auxilliary Personnel/SF $2.12 Total Project Cost $0 Other Revenue Inflation Rate 3% Res. Life Non-Personnel/SF $1.42 Debt Term NA Services/SF $0.55 Interest Rate NA Capital Projects/SF $0.08 Annual Debt Service $0 ` Expense Inflation Rate 3% Master Plan Implementation Year Current Year Studio Apartments Rental Rate (Studio)/Month $500 $520 $541 $562 $585 $608 $633 $658 $684 $712 $740 1-Bedroom Apartments/Month Rental Rate (1-B Apt) $600 $624 $649 $675 $702 $730 $759 $790 $821 $854 $888 2-Bedroom Apartments/Month Rental Rate (2-B Apt) $850 $884 $919 $956 $994 $1,034 $1,076 $1,119 $1,163 $1,210 $1,258 Non-Revenue Units Total Units (Max. Design Capacity) Average Annual Occupancy 81% 81% 81% 81% 81% 81% 81% 81% 81% 81% 81% Annual Rental Rate Inflation Rate 4% 4% 4% 4% 4% 4% 4% 4% 4% 4% Premium For Other Units NA NA NA NA NA NA NA NA NA NA NA 2005/ / / / / / / / / / /2016 Studio Revenues $32,400 $33,696 $35,044 $36,446 $37,903 $39,420 $40,996 $42,636 $44,342 $46,115 $47,960 1-Bedroom Revenues $126,360 $131,414 $136,671 $142,138 $147,823 $153,736 $159,886 $166,281 $172,932 $179,850 $187,044 2-Bedroom Revenues $89,505 $93,085 $96,809 $100,681 $104,708 $108,897 $113,252 $117,782 $122,494 $127,394 $132,489 Summer & Break Revenues $12,413 $12,786 $13,169 $13,564 $13,971 $14,390 $14,822 $15,267 $15,725 $16,196 $16,682 Conference Revenues $0 $0 $0 $0 $0 $0 $0 $0 $0 $0 $0 Other Revenues $8,718 $8,979 $9,249 $9,526 $9,812 $10,106 $10,409 $10,722 $11,043 $11,375 $11,716 Total Revenues $269,000 $280,000 $291,000 $302,000 $314,000 $327,000 $339,000 $353,000 $367,000 $381,000 $396,000 Personnel Expenses Residential Life $25,426 $26,189 $26,975 $27,784 $28,618 $29,476 $30,361 $31,271 $32,210 $33,176 $34,171 Benefits $9,108 $9,382 $9,663 $9,953 $10,252 $10,559 $10,876 $11,202 $11,538 $11,884 $12,241 Auxilliary Personnel $80,220 $82,626 $85,105 $87,658 $90,288 $92,997 $95,786 $98,660 $101,620 $104,668 $107,808 Non-Personnel Expenses Residential Life-Non-Personnel $53,689 $55,300 $56,959 $58,667 $60,427 $62,240 $64,107 $66,031 $68,011 $70,052 $72,153 Services $20,820 $21,445 $22,088 $22,751 $23,433 $24,136 $24,860 $25,606 $26,374 $27,166 $27,981 Capital Projects $3,141 $3,235 $3,332 $3,432 $3,535 $3,641 $3,750 $3,863 $3,979 $4,098 $4,221 Total Expenses $192,000 $198,000 $204,000 $210,000 $217,000 $223,000 $230,000 $237,000 $244,000 $251,000 $259,000 Net Operating Income $77,000 $82,000 $87,000 $92,000 $97,000 $104,000 $109,000 $116,000 $123,000 $130,000 $137,000 Existing Debt Service $460,000 $458,000 $460,000 $461,000 $463,000 $467,000 $470,000 $472,000 $0 $0 $0 New Debt Service $0 $0 $0 $0 $0 $0 $0 $0 $0 $0 $0 Total Debt Service $460,000 $458,000 $460,000 $461,000 $463,000 $467,000 $470,000 $472,000 $0 $0 $0 Annual Cash Flow ($383,000) ($376,000) ($373,000) ($369,000) ($366,000) ($363,000) ($361,000) ($356,000) $123,000 $130,000 $137,000 Debt Coverage Ratio NA NA NA
99 Morehead State University Residential Life Master Plan Normal Hall Apartments Revenue Assumptions Expense Assumptions Capital Cost Assumptions Summer & Break Revenue/SF 5.0% Existing Square Footage 27,270 Construction Hard Cost $0 Conference Revenues/SF $0.00 Res. Life Resonnel/SF $0.67 Soft Costs (% of Hard) 30% Other Revenues /SF $0.23 Benefit Rate 36% Soft Costs $0 Auxilliary Personnel/SF $2.12 Total Project Cost $0 Other Revenue Inflation Rate 3% Res. Life Non-Personnel/SF $1.42 Debt Term NA Services/SF $0.55 Interest Rate NA Capital Projects/SF $0.08 Annual Debt Service $0 ` Expense Inflation Rate 3% Master Plan Implementation Year Current Year Bedroom Apartments - Furnished Rental Rate (1-B Apt - Furnished)/Month $450 $580 $603 $627 $652 $679 $706 $734 $763 $794 $826 1-Bedroom Apartments - Unfurnished Rental Rate (1-B Apt - Unfurnished)/Month $425 $560 $582 $606 $630 $655 $681 $709 $737 $766 $797 Non-Revenue Units Total Units (Max. Design Capacity) Average Annual Occupancy 91% 91% 91% 91% 91% 91% 91% 91% 91% 91% 91% Annual Rental Rate Inflation Rate NA 4% 4% 4% 4% 4% 4% 4% 4% 4% Premium For Other Units NA NA NA NA NA NA NA NA NA NA NA 2005/ / / / / / / / / / / Bedroom (Furnished) Revenues $122,850 $147,784 $153,695 $159,843 $166,237 $172,886 $179,802 $186,994 $194,474 $202,253 $210,343 1-Bedroom (Unfurnished) Revenues $30,940 $50,960 $52,998 $55,118 $57,323 $59,616 $62,001 $64,481 $67,060 $69,742 $72,532 Summer & Break Revenues $7,690 $9,937 $10,335 $10,748 $11,178 $11,625 $12,090 $12,574 $13,077 $13,600 $14,144 Conference Revenues $0 $0 $0 $0 $0 $0 $0 $0 $0 $0 $0 Other Revenues $6,272 $6,460 $6,654 $6,854 $7,059 $7,271 $7,489 $7,714 $7,945 $8,184 $8,429 Total Revenues $168,000 $215,000 $224,000 $233,000 $242,000 $251,000 $261,000 $272,000 $283,000 $294,000 $305,000 Personnel Expenses Residential Life $18,294 $18,842 $19,408 $19,990 $20,590 $21,207 $21,843 $22,499 $23,174 $23,869 $24,585 Benefits $6,553 $6,750 $6,952 $7,161 $7,376 $7,597 $7,825 $8,060 $8,301 $8,550 $8,807 Auxilliary Personnel $57,715 $59,447 $61,230 $63,067 $64,959 $66,908 $68,915 $70,983 $73,112 $75,306 $77,565 Non-Personnel Expenses Residential Life-Non-Personnel $38,627 $39,786 $40,980 $42,209 $43,476 $44,780 $46,123 $47,507 $48,932 $50,400 $51,912 Services $14,979 $15,429 $15,892 $16,368 $16,859 $17,365 $17,886 $18,423 $18,975 $19,545 $20,131 Capital Projects $2,260 $2,327 $2,397 $2,469 $2,543 $2,620 $2,698 $2,779 $2,863 $2,948 $3,037 Total Expenses $138,000 $143,000 $147,000 $151,000 $156,000 $160,000 $165,000 $170,000 $175,000 $181,000 $186,000 Net Operating Income $30,000 $72,000 $77,000 $82,000 $86,000 $91,000 $96,000 $102,000 $108,000 $113,000 $119,000 Existing Debt Service $27,000 $26,000 $27,000 $27,000 $27,000 $27,000 $27,000 $26,000 $27,000 $26,000 $27,000 New Debt Service $0 $0 $0 $0 $0 $0 $0 $0 $0 $0 $0 Total Debt Service $27,000 $26,000 $27,000 $27,000 $27,000 $27,000 $27,000 $26,000 $27,000 $26,000 $27,000 Annual Cash Flow $3,000 $46,000 $50,000 $55,000 $59,000 $64,000 $69,000 $76,000 $81,000 $87,000 $92,000 Debt Coverage Ratio
100 Morehead State University Residential Life Master Plan New Apartment Complex Revenue Assumptions Expense Assumptions Capital Cost Assumptions Summer & Break Revenue/SF $0.00 Existing Square Footage 140,000 Construction Hard Cost $14,980,000 Conference Revenues/SF $0.00 Res. Life Resonnel/SF $0.67 Soft Costs (% of Hard) 35% Other Revenues /SF $0.23 Benefit Rate 36% Soft Costs $5,243,000 Auxilliary Personnel/SF $2.12 Total Project Cost $20,223,000 Other Revenue Inflation Rate 3% Res. Life Non-Personnel/SF $1.42 Debt Term 20 Services/SF $0.55 Interest Rate 5.25% Capital Projects/SF $0.08 Annual Debt Service $1,657,321 ` Expense Inflation Rate 3% Number of New Beds 400 Square Feet/Bed 350 Hard Cost/Square Foot $ Master Plan Implementation Year Current Year Beds in 4-bed Units Rental Rate (4-B Units)/Month $400 $416 $433 $450 $468 $487 $506 $526 $547 $569 $592 Beds in Other Units Rental Rate (Other Units) $0 $0 $0 $0 $0 $0 $0 $0 $0 $0 $0 Non-Revenue Units Total Units (Max. Design Capacity) Average Annual Occupancy 90% 90% 90% 90% 90% 90% 90% 90% 90% 90% 90% Annual Rental Rate Inflation Rate 4% 4% 4% 4% 4% 4% 4% 4% 4% 4% Premium For Other Units 0% 0% 0% 0% 0% 0% 0% 0% 0% 0% 0% 2005/ / / / / / / / / / / Bedroom Revenues $0 $0 $0 $0 $0 $2,060,329 $2,142,742 $2,228,452 $2,317,590 $2,410,293 $2,506,705 Other Unit Revenues $0 $0 $0 $0 $0 $0 $0 $0 $0 $0 $0 Summer & Break Revenues $0 $0 $0 $0 $0 $0 $0 $0 $0 $0 $0 Conference Revenues $0 $0 $0 $0 $0 $0 $0 $0 $0 $0 $0 Other Revenues $0 $0 $0 $0 $0 $37,329 $38,448 $39,602 $40,790 $42,014 $43,274 Total Revenues $0 $0 $0 $0 $0 $2,098,000 $2,181,000 $2,268,000 $2,358,000 $2,452,000 $2,550,000 Personnel Expenses Residential Life $0 $0 $0 $0 $0 $108,875 $112,141 $115,505 $118,970 $122,539 $126,216 Benefits $0 $0 $0 $0 $0 $39,002 $40,172 $41,377 $42,618 $43,897 $45,214 Auxilliary Personnel $0 $0 $0 $0 $0 $343,496 $353,801 $364,415 $375,347 $386,607 $398,206 Non-Personnel Expenses Residential Life-Non-Personnel $0 $0 $0 $0 $0 $229,893 $236,789 $243,893 $251,210 $258,746 $266,508 Services $0 $0 $0 $0 $0 $89,151 $91,825 $94,580 $97,417 $100,340 $103,350 Capital Projects $0 $0 $0 $0 $0 $13,449 $13,852 $14,268 $14,696 $15,137 $15,591 Total Expenses $0 $0 $0 $0 $0 $824,000 $849,000 $874,000 $900,000 $927,000 $955,000 Net Operating Income $0 $0 $0 $0 $0 $1,274,000 $1,332,000 $1,394,000 $1,458,000 $1,525,000 $1,595,000 Existing Debt Service $0 $0 $0 $0 $0 $0 $0 $0 $0 $0 $0 New Debt Service $0 $0 $0 $0 $0 $1,657,000 $1,657,000 $1,657,000 $1,657,000 $1,657,000 $1,657,000 Total Debt Service $0 $0 $0 $0 $0 $1,657,000 $1,657,000 $1,657,000 $1,657,000 $1,657,000 $1,657,000 Annual Cash Flow $0 $0 $0 $0 $0 ($383,000) ($325,000) ($263,000) ($199,000) ($132,000) ($62,000) Debt Coverage Ratio NA NA NA NA NA
101 Section I
102 This page intentionally blank

103 RECREATION CENTER LOCATION ANALYSIS INTRODUCTION B&D performed a location analysis of potential recreation facilities to determine whether possible sites would be able to accommodate a recreation center that can meet the needs of the University s student population. The building concepts and diagrams described below are intended to investigate potential recreational facilities with the context of site capacities. They are not meant to suggest specific architectural design solutions or resolve technical or building code issues. These issues are typically addressed in the detailed programs of architectural requirements and in the schematic design drawings. LOCATIONS The University pre-determined five potential recreation center sites: 1. Henry Ward Place; 2. Residential Neighborhood; 3. Adron Doran University Center (ADUC); 4. Cartmell Hall and the Police Department; and 5. Existing Wellness Center Morehead State University Comprehensive Housing Master Plan I. 1
1. Project Overview 2. Objectives 3. Key Findings 4. Market Analysis Detailed Findings 5. Survey Analysis 6. Demand Analysis 7.
 Student Housing West 1. Project Overview 2. Objectives 3. Key Findings 4. Market Analysis Detailed Findings 5. Survey Analysis 6. Demand Analysis 7. Next Steps Project Overview Public-Private Partnership
20 South 3rd Street. Suite #219. Columbus, OH ri c h a ri e th j o n e s. c o m. th j o n e s.c o m
 s 20 South 3rd Street. Suite 210 - #219. Columbus, OH 43215 ri c h a rd @ ri e th j o n e s. c o m. www.rie th j o n e s.c o m. 614.795.742 4 INTRODUCTION ( Lake State, LSSU, or the University ) is currently
LAMBTON HALL & FAMILY HOUSING RENOVATIONS
 2012 LAMBTON HALL & FAMILY HOUSING RENOVATIONS Student Housing Services overview to PRPC regarding the proposed renovation to Lambton Hall and 78 College Ave. Introduction In the Fall 2011 semester the
7.0 HOUSING ELEMENT (1) DATA REQUIREMENTS. a) Inventory of Existing Beds by Type
 DATA REQUIREMENTS. a) Inventory of Existing Beds by Type") 7.0 HOUSING ELEMENT (1) DATA REQUIREMENTS. a) Inventory of Existing Beds by Type As indicated in Table 7.1, the current total number of bed spaces at Modesto A. Maidique equates to Two thousand seven hundred
7.0 HOUSING ELEMENT (1) DATA REQUIREMENTS. a) Inventory of Existing Beds by Type As indicated in Table 7.1, the current total number of bed spaces at Modesto A. Maidique equates to Two thousand seven hundred
EXHIBIT 17. Anderson Strickler - Bloomsburg University Housing Feasibility Study
 EXHIBIT 17 Anderson Strickler - Bloomsburg University Housing Feasibility Study Housing Feasibility Study Bloomsburg University ANDERSON STRICKLER, LLC 18310 Montgomery Village Avenue, Suite 520 Gaithersburg,
April 26, 2013* Announcement: Student Housing conducts 37 th annual City of Davis Vacancy and Rental Rate Survey.
 April 26, 2013* Announcement: Student Housing conducts 37 th annual City of Davis Vacancy and Rental Rate Survey. The survey findings for this year report that the vacancy rate is at 1.7%. Last year the
December 16, Announcement: Student Housing conducts 36 th annual City of Davis Vacancy and Rental Rate Survey.
 December 16, 2011 Announcement: Student Housing conducts 36 th annual City of Davis Vacancy and Rental Rate Survey. The apartment vacancy rate in the city of Davis decreased since last fall to 2.5 percent,
Housing Information Session Housing Contracts, Online Room Selection, Building Layout
 Housing Information Session Housing Contracts, Online Room Selection, Building Layout Office of Housing & Residence Life Spring 2018 No deposits are required for any of our contracts Space is available
WAYNE STATE UNIVERSITY. Housing Facilities Master Plan
 WAYNE STATE UNIVERSITY Housing Facilities Master Plan 2016-2026 January 29, 2016 1 Briefly review significant milestones and trends in housing facilities, occupancy, housing system finances, and programming
UNIVERSITY OF CALIFORNIA, SANTA CRUZ
 STUDENT HOUSING DEMAND ANALYSIS UNIVERSITY OF CALIFORNIA, SANTA CRUZ APRIL 2018 FINAL REPORT INSPIRE. EMPOWER. ADVANCE. PREFACE AND TABLE OF CONTENTS PREFACE In January 2018, CHF-Santa Cruz I, L.L.C.
UNIVERSITY OF WASHINGTON TACOMA
 STUDENT HOUSING DEMAND ANALYSIS PREPARED FOR UNIVERSITY OF WASHINGTON TACOMA FINAL REPORT JANUARY 2016 INSPIRE. EMPOWER. ADVANCE. STUDENT HOUSING DEMAND ANALYSIS UNIVERSITY OF WASHINGTON TACOMA BRAILSFORD
Academic Year. Office of Student Life Hawk s Nest (608)
") 2019-2020 Academic Year Office of Student Life Hawk s Nest (608) 796-3116 residencelife@viterbo.edu December 3, 2018 Dear Viterbo Students: Thank you for your interest in on-campus housing! The Office
2019-2020 Academic Year Office of Student Life Hawk s Nest (608) 796-3116 residencelife@viterbo.edu December 3, 2018 Dear Viterbo Students: Thank you for your interest in on-campus housing! The Office
TO MEMBERS OF THE FINANCE AND CAPITAL STRATEGIES COMMITTEE: DISCUSSION ITEM
 F13 Office of the President TO MEMBERS OF THE FINANCE AND CAPITAL STRATEGIES : For Meeting of DISCUSSION ITEM ORCHARD PARK FAMILY HOUSING AND GRADUATE STUDENT HOUSING REDEVELOPMENT PROJECT AND WEST VILLAGE
TO MEMBERS OF THE COMMITTEE ON GROUNDS AND BUILDINGS: ACTION ITEM
 GB5 Office of the President TO MEMBERS OF THE COMMITTEE ON : For Meeting of ACTION ITEM AMENDMENT OF THE BUDGET FOR STATE CAPITAL IMPROVEMENTS AND THE CAPITAL IMPROVEMENT PROGRAM AND APPROVAL OF EXTERNAL
STUDENT HOUSING MARKET STUDY PREPARED FOR SHEPHERD UNIVERSITY INSPIRE. EMPOWER. ADVANCE.
 STUDENT HOUSING MARKET STUDY PREPARED FOR SHEPHERD UNIVERSITY OCTOBER 2015 FINAL REPORT INSPIRE. EMPOWER. ADVANCE. PREFACE PREFACE In March 2015, Shepherd University ( Shepherd of the University ) engaged
BISCAYNE BAY CAMPUS REPLACEMENT STUDENT HOUSING
 BISCAYNE BAY CAMPUS REPLACEMENT STUDENT HOUSING 1 Why the Need for Replacement Housing? BBC Bay Vista Housing, containing 235 units accommodating 510 students, opened fall 1984 to recruit high-performing
Appraisal and Market Analysis of Indoor Waterpark Resorts
 Appraisal and Market Analysis of Indoor Waterpark Resorts By David J. Sangree, MAI, CPA, ISHC An appraisal of an indoor waterpark resort is similar to other appraisals in that it is a professional appraiser
Shawnee Landing TIF Project. City of Shawnee, Kansas. Need For Assistance Analysis
 Shawnee Landing TIF Project City of Shawnee, Kansas Need For Assistance Analysis December 17, 2014 Table of Contents 1 EXECUTIVE SUMMARY... 1 2 PURPOSE... 2 3 THE PROJECT... 3 4 ASSISTANCE REQUEST... 7
Celebrating Campus Community. Housing Sign-Up Information
 Celebrating Campus Community Housing Sign-Up Information 2017 2018 Office of Residence Life, 2 nd Floor Park Center reslife@meredith.edu 919-760-8633 Welcome to Housing Sign-up for the 2017 2018 academic
Housing Rates The following charges are required in addition to housing room rates.
 Housing Costs The figures represent a snapshot of 2018-19 pricing that you can use as you consider budgets for next year. The information is provided for sample budgeting purposes only and not intended
CAZENOVIA COLLEGE HOUSING & MEAL PLAN SELECTION MANUAL
 CAZENOVIA COLLEGE HOUSING & MEAL PLAN SELECTION MANUAL 2017/2018 1 HOUSING & MEAL PLAN SELECTION (2017/2018) Cazenovia College Housing Policy Cazenovia College is primarily a residential community. All
Housing and Residential Life Room & Board Rate Proposal for FY17
 Housing and Residential Life Room & Board Rate Proposal for FY17 1 Review current occupancy, room and board rates, and FY16 budget Discuss factors affecting the room and board recommendation Present recommendations
Addendum No. 1 June 18, 2010
 Facilities Planning, Construction, and Management Office of Financial Management Procurement Services 555 West 57 th Street 11 th Floor New York, New York 10019 DDCM.ContractsDept@mail.cuny.edu Addendum
APPENDIX A. Market Study Standards and Requirements
 APPENDIX A Market Study Standards and Requirements Section 42(m)(1)(A)(iii) of the IRS Code and Section IV(A)(2) of the 2018 Qualified Allocation Plan (QAP) require market studies for all low-income housing
Ashland Transit Triangle:
 Ashland Transit Triangle: Strategic Approach to Implementation Fregonese Associates Inc. 12/19/16 Phase I of the Transit Triangle Study Conducted in the Fall of 2015 Tasks Completed: Market analysis Initial
DEVELOPER SELECTION PROCESS
 QUESTIONS ANSWERS DEVELOPER SELECTION PROCESS 1. What time is the response deadline on March 10? All required materials must be received in the University s Planning and Real Estate office no later than
REPORT - RIBA Student Destinations Survey 2014
 REPORT - RIBA Student Destinations Survey 2014 There needs to be a stronger and more direct link between the architectural profession and the study of it as a subject at university. It is a profession
ROWAN UNIVERSITY. Housing Master Plan Update INSPIRE. EMPOWER. ADVANCE. APPENDIX: FINAL REPORT FEBRUARY
 ROWAN UNIVERSITY Housing Master Plan Update FEBRUARY 2 0 1 6 APPENDIX: FINAL REPORT INSPIRE. EMPOWER. ADVANCE. This page intentionally blank. APPENDIX 1. STRATEGIC ASSET VALUE This page intentionally blank.
bae urban economics 2017 Apartment Vacancy and Rental Rate Survey Presented on behalf of UC Davis Student Housing and Dining Services
 bae urban economics 2017 Apartment Vacancy and Rental Rate Survey Presented on behalf of UC Davis Student Housing and Dining Services Overview The annual Apartment Vacancy and Rental Rate Survey collects
REPORT - RIBA Student Destinations Survey 2013
 REPORT - RIBA Student Destinations Survey 2013 Introduction The RIBA Student Destinations Survey is a partnership project between the RIBA and the University of Sheffield. It is a study to be delivered
UPPERCLASS HOUSING
 2012-2013 UPPERCLASS HOUSING The convenience of campus the advantages of upperclass housing Apply for your RIT housing at myhousing.rit.edu RIT transfer and graduate students Transfer and graduate students
7224 Nall Ave Prairie Village, KS 66208
 Real Results - Income Package 10/20/2014 TABLE OF CONTENTS SUMMARY RISK Summary 3 RISC Index 4 Location 4 Population and Density 5 RISC Influences 5 House Value 6 Housing Profile 7 Crime 8 Public Schools
chapter 5 campus housing
 V O L U M E T W O chapter 5 campus housing chapter 5 A home is not a mere transient shelter: Em que nia simosti dem dolupta its essence lies in the personalities of the tibusamus sit, in consequist, sit,
CHAPTER 4: MODERATE INCOME HOUSING ELEMENT
 The Utah Municipal Code, -9a-()(a)(iii) requires that all cities adopt a Plan for Moderate Income Housing as part of their General Plan. Section -9a-() of the Utah Municipal Code, outlines that this Plan
Document under Separate Cover Refer to LPS State of Housing
 Document under Separate Cover Refer to LPS5-17 216 State of Housing Contents Housing in Halton 1 Overview The Housing Continuum Halton s Housing Model 3 216 Income & Housing Costs 216 Indicator of Housing
The Township of Montclair Seymour Street Redevelopment Plan Fiscal Impact Report
 August 12, 2016 The Township of Montclair Seymour Street Redevelopment Plan Fiscal Impact Report Summary of Findings: the following is a Fiscal Impact Report regarding the Seymour Street Redevelopment
Part 1. Estimating Land Value Using a Land Residual Technique Based on Discounted Cash Flow Analysis
 Table of Contents Overview... v Seminar Schedule... ix SECTION 1 Part 1. Estimating Land Value Using a Land Residual Technique Based on Discounted Cash Flow Analysis Preview Part 1... 1 Land Residual Technique...
City Center Market-Rate Housing Study
 City Center Market-Rate Housing Study OVERVIEW The City of Bellingham, with the assistance of students from Western Washington University, conducted a study of market-rate rental housing during April and
The Student Housing Conundrum Balancing Need with Community Implications
 The Student Housing Conundrum Balancing Need with Community Implications Georgia Planning Association Fall Conference 2018 September 6, 2018, 2:00 3:15 PM Moderator: Dana Johnson, Director Cobb County
4 York Region Housing Incentives Study
 Clause 4 in Report No. 15 of Committee of the Whole was adopted, without amendment, by the Council of The Regional Municipality of York at its meeting held on October 15, 2015. 4 Committee of the Whole
(1) DATA REQUIREMENTS. This element shall be based on the following data:
 DATA REQUIREMENTS. This element shall be based on the following data:") 7.0 PURPOSE The purpose of this element is to ensure the provision of public and private housing facilities on the University campus and within the host community to adequately meet the needs of the projected
7.0 PURPOSE The purpose of this element is to ensure the provision of public and private housing facilities on the University campus and within the host community to adequately meet the needs of the projected
H o u s i n g N e e d i n E a s t K i n g C o u n t y
 1999 2000 2001 2002 2003 2004 2005 2006 2007 2008 2009 2010 Number of Affordable Units H o u s i n g N e e d i n E a s t K i n g C o u n t y HOUSING AFFORDABILITY Cities planning under the state s Growth
NY INTERNSHIP PROGRAM POTENTIAL HOUSING OPTIONS 2019
 NY INTERNSHIP PROGRAM POTENTIAL HOUSING OPTIONS 2019 TABLE OF CONTENTS RECOMMENDED HOUSING LOCATIONS...2 INTERNATIONAL HOUSE... 2 92-Y... 2 EDUCATIONAL HOUSING SERVICES... 3 LEXINGTON RESIDENCE... 4 ST.
Briefing Book. State of the Housing Market Update San Francisco Mayor s Office of Housing and Community Development
 Briefing Book State of the Housing Market Update 2014 San Francisco Mayor s Office of Housing and Community Development August 2014 Table of Contents Project Background 2 Household Income Background and
I. PROPOSED RATES (Room and Board) These rates have been reviewed by staff and supported by the Association of Residence Halls.
 These rates have been reviewed by staff and supported by the Association of Residence Halls.") KANSAS STATE UNIVERSITY HOUSING AND FOOD SERVICE RATES I. PROPOSED RATES (Room and Board) These rates have been reviewed by staff and supported by the Association of Residence Halls. Regular Semester Room
KANSAS STATE UNIVERSITY HOUSING AND FOOD SERVICE RATES I. PROPOSED RATES (Room and Board) These rates have been reviewed by staff and supported by the Association of Residence Halls. Regular Semester Room
2017 Profile of Home Buyers and Sellers
 New Jersey Report Prepared for: New Jersey REALTORS Prepared by: Research Division December 2017 New Jersey Report Table of Contents Introduction... 2 Highlights... 4 Methodology... 8 Report Prepared by:
Residential Life and Housing Handbook Housing Selection Edition
 Residential Life and Housing Handbook 2018 2019 Housing Selection Edition Important Dates 2018 2019 Calendar Event: Date: Fall Semester Returning Students Arrive Thanksgiving Break - Halls Close Thanksgiving
City of Puyallup. Parks Impact Fee Study
 City of Puyallup Parks Impact Fee Study August 23, 2005 Prepared by Financial Consulting Solutions Group, Inc. 8201 164 th Avenue NE, Suite 300 Redmond, WA 98052 tel: (425) 867-1802 fax: (425) 867-1937
THAT Council receives for information the Report from the Planner II dated April 25, 2016 with respect to the annual Housing Report update.
 Report to Council Date: April 25, 2016 File: 1200-40 To: From: Subject: City Manager Laura Bentley, Planner II, Policy & Planning Annual Housing Report Update Recommendation: THAT Council receives for
STUDENT HOUSING BUSINESS AWARDS BEST RENOVATION OF AN EXISTING PROJECT
 STUDENT HOUSING BUSINESS AWARDS BEST RENOVATION OF AN EXISTING PROJECT Seminole Flatts seminoleflatts.com 1817 W Call Street, Tallahassee, FL 32304 Capstone Real Estate Investments, LLC. SUMMARY LOOKING
Note: Student classification order is determined by one s years out of high school by the beginning of fall semester.
 4 Housing Selection Housing Selection Intentional Living Communities (ILC) The ILC process begins in late February and involves self-selected groups completing an application and submitting a group video.
2018 Profile of Home Buyers and Sellers
 Massachusetts Report Prepared for: Massachusetts Association of REALTORS Prepared by: Research Division December 2018 Massachusetts Report Table of Contents Introduction... 2 Highlights... 4 Methodology...
US Worker Cooperatives: A State of the Sector
 US Worker Cooperatives: A State of the Sector Worker cooperatives have increasingly drawn attention from the media, policy makers and academics in recent years. Individual cooperatives across the country
BUSI 330 Suggested Answers to Review and Discussion Questions: Lesson 10
 BUSI 330 Suggested Answers to Review and Discussion Questions: Lesson 10 1. The client should give you a copy of their income and expense statements for the last 3 years showing their rental income by
HOME Investment Partnership Program Project Development Funds. Application
 City of Spartanburg Neighborhood Services 145 West Broad Street Spartanburg, South Carolina 29306 HOME Investment Partnership Program Project Development Funds Application Applicant Name: Project Name:
Chapter 37. The Appraiser's Cost Approach INTRODUCTION
 Chapter 37 The Appraiser's Cost Approach INTRODUCTION The cost approach for estimating current market value starts with the recognition that a parcel of real estate contains two components - the land and
OFFERING MEMORANDUM Ellendale Place. Los Angeles, CA 90007
 OFFERING MEMORANDUM 2652-2656 Ellendale Place Los Angeles, CA 90007 2652-2656 Ellendale Place TABLE OF CONTENTS 5 7 8 9 01 Executive Summary Property Description Investment Detail Executive Summary Pro
Guide to Appraisal Reports
 Guide to Appraisal Reports What is an appraisal? An appraisal is an independent valuation of real property prepared by a qualified Appraiser and fully documented in a report. Based on a series of appraisal
WELLSVILLE AFFORDABLE HOUSING PLAN
 WELLSVILLE AFFORDABLE HOUSING PLAN 2014 DRAFT 2.2 Wellsville: Affordable Housing Plan 2014 Page 2 DRAFT 2.2 Wellsville: Affordable Housing Plan 2014 Table of Contents Summary of Affordable Housing Conditions...
2014 ACUHO-I Construction and Renovation Findings
 2014 ACUHO-I Construction and Renovation Findings Presenters Dave Sagaser, Florida State University Cynthia Parish Balogh, MGT of America, Inc. Ray Thompson, MGT of America, Inc. Case Studies Jamie Penven,
Detroit Inclusionary Housing Plan & Market Study Preliminary Inclusionary Housing Feasibility Study Executive Summary August, 2016
 Detroit Inclusionary Housing Plan & Market Study Preliminary Inclusionary Housing Feasibility Study Executive Summary August, 2016 Inclusionary Housing Plan & Market Study Objectives 1 Evaluate the citywide
LEASE TACTICS BLUEPRINT
 LEASE TACTICS BLUEPRINT www.cbre.com/florida FOR MORE INFORMATION PLEASE CONTACT Traci Jenks, CCIM Senior Associate 904.633.2613 traci.jenks@cbre.com CBRE, Inc. Licensed Real Estate Broker LEASE TACTICS
On Campus Housing Requirement
 On Campus Housing Requirement The University of Louisiana System policy requires all unmarried, full-time undergraduate students, regardless of age or emancipation status, live on campus as long as space
`FLORIDA GULF COAST UNIVERSITY HOUSING AGREEMENT SUMMER 2018
 `FLORIDA GULF COAST UNIVERSITY HOUSING AGREEMENT SUMMER 2018 This Agreement is between you ( Student ) and Florida Gulf Coast University Board of Trustees ( University ) for on-campus housing for the Summer
Housing Master Plan 2011 to 2026 Pre-Proposal Conference. May 18, 2011 University Heights South 1 (S1), Room 133 Multipurpose Room
, Room 133 Multipurpose Room") Housing Master Plan 2011 to 2026 Pre-Proposal Conference May 18, 2011 University Heights South 1 (S1), Room 133 Multipurpose Room 1 Pre-Proposal Conference Presented by: Annie Stevens, Associate Vice President,
Housing Master Plan 2011 to 2026 Pre-Proposal Conference May 18, 2011 University Heights South 1 (S1), Room 133 Multipurpose Room 1 Pre-Proposal Conference Presented by: Annie Stevens, Associate Vice President,
Unit Features/Amenities
 The Campus Corner Apartments are contemporary apartments offered exclusively to students attending Green River College. Combining the convenience of an on-campus location with the comfort of apartment
BRIEFING SUMMER What is RLI? Overview of On-Campus Housing: Facts at a Glance. Why is RLI important? The challenge. Planning
 UNIVERSITY HOUSING DIVISION OF STUDENT AFFAIRS BRIEFING SUMMER 2013 What is RLI? The Residential Life Initiatives (RLI) is a planned approach for the renewal, revitalization, and expansion of University
Frequently Asked Questions!
 Frequently Asked Questions! Who is permitted to live in the FIRS Apartments? The FIRS are first and foremost Family in Residence housing, meaning the living experience is designed for traditional undergraduate
Managing Neighborhood Change: Building Stronger Markets. Alan Mallach, Senior Fellow National Housing Institute
 Managing Neighborhood Change: Building Stronger Markets Alan Mallach, Senior Fellow National Housing Institute A neighborhood s health is powerfully driven by the extent to which it has a competitive housing
APPENDIX I: SUPPLEMENTAL INFORMATION FOR NEW DEVELOPMENT
 APPENDIX I: SUPPLEMENTAL INFORMATION FOR NEW DEVELOPMENT The following supplemental information regarding the New Development (i.e., phased new construction of Apartment Housing and demolition of the DeRoy
ROOM SELECTION IS HERE!
 ROOM SELECTION IS HERE! SBU CampRes @SBUCampRes 1h The NEW Room Selection process is here! SBU CampRes @SBUCampRes 3d The NEW Room Selection process is almost here! Stay tuned! SBU CampRes @SBUCampRes
HOUSING & RESIDENCE LIFE living the experience
 HOUSING & RESIDENCE LIFE living the experience OUR BEGINNING MATTERS TO US! Students living on campus are the heart of the ETSU community. A great college foundation is realized through the support, environment,
Offering Memorandum Western Village Apartments
 Offering Memorandum Western Village Apartments 1715.S Juniper St Nampa, ID Andrew L. Propst, MPM CPM CCIM 208-921-6963 Apropst@homeriver.com 1 Western Village Apartments Table of Contents Overview.. 3
RENTAL MARKET REPORT. Manitoba Highlights* Highlight Box. Housing market intelligence you can count on
 H o u s i n g M a r k e t I n f o r m a t i o n RENTAL MARKET REPORT Manitoba Highlights* C a n a d a M o r t g a g e a n d H o u s i n g C o r p o r a t i o n Date Released: Spring 2011 Figure 1 Winnipeg
2013 Profile of Home Buyers and Sellers Texas Report
 2013 Profile of Home Buyers and Sellers Report Prepared for: Association of REALTORS Prepared by: NATIONAL ASSOCIATION OF REALTORS Research Division December 2013 2013 Profile of Home Buyers and Sellers
Campus Housing Evaluation Study
 Campus Housing Evaluation Study for The University of North Dakota March 1, 2016 TABLE OF CONTENTS UNIVERSITY OF NORTH DAKOTA CAMPUS HOUSING EVALUATION STUDY EXECUTIVE SUMMARY Market Analysis... 1 Facility
RENTAL MARKET REPORT. Manitoba Highlights* Highlights. Housing market intelligence you can count on
 H o u s i n g M a r k e t I n f o r m a t i o n RENTAL MARKET REPORT Highlights* C a n a d a M o r t g a g e a n d H o u s i n g C o r p o r a t i o n Date Released: Spring 2012 Figure 1 Winnipeg CMA Brandon
Orange Water and Sewer Authority Water and Sewer System Development Fee Study
 Orange Water and Sewer Authority Water and Sewer System Development Fee Study March 6, 2018 March 6, 2018 Mr. Stephen Winters Director of Finance and Customer Service 400 Jones Ferry Road Carrboro, NC
Residential Life & Housing at NYU Madrid
 Residential Life & Housing at NYU Madrid NYU Madrid is the oldest of the university s global sites, established in 1958. Located in the center of the Iberian Peninsula, Madrid is the capital of Spain and
Ontario Rental Market Study:
 Ontario Rental Market Study: Renovation Investment and the Role of Vacancy Decontrol October 2017 Prepared for the Federation of Rental-housing Providers of Ontario by URBANATION Inc. Page 1 of 11 TABLE
LIVE LEARN PLAY
 2013-2014 LIVE LEARN PLAY UHR TIMELINE DATE EVENT PAGE REFERENCES Tuesday, 1/22/13 to Online application period Online Application, p 2 3 Sunday, 1/27/13 Friday, 1/25/13 Deadline to clear registration
Assessing the Cost Effectiveness of LEED Certified Homes in Kentucky By Stephen J. Glossner, Sanjeev Adhikari, and Hans Chapman
 10 The Journal of Technology Studies Assessing the Cost Effectiveness of LEED Homes in Kentucky By Stephen J. Glossner, Sanjeev Adhikari, and Hans Chapman ABSTRACT The purpose of this study was to analyze
Revised Seller/Servicer Guide Chapter 12 Multifamily Appraisals. Martin A. Skolnik, MAI (Marty) Director, Multifamily Appraisals
 Director, Multifamily Appraisals") Revised Seller/Servicer Guide Chapter 12 Multifamily Appraisals Martin A. Skolnik, MAI (Marty) Director, Multifamily Appraisals June 26, 2014 Multifamily Real Estate Valuation at Freddie Mac Freddie Mac
Revised Seller/Servicer Guide Chapter 12 Multifamily Appraisals Martin A. Skolnik, MAI (Marty) Director, Multifamily Appraisals June 26, 2014 Multifamily Real Estate Valuation at Freddie Mac Freddie Mac
Real Estate Technology
 The State of Real Estate Technology Commercial and multifamily real estate industries still rely on antiquated technology for critical business processes February 2018 Executive Summary In recent years,
EAST CHOCOLATE PLAZA - ADMINISTRATIVE MEDICAL OFFICE BUILDING
 EAST CHOCOLATE PLAZA - ADMINISTRATIVE MEDICAL OFFICE BUILDING 1135 E CHOCOLATE AVENUE HERSHEY, PA 17033 Kai Youngman Advisor 484.245.1014 Kai.youngman@svn.com Logan Fazakerley Advisor 484.245.1000 logan.fazakerley@svn.com
USF St. Petersburg Housing Project
 USF St. Petersburg Housing Project SUS Board of Governors Meeting November 8, 2018 Today s Objectives: Review the project: Share particulars of the project Overview of financing Obtain approval of resolution
Ludgvan Parish HOUSING NEED SURVEY. Report Date: 21 st January Version: 1.2 Document Status: Final Report
 Ludgvan Parish HOUSING NEED SURVEY Report Date: 21 st January 2019 Version: 1.2 Document Status: Author: Final Report Andrew Prendergast Rural Housing Enabler Affordable Housing Team, Cornwall Council
What Millennials Want
 Resident Preferences in Student Housing Design and Amenities Exclusive research conducted for Multifamily Executive s 2013 Concept Community Reaching Table of Contents Renters Which two social media channels
University Housing. Welcome Home
 University Housing Welcome Home New Home New Experiences A message from the director: Dear Students, Welcome to University Housing at the University of South Dakota. We are excited to be a part of your
USFSP Student Housing Rental Request
 USFSP Student Housing Rental Request 2017-2019 October 27, 2016 Overview Housing rates increased once (2013) in 5 yrs Without housing rate increases: Housing Inventory will not meet the Rating Agencies
COMPARISON OF THE LONG-TERM COST OF SHELTER ALLOWANCES AND NON-PROFIT HOUSING
 COMPARISON OF THE LONG-TERM COST OF SHELTER ALLOWANCES AND NON-PROFIT HOUSING Prepared for The Fair Rental Policy Organization of Ontario By Clayton Research Associates Limited October, 1993 EXECUTIVE
Notice for Suspension of Small Area Fair Market Rent (Small Area FMR) Designations: Solicitation of Comment - Docket No.
 Designations: Solicitation of Comment - Docket No.") January 11, 2018 VIA ELECTRONIC SUBMISSION Regulations Division Office of General Counsel U.S. Department of Housing and Urban Development Room 10276 451 Seventh Street SW Washington, DC 20410-0500 Re:
January 11, 2018 VIA ELECTRONIC SUBMISSION Regulations Division Office of General Counsel U.S. Department of Housing and Urban Development Room 10276 451 Seventh Street SW Washington, DC 20410-0500 Re:
Milton Apartments OFFERING MEMORANDUM MILTON, WA OFFERING MEMORANDUM PRESENTED BY: KW COMMERCIAL 1100 Dexter Avenue North, Suite 275 Seattle, WA 98109
 OFFERING MEMORANDUM Milton Apartments MILTON, WA OFFERING MEMORANDUM KW COMMERCIAL 1100 Dexter Avenue North, Suite 275 Seattle, WA 98109 PRESENTED BY: CHARLES BURNETT Managing Broker 206.931.6036 charles@soundrealtygroup.com
Housing Affordability in Lexington, Kentucky
 University of Kentucky UKnowledge CBER Research Report Center for Business and Economic Research 6-29-2009 Housing Affordability in Lexington, Kentucky Christopher Jepsen University of Kentucky, chris.jepsen@uky.edu
Housing for the Region s Future
 Housing for the Region s Future Executive Summary North Texas is growing, by millions over the next 40 years. Where will they live? What will tomorrow s neighborhoods look like? How will they function
UPPERCLASS HOUSING
 2017-2018 UPPERCLASS HOUSING The advantages of RIT upperclass housing Great amenities Campus proximity Affordable value Apply for your RIT housing at myhousing.rit.edu beginning January 2, 2017 RIT transfer
BUDGET PRESENTATION. Penn State Housing and Food Services. Budget Proposal. Housing Capacities. Academic Year Occupancy Percentages
 2009-2010 BUDGET PRESENTATION Penn State Housing and Food Services Housing Capacities Academic Year Occupancy Percentages Comparison Room and Board Rates Academic Year 2008-2009 Budget Proposal 2009-2010
 ORANGE COAST COLLEGE APRIL 26, 2016 DEVELOPMENT SERVICES FOR STUDENT HOUSING AND JOINT OCCUPANCY LEASE MEETING AGENDA APRIL 26, 2015 College & District Introductions Vision for Student Housing Process
School Quality and Property Values. In Greenville, South Carolina
 Department of Agricultural and Applied Economics Working Paper WP 423 April 23 School Quality and Property Values In Greenville, South Carolina Kwame Owusu-Edusei and Molly Espey Clemson University Public
City of Exeter Housing Element
 D. Housing Stock Characteristics Government Code Section 65583(a) requires an analysis and documentation of household characteristics, including level of payment compared to ability to pay, housing characteristics,