INDUSTRIAL MARKET REPORT. San Antonio. 4th Quarter Q4 Market Trends 2016 by Xceligent, Inc. All Rights Reserved
|
|
|
- Franklin Peters
- 5 years ago
- Views:
Transcription

1 INDUSTRIAL MARKET REPORT San Antonio 4th Quarter 2015
2 Table of Contents/ Methodology of Tracked Set Xceligent is a leading provider of verified commercial real estate information which assists real estate professionals, appraisers, owners, investors and developers that make strategic decisions to lease, sell, buy and develop commercial properties. Table of Contents/Methodology of Tracked Set 2 Industrial Market Map 3 San Antonio Industrial Overview 4-5 Statistics by Market 6 Vacancy Rates & Asking Rates 7-8 Leasing & Absorption 9-10 New Construction 11 Industrial Advisory Board Members 12 Xceligent San Antonio Team 13 The San Antonio tracked set consists of an inventory of buildings considered to be competitive within the brokerage community. All buildings within the competitive tracked set have been reviewed and verified by members of the Advisory Boards for each market area. Tracked Inventory (Industrial) The total square feet of all single and multi-tenant buildings greater than 20,000 sf, excluding owner occupied facilities. Large manufacturing facilities, data centers, airplane hangar space, truck terminals/courts and obsolete/remediation properties are excluded. Available SF All of the available leasable space within a building, whether it is occupied or vacant, for direct lease or sublease space. Space can be available but not vacant, for example, if the landlord, or his agent, is marketing space that will be coming available at a future date because a tenant is planning to move. Vacant SF The total of the direct vacant square footage in a building that is being marketed. Net Absorption The net change in occupied square feet from quarter to quarter, expressed in square feet. Note This report reflects Direct Vacancy and Absorption, Sublease space is excluded. 2

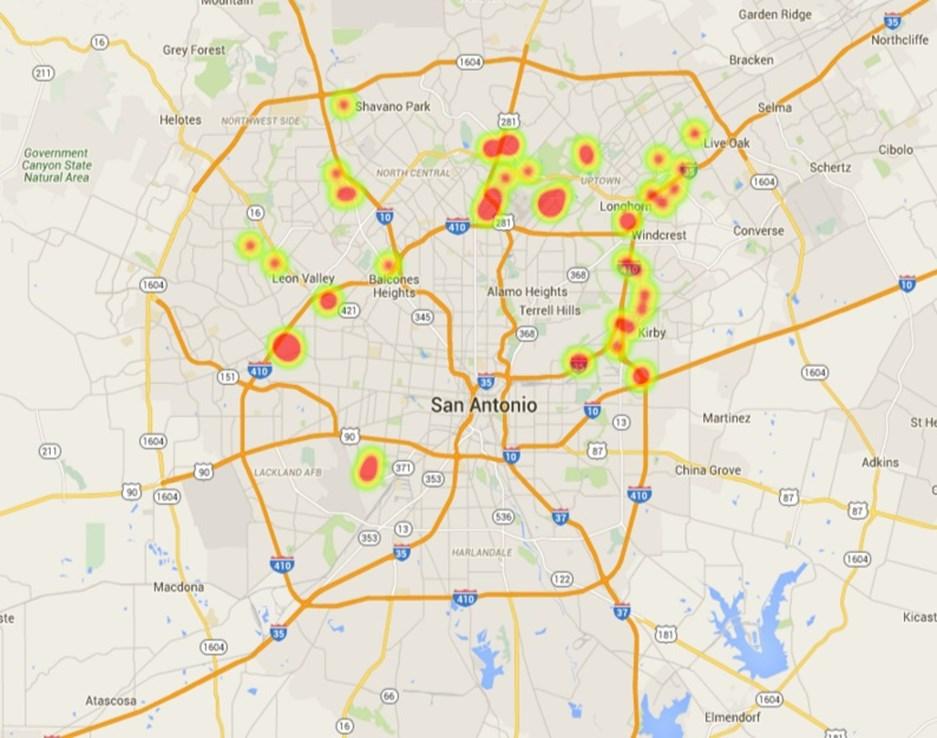
3 Industrial Market Map 3


4 San Antonio Industrial Overview Overview We continue to see strong growth in the San Antonio Industrial market, closing out the fourth quarter of 2015 with almost 230,000 square feet of positive absorption, and closing out the year with almost 1 million square feet of positive absorption. Fourth quarter vacancy dropped from 9.4%, at close of third quarter, to 8.3%, at close of The citywide average quoted triple net rental rate for all types of industrial space is up, at an average of $6.35, compared to third quarter 2015, at an average of $6.16. The majority of the positive absorption took place in the Warehouse category this quarter, with a large amount of inventory leased in the North East and South West market sectors. Historical Vacancy Rate & Direct Absorption 400, , , , , , ,000 50, , , Q Q Q Q Q4 12.0% 10.0% 8.0% 6.0% 4.0% 2.0% 0.0% 4
")
5 San Antonio Industrial Overview Historical Vacancy Rates by Use 15.0% 13.0% 11.0% 9.0% 7.0% 5.0% 3.0% 2014 Q Q Q Q Q4 Flex/R&D Warehouse - Distribution Historical Direct Absorption by Use 750, , , , , , ,000 50,000 (50,000) 2014 Q Q Q Q Q4 (150,000) Flex/R&D Warehouse - Distribution 5
6 Statistics by Market 6
7 Vacancy Rates & Asking Rates 7

 $16.00 $16.00 $14.00 $12.00 $12.50 $10.")
8 Vacancy Rates & Asking Rates Average Asking Rates by Market $15.00 $8.76 $8.70 $5.15 $5.04 $5.06 $5.00 $3.84 South West North East North Central North West Far North Central Far North East South East Far West $18.00 Asking Lease Rate Range by Class (NNN) $16.00 $16.00 $14.00 $12.00 $12.50 $10.00 $8.00 $6.00 $4.00 $2.00 $- Flex/R&D $9.60 $3.60 $5.43 $2.96 Warehouse - Distribution 8


9 Leasing & Absorption 9
10 Leasing & Absorption 10


11 New Construction Current New Construction by Market 600, , , , , , , ,000 40,000 - Far North East North East North Central 11
12 Industrial Advisory Board Members 12

13 Xceligent San Antonio Team This information has been obtained from sources believed reliable. While we do not doubt its accuracy, we have not verified it and make no guarantee, warranty or representation about it. It is your responsibility to independently confirm its accuracy. For more information, please contact : Elisabeth Niles Director of Analytics (830) eniles@xceligent.com Doug Swanson Director of Client Services (210) dswanson@xceligent.com 13
San Antonio 4th Quarter 2014 INDUSTRIAL. Market Trends COMMERCIAL REAL ESTATE INFORMATION
 San Antonio 4th Quarter 2014 INDUSTRIAL Market Trends COMMERCIAL REAL ESTATE INFORMATION Table of Contents/Methodology of Tracked Set Table of Contents/Methodology of Tracked Set 2 San Antonio Market Map
Sarasota-Manatee, FL 3rd Quarter 2015 INDUSTRIAL. Market Trends COMMERCIAL REAL ESTATE INFORMATION
 Sarasota-Manatee, FL 3rd Quarter 2015 INDUSTRIAL Market Trends COMMERCIAL REAL ESTATE INFORMATION Table of Contents/Methodology of Tracked Set Table of Contents/Methodology of Tracked Set Sarasota-Manatee
Boulder, CO 2nd Quarter 2015 INDUSTRIAL. Market Trends COMMERCIAL REAL ESTATE INFORMATION
 Boulder, CO 2nd Quarter 2015 INDUSTRIAL Market Trends COMMERCIAL REAL ESTATE INFORMATION Table of Contents/Methodology of Tracked Set Table of Contents/Methodology of Tracked Set 2 Boulder Industrial Market
INDUSTRIAL MARKET REPORT. San Antonio. 4th Quarter Q4 Market Trends 2017 by Xceligent, Inc. All Rights Reserved
 INDUSTRIAL MARKET REPORT San Antonio 4th Quarter 2016 Table of Contents/ Methodology of Tracked Set Xceligent is a leading provider of verified commercial real estate information which assists real estate
OFFICE MARKET REPORT. Northwest Arkansas. 3rd Quarter Q3 Market Trends 2016 by Xceligent, Inc. All Rights Reserved
 OFFICE MARKET REPORT Northwest Arkansas 3rd Quarter 2016 Table of Contents/ Methodology of Tracked Set Xceligent is a leading provider of verified commercial real estate information which assists real
Minneapolis-St. Paul
 INDUSTRIAL MARKET REPORT Minneapolis-St. Paul 4th Quarter 2015 Produced in partnership with Table of Contents/ Methodology of Tracked Set Xceligent is a leading provider of verified commercial real estate
RETAIL MARKET REPORT. Northwest Arkansas. 4th Quarter Q4 Market Trends 2017 by Xceligent, Inc. All Rights Reserved
 RETAIL MARKET REPORT Northwest Arkansas 4th Quarter 2016 Table of Contents/ Methodology of Tracked Set Xceligent is a leading provider of verified commercial real estate information which assists real
Boulder, CO 2nd Quarter 2015 OFFICE. Market Trends COMMERCIAL REAL ESTATE INFORMATION
 Boulder, CO 2nd Quarter 2015 OFFICE Market Trends COMMERCIAL REAL ESTATE INFORMATION Table of Contents/Methodology of Tracked Set Table of Contents/Methodology of Tracked Set 2 Boulder Office Market Map
Inland Empire 4th Quarter 2016
 INDUSTRIAL MARKET REPORT Inland Empire 4th Quarter 2016 Produced in partnership with Table of Contents/ Methodology of Tracked Set Xceligent is a leading provider of verified commercial real estate information
OFFICE MARKET REPORT. Orlando. 1st Quarter Q1 Market Trends 2016 by Xceligent, Inc. All Rights Reserved
 OFFICE MARKET REPORT Orlando 1st Quarter 2016 Table of Contents/ Methodology of Tracked Set Xceligent is a leading provider of verified commercial real estate information which assists real estate professionals,
REAL ESTATE INFORMATION
 Minneapolis, MN 4th Quarter 2014 OFFICE Market Trends COMMERCIAL REAL ESTATE INFORMATION Table of Contents/Methodology of Tracked Set Table of Contents/Methodology of Tracked Set 2 Minneapolis Office Market
INDUSTRIAL MARKET REPORT. Dallas-Fort Worth. 1st Quarter Q1 Market Trends 2016 by Xceligent, Inc. All Rights Reserved
 INDUSTRIAL MARKET REPORT Dallas-Fort Worth 1st Quarter 2016 Table of Contents/ Methodology of Tracked Set Xceligent is a leading provider of verified commercial real estate information which assists real
Miami-Dade County Office Market Report 1Q Real Capital Partners Real Estate Services
 -Dade County Office Report 1Q 216 Real Capital Partners Real Estate Services 1Q 216 -Dade County Office Report Overview -Dade County s Vacancy Increases to 1.4% Net Negative (11,64) SF in the Quarter The
INDUSTRIAL QUICK STATS SUMMARY & OUTLOOK MARKET TRENDS VACANCY & NET ABSORPTION ECONOMIC STATS
 ORANGE COUNTY INDUSTRIAL FOURTH QUARTER 217 QUICK STATS Direct Vacancy 2.3% Overall Vacancy 2.7% Lease Rate NNN $.91 Gross Absorption Under Construction MARKET TRENDS Current Quarter 4,283,991 SF 963,138
INDUSTRIAL QUICK STATS SUMMARY & OUTLOOK MARKET TRENDS VACANCY & NET ABSORPTION ECONOMIC STATS
 PHOENIX, ARIZONA INDUSTRIAL THIRD QUARTER 217 QUICK STATS Direct Vacancy 8.7% Overall Vacancy 9.% Lease Rate NNN $.54 Gross Absorption Under Construction MARKET TRENDS Current Quarter 5,991,128 SF 4,751,494
INDUSTRIAL QUICK STATS SUMMARY & OUTLOOK MARKET TRENDS VACANCY & NET ABSORPTION ECONOMIC STATS. Current Quarter. Direct Vacancy 2.
 LOS ANGELES NORTH INDUSTRIAL THIRD QUARTER 218 QUICK STATS Direct Vacancy 2.3% Overall Vacancy 2.6% Lease Rate NNN $1.1 Gross Absorption Under Construction MARKET TRENDS Current Quarter 1,632,564 SF 595,199
OFFICE QUICK STATS SUMMARY & OUTLOOK MARKET TRENDS VACANCY & NET ABSORPTION ECONOMIC STATS
 LOS ANGELES SAN GABRIEL VALLEY OFFICE SECOND QUARTER 218 QUICK STATS Direct Vacancy 11.1% Overall Vacancy 11.4% Lease Rate FSG $2.32 Gross Absorption Under Construction MARKET TRENDS Current Quarter 345,68
OFFICE QUICK STATS SUMMARY & OUTLOOK MARKET TRENDS VACANCY & NET ABSORPTION ECONOMIC STATS
 LOS ANGELES NORTH OFFICE FOURTH QUARTER 217 QUICK STATS Direct Vacancy 11.8% Overall Vacancy 12.5% Lease Rate FSG $2.75 Gross Absorption Under Construction MARKET TRENDS Current Quarter 1,6,941 SF 89,158
INDUSTRIAL QUICK STATS SUMMARY & OUTLOOK MARKET TRENDS VACANCY & NET ABSORPTION ECONOMIC STATS
 VENTURA COUNTY INDUSTRIAL FOURTH QUARTER 217 QUICK STATS Direct Vacancy 2.1% Overall Vacancy 2.4% Lease Rate NNN $.7 Gross Absorption Under Construction MARKET TRENDS Current Quarter 1,332,957 SF 774,362
4Q 16. Columbus Market Report. 605 S Front St Suite 200 Columbus OH
 4Q 16 Columbus Market Report 605 S Front St Suite 200 Columbus OH 43215 www.ohioequities.com 614 224 2400 Columbus Table of Contents 01 Office Market Report 02 Retail Market Report 03 Industrial Market
INDUSTRIAL QUICK STATS SUMMARY & OUTLOOK MARKET TRENDS VACANCY & NET ABSORPTION ECONOMIC STATS. Current Quarter. Direct Vacancy 2.
 ORANGE COUNTY INDUSTRIAL SECOND QUARTER 218 QUICK STATS Direct Vacancy 2.2% Overall Vacancy 2.5% Lease Rate NNN $.95 Gross Absorption Under Construction MARKET TRENDS Current Quarter 2,956,71 SF 1,367,18
MAR KET GLANCE SAN DIEGO OFFICE MARKET REPORT PROPERTY SERVICES DEVELOPMENT INVESTMENT FOURTH QUARTER 2015 PROPERTY SERVICES DEVELOPMENT INVESTMENT
 AT A SAN DIEGO OFFICE MARKET REPORT FOURTH QUARTER 215 AT A NEW SUPPLY PUSHES VACANCY RATES HIGHER San Diego s regional economy has been buzzing and added a net total of 37,8 jobs in the 12 months ending
MARKET WATCH SOUTHERN CALIFORNIA & PHOENIX
 SOUTHERN CALIFORNIA & PHOENIX COMMERCIAL REAL ESTATE MARKET FOURTH QUARTER 217 MARKET WATCH SOUTHERN CALIFORNIA & PHOENIX 1.888.659.DAUM WWW.DAUMCOMMERCIAL.COM D/AQ Corp. # 1129558 DAUM TABLE OF CONTENTS
OFFICE QUICK STATS SUMMARY & OUTLOOK MARKET TRENDS VACANCY & NET ABSORPTION ECONOMIC STATS
 INLAND EMPIRE OFFICE THIRD QUARTER 217 QUICK STATS Direct Vacancy 11.4% Overall Vacancy 11.7% Lease Rate FSG $1.83 Gross Absorption Under Construction MARKET TRENDS Current Quarter 529,634 SF 45,24 SF
INDUSTRIAL MARKET REPORT. Los Angeles. 3rd Quarter Produced in partnership with
 INDUSTRIAL MARKET REPORT Los Angeles 3rd Quarter 2016 Produced in partnership with Table of Contents/ Methodology of Tracked Set Xceligent is a leading provider of verified commercial real estate information
OFFICE QUICK STATS SUMMARY & OUTLOOK MARKET TRENDS VACANCY & NET ABSORPTION ECONOMIC STATS
 ORANGE COUNTY OFFICE THIRD QUARTER 217 QUICK STATS Direct Vacancy 12.1% Overall Vacancy 12.9% Lease Rate FSG $2.61 Gross Absorption Under Construction MARKET TRENDS Current Quarter 2,479,293 SF 379, SF
Third Quarter 2011 Tri-Valley Office Flex
 Third Quarter 011 Tri-Valley Office Flex PLEASANTON OFFICE 4305 Hacienda Drive, Suite 300 Pleasanton, CA 94588 Tel: 95.467.0900 Fax: 95.467.0911 www.ccareynkf.com TABLE OF CONTENTS Coverage Map 1 Market
OFFICE QUICK STATS SUMMARY & OUTLOOK MARKET TRENDS VACANCY & NET ABSORPTION ECONOMIC STATS
 LOS ANGELES CENTAL/SOUTHEAST OFFICE THIRD QUARTER 218 QUICK STATS Direct Vacancy 14.7% Overall Vacancy 15.2% Lease Rate FSG $3.16 Gross Absorption Under Construction MARKET TRENDS Change from Last Quarter
INDUSTRIAL QUICK STATS SUMMARY & OUTLOOK MARKET TRENDS VACANCY & NET ABSORPTION ECONOMIC STATS
 INLAND EMPIRE INDUSTRIAL FOURTH QUARTER 217 QUICK STATS Direct Vacancy 5.1% Overall Vacancy 5.3% Lease Rate NNN $.57 Gross Absorption Under Construction MARKET TRENDS Current Quarter 9,23,744 SF 16,31,563
Metro Milwaukee Industrial Market Report 2017 Q2
 RETAIL OFFICE INDUSTRIAL LAND INVESTMENT NAI MLG COMMERCIAL 414 347 9400 757 N BROADWAY, SUITE 700, MILWAUKEE, WI 53202 MLGCOMMERCIAL.COM Market intelligence is an essential component to NAI MLG Commercial
OFFICE QUICK STATS SUMMARY & OUTLOOK MARKET TRENDS VACANCY & NET ABSORPTION ECONOMIC STATS
 VENTURA COUNTY OFFICE THIRD QUARTER 217 QUICK STATS Direct Vacancy 13.9% Overall Vacancy 14.3% Lease Rate FSG $2.25 Gross Absorption Under Construction MARKET TRENDS Current Quarter 34,43 SF 18,112 SF
TAMI-sector resurgence drives improved quarterly leasing
 Midtown South Manhattan Office, Q3 217 TAMI-sector resurgence drives improved quarterly leasing Leasing Activity 1.14 MSF Net Absorption.9 MSF Availability Rate 1.8% Vacancy Rate 6.9% Average Asking Rent
MARKET SUMMARY MICHIGAN, METRO DETROIT AREA FOURTH QUARTER 2016 P LAN T E M OR AN CRES A. pmcresa.com
 FOURTH QUARTER 2016 MICHIGAN, METRO DETROIT AREA MARKET SUMMARY P LAN T E M OR AN CRES A 26300 NORTHWESTERN HIGHWAY SOUTHFIELD, MI 48076 248.223.3500 pmcresa.com Connect with us for more information: Subscribe
Los Angeles 2nd Quarter 2016
 INDUSTRIAL MARKET REPORT Los Angeles 2nd Quarter 2016 Produced in partnership with Table of Contents/ Methodology of Tracked Set Xceligent is a leading provider of verified commercial real estate information
3Q 17. Columbus Market Report. 605 S Front St Suite 200 Columbus OH
 3Q 17 Columbus Market Report 605 S Front St Suite 200 Columbus OH 43215 www.ohioequities.com 614 224 2400 Columbus Table of Contents 01 Office Market Report 02 Retail Market Report 03 Industrial Market
Miami-Dade County Office Market Report 4Q Real Capital Partners Real Estate Services. *Data Source CoStar Miami-Dade County Office Market Report
 Miami-Dade County Office Market Report 4Q 216 Real Capital Partners Real Estate Services *Data Source CoStar Miami-Dade County Office Market Report 4Q 216 Miami-Dade County Office Market Report Overview
Madison Market Recap 2017 Q3
 Madison Market Recap 2017 Q3 INDUSTRIAL OFFICE RETAIL NAI MLG COMMERCIAL 608 663 6000 4602 S BILTMORE LANE, SUITE 117, MADISON, WI 53718 MLGCOMMERCIAL.COM M A D I S O N, W I Market Recap 2017 Q3 Office
3 RD QUARTER 2015 RICHMOND INDUSTRIAL MARKET REPORT
 3 RD QUARTER FORECAST As the U.S. economy continued to show positive economic growth through the third quarter, the Richmond, VA Industrial market saw demand for warehouse and flex properties increase
Las Vegas Valley Executive Summary
 ARROYO MARKET SQUARE Las Vegas Valley Executive Summary Retail Market 4th Quarter 2013 THE DISTRICT AT GREEN VALLEY RANCH January 23, 2014 Re: Commercial Real Estate Survey: 4th Quarter, 2013 Dear Reader,
Callaghan Tower Vantage Dr, Suite 1200 San Antonio TX reocsanantonio.com R E O C
 Callaghan Tower 8023 Vantage, San Antonio, Texas 78230 Office for Lease Open Space Spec Suites Immediately Available R E O C 8023 Vantage Dr, Suite 1200 San Antonio TX 78230 reocsanantonio.com Table of
Los Angeles 4th Quarter 2016
 INDUSTRIAL MARKET REPORT Los Angeles 4th Quarter 2016 Produced in partnership with Table of Contents/ Methodology of Tracked Set Xceligent is a leading provider of verified commercial real estate information
Direct Vacant (SF) Vacancy Rate (%) Grand Total ,816,898 4,632,760 4,123, % 245,399 66,997 66,997
 Vacancy Rate (%) Grand Total ,816,898 4,632,760 4,123, % 245,399 66,997 66,997") 1st Quarter 213 $25 Market Highlights With the impending move of Pinnacle leaving the market next quarter, the Memphis Office market was able to start the year on a positive note, posting nearly 67, SF
1st Quarter 213 $25 Market Highlights With the impending move of Pinnacle leaving the market next quarter, the Memphis Office market was able to start the year on a positive note, posting nearly 67, SF
2Q 17. Columbus Market Report. 605 S Front St Suite 200 Columbus OH
 2Q 17 Columbus Market Report 605 S Front St Suite 200 Columbus OH 43215 www.ohioequities.com 614 224 2400 MARKET REPORT Columbus Table of Contents 01 Office Market Report 02 Retail Market Report 03 Industrial
Strong Industry and Robust Development Benefit Industrial Market at Mid-Year 2016
 Research & Forecast Report NASHVILLE INDUSTRIAL 2nd Quarter 2016 Strong Industry and Robust Development Benefit Industrial Market at Mid-Year 2016 2Q 2016 Summary > > The tightening market coupled with
Market Report Q ///////// Orange County Industrial. ///////////////L o s A n g e l e s /////////////
 ///////////////L o s A n g e l e s ///////////// ///////////O r a n g e C o u n t y /////////// ////////////V e n t u r a ///////////////// ////////// I n l a n d E m p i r e //////////// Market Report
28575Livingston 40,000 SF MODERN INDUSTRIAL BUILDING FOR LEASE OR SALE livingston avenue Valencia, CA 91355
 28575Livingston 40,000 SF MODERN INDUSTRIAL BUILDING FOR LEASE OR SALE /craig.peters 2017, Inc. The information contained in this document has been obtained from sources believed reliable. While, Inc.
Solid Fundamentals Keep Nashville Industrial Market Competitive in 1Q
 Research & Forecast Report NASHVILLE INDUSTRIAL 1st Quarter Solid Fundamentals Keep Nashville Industrial Market Competitive in 1Q 1Q Summary >> Nashville s industrial vacancy rate increased slightly in
Miami-Dade County Retail Market Report 3Q Real Capital Partners Real Estate Services. *Data Source CoStar Miami-Dade County Retail Market Report
 Miami-Dade County Retail Market Report 3Q 216 Real Capital Partners Real Estate Services *Data Source CoStar Miami-Dade County Retail Market Report 3Q 216 Miami-Dade County Retail Market Report Overview
Market Report Q ///////// Los Angeles Industrial. ///////////////L o s A n g e l e s /////////////
 ///////////////L o s A n g e l e s ///////////// ///////////O r a n g e C o u n t y /////////// ////////////V e n t u r a ///////////////// ////////// I n l a n d E m p i r e //////////// Market Report
>> Greater Los Angeles Retail Ends 2016 With Mixed Results
 Research & Forecast Report GREATER LOS ANGELES RETAIL Q4 2016 Accelerating success. >> Greater Los Angeles Retail Ends 2016 With Mixed Results Greater Los Angeles Retail Market The Los Angeles Basin retail
CoStar Industrial Statistics. Y e a r - E n d Brownsville/Harlingen Industrial Market
 CoStar Industrial Statistics Y e a r - E n d 2 0 1 7 Brownsville/Harlingen Industrial Market Brownsville/Harlingen Industrial Market Year-End 2017 Brownsville/Harlingen Table of Contents Table of Contents.................................................................
Nashville the #5 Market to Watch in 2019
 Research & Forecast Report NASHVILLE INDUSTRIAL 4 th Quarter Nashville the #5 Market to Watch in 2019 Industrial Market The industrial real estate sector is currently undergoing one of the greatest expansionary
>> Asking Rents Increase As Space Remains Limited
 Research & Forecast Report MID-COUNTIES INDUSTRIAL Accelerating success. >> Asking Rents Increase As Space Remains Limited Key Takeaways > Average asking rents increased $0.02 Per Square Foot (P) Triple
Offering Memorandum. Prepared by: 2425 S. Stoughton Road, Madison, WI
 Offering Memorandum 2425 S. Stoughton Road, Madison, WI Prepared by: Craig P. Stanley, CCIM Broadwing Advisors, LLC (608) 294-4099 craig@broadwing-advisors.com 2631 University Avenue, Suite 106 Madison,
Office Market Continues to Improve
 Research & Forecast Report LAS VEGAS OFFICE Q3 2016 Office Market Continues to Improve > > Southern Nevada s office market is improving at a steady rate > > Net absorption has been positive in twelve of
CHICAGO CBD OFFICE INVESTMENT PROPERTIES GROUP
 CHICAGO CBD OFFICE INVESTMENT PROPERTIES GROUP SECOND QUARTER NEWSLETTER 216 HOT TOPICS Capital markets remain a focus with 14 assets either under contract or sold totaling $2.6 billion, which includes
Market Report Q ///////// Los Angeles Industrial. ///////////////L o s A n g e l e s /////////////
 ///////////////L o s A n g e l e s ///////////// ///////////O r a n g e C o u n t y /////////// ////////////V e n t u r a ///////////////// ////////// I n l a n d E m p i r e //////////// Market Report
R&D Report. Bay Area Fourth Quarter 2015
 R&D Report Bay Area Fourth Quarter 2015 R&D Market Summary Area Building Available Space Rate Base Direct Sublease Total Q4-2015 Q4-2014 Average Asking Rate (NNN) San Mateo County 20,134,624 436,234 200,279
The Upstate, South Carolina
 The Upstate, South Carolina Vacancy Down and Absorption Up The first quarter of 2018 ended on a rather remarkable note, posting the largest decrease in industrial vacancy in the last eight quarters. This
3 RD QUARTER 2016 RICHMOND INDUSTRIAL MARKET REPORT
 3 RD QUARTER 2016 RICHMOND INDUSTRIAL MARKET REPORT FORECAST The Richmond Industrial market continued trending in the positive direction in the third quarter, with the absorption of over 320,000 square
REAL ESTATE INFORMATION
 Minneapolis/St. Paul, MN 3rd Quarter 2015 INDUSTRIAL Market Trends COMMERCIAL REAL ESTATE INFORMATION Table of Contents/Methodology of Tracked Set Table of Contents/Methodology of Tracked Set 2 Minneapolis/St
>> Rents Rise To Highest Point Ever
 Research & Forecast Report SAN FERNANDO VALLEY & VENTURA COUNTY INDUSTRIAL Accelerating success. >> Rents Rise To Highest Point Ever Key Takeaways > Asking rental rates rose $.2 P NNN to $.69 P NNN. Rents
Another solid quarter for the industrial market as its reputation grows
 MARKETVIEW Boston Industrial, Q1 2017 Another solid quarter for the industrial market as its reputation grows Vacancy 7.7% Availability 10.7% Occupied Sq. Ft. 148.5 MSF Under Construction 300K SF * Arrows
PRIME COMMERCIAL BUILDING INVESTMENT/DEVELOPMENT OPPORTUNITY OR OWNER USER VAN NESS CORRIDOR
 PRIME COMMERCIAL BUILDING The information contained herein has been obtained from sources we deem reliable but is not guaranteed. Prospective purchasers are advised to independently verify accuracy and
The CoStar Office Report
 The CoStar Office Report T H I R D Q U A R T E R 2 0 1 2 THIRD QUARTER 2012 PHOENIX Table of Contents Table of Contents.................................................................... A Methodology........................................................................
Sublease Occupied 11.33% Available Sublease Vacant 5.57% Available Occupied Direct 18.86% Availability Rate Breakdown Silicon Valley - All Products
 SILICON VALLEY All Product - First Quarter 2007 Total Current and Vacant Occupied Current Vacancy Availability Under Pending Date Direct Direct Sublease Rate Rate Construction Availability 1Q 2007 27,417,305
Quarterly Market Report
 OCTOBER EXECUTIVE SUMMARY San Antonio office market hits record high for rents Full-service asking rents rose by $.11 per sq. ft. quarter-over-quarter to close at $22. an all-time high with an increase
Industrial Market Report
 Industrial Market Report West Michigan Q4 - Year End 017 Wisinski of West Michigan Commercial Real Estate Services, Worldwide. 100 Grandville Ave SW Suite 100 Grand Rapids, MI 49503 616. 776. 0100 www.naiwwm.com
The CoStar Office Report. T h i r d Q u a r t e r Greensboro/Winston-Salem Office Market
 The CoStar Office Report T h i r d Q u a r t e r 2 0 1 4 Greensboro/Winston-Salem Office Market Third Quarter 2014 Greensboro/Winston-Salem Table of Contents Table of Contents.................................................................
Los Angeles Basin Retail Market Continues To Witness Decreasing Vacancy Rates
 RETAIL GREATER LOS ANGELES BASIN MARKET REPORT Continues To Witness Decreasing Vacancy Rates MARKET INDICATORS - VACANCY 6.0% NET ABSORPTION 1,605,200 CONSTRUCTION 2,111,970 RENTAL RATE $2.03 P NNN UNEMPLOYMENT
The CoStar Industrial Report
 The CoStar Industrial Report M I D - Y E A R 2 0 1 0 Houston Industrial Market Houston Industrial Market MID-YEAR 2010 HOUSTON Table of Contents Table of Contents....................................................................
Greater Boston Industrial Finishes 2015 with a Bang
 MARKETVIEW Boston Suburban Industrial, Q4 2015 Greater Boston Industrial Finishes 2015 with a Bang Vacancy 9.8% Availability 13.4% Occupied Sq. Ft. 128.7 MSF Sublease 0.9 MSF Figure 1: Industrial Vacancy
Offering memorandum. El Cajon
 Offering memorandum El Cajon 1083 N o r t h C u y a m a c a s t r e e t 1083 north Cuyamaca street el Cajon, CA 92020 Offering Memorandum I. Executive summary The Overview & Valuation Summary...1 II. The
>> Greater Los Angeles Retail Starts 2017 At A Slow Pace
 Research & Forecast Report GREATER LOS ANGELES RETAIL Q1 2017 Accelerating success. >> Greater Los Angeles Retail Starts 2017 At A Slow Pace Greater Los Angeles Retail Market The Los Angeles Basin retail
MARKETBEAT Columbus. Office Q1 2018
 COLUMBUS OFFICE Economic Indicators Q1 17 Q1 18 Unemployment 4.1% 3.8% Ohio Unemployment 5.1% 4.6% U.S. Unemployment 4.7% 4.1% Market Indicators (Overall, All Classes) Q1 17 Q1 18 Overall Vacancy 12.2%
Los Angeles Basin Retail Market Continues To Witness Decreasing Vacancy Rates
 RETAIL GREATER LOS ANGELES BASIN MARKET REPORT Continues To Witness Decreasing Vacancy Rates MARKET INDICATORS - VACANCY 6. NET ABSORPTION 588,800 CONSTRUCTION 3,312,470 RENTAL RATE $2.04 P NNN UNEMPLOYMENT
Metropolitan Milwaukee Office Market Report Third Quarter 2015
 Metropolitan Milwaukee Office Market Report Third Quarter 2015 RETAIL OFFICE INDUSTRIAL LAND INVESTMENT NAI MLG COMMERCIAL 414 347 9400 757 N BROADWAY, SUITE 700, MILWAUKEE, WI 53202 MLGCOMMERCIAL.COM
2.8% 2.0% $811M. 2017: A Solid Year for the Metro Denver Office Sector HIGHLIGHTED METRO DENVER OFFICE. Market Report Q ECONOMIC TRENDS
 Market Report METRO DENVER OFFICE Q4 2017 2017: A Solid Year for the Metro Denver Office Sector MARKET OVERVIEW Denver s office market finished 2017 with strong positive absorption during the fourth quarter
Upstate, SC 2Q17. Industrial Market Report. Q2 Industrial. Upstate Economy in 2Q17* Industrial Sector in 2Q17. Trends for 2Q17
 Upstate, SC 2Q17 Industrial Market Report The industrial market for the Upstate of South Carolina saw continued growth for the second quarter of 217. While there was a positive net absorption of 67,53
CoStar Industrial Statistics. Y e a r - E n d McAllen/Edinburg/Pharr Industrial Market
 CoStar Industrial Statistics Y e a r - E n d 2 0 1 7 McAllen/Edinburg/Pharr Industrial Market Year-End 2017 McAllen/Edinburg/Pharr Table of Contents Table of Contents.................................................................
Bakersfield 4Q18 Office Market Trends
 Bakersfield the higher cost of leasing in the submarket is unlikely to hinder demand as CRC s lease expirations create more available inventory within the University Centre Submarket. Mark J. Smith, SIOR
HISTORICAL VACANCY VS RENTS $1.75 2Q10 2Q11 2Q12 2Q13 2Q14
 www.colliers.com/greaterlosangeles RETAIL GREATER LOS ANGELES BASIN MARKET REPORT Vacancy Decreases and Net Absorption Increases From Previous Quarter MARKET INDICATORS - VACANCY 6. NET ABSORPTION 732,000
Economic growth driving tighter market conditions
 Metro Philadelphia Industrial, 217 Economic growth driving tighter market conditions Net Absorption 1.8 Million sq. ft. Vacancy Rate 5.4% Asking Lease Rate (NNN) $4.35 Development 2.2 Million sq. ft. Figure
>> Greater Los Angeles Retail Continues to Witness Declining Vacancy
 Research & Forecast Report GREATER LOS ANGELES RETAIL Accelerating success. >> Greater Los Angeles Retail Continues to Witness Declining Vacancy Greater Los Angeles Retail Market The Los Angeles Basin
San Fernando Valley & Ventura County Industrial Market $0.48 1Q11 1Q12 1Q13 1Q14 1Q15
 industrial SAN FERNANDO VALLEY & VENTURA COUNTY market report Rents Continue To Rise As Vacancy Rate Continues To Decrease Market overview MARKET indicators - VACANCY 2.9% AVAILABILITY 5.2% NET ABSORPTION
3 RD QUARTER 2015 RICHMOND RETAIL MARKET REPORT FORECAST 5.7% VACANCY 509,220 SF UNDER CONSTRUCTION 370,165 SF NET ABSORPTION
 3 RD QUARTER 2015 RICHMOND RETAIL MARKET REPORT FORECAST As 2015 winds down, the vacancy rates are approaching an all time low. Retail inventory is down causing an increase in construction with national
The Improvement of the Industrial Market
 Research & Forecast Report Long Island industrial MARKET Q2 2015 The Improvement of the Industrial Market Rose Liu Research & Financial Analyst Long Island Takeaways The overall economy on Long Island
Picked Over. ALBUQUERQUE, NM Q Industrial. Research & Forecast Report. Key Takeaways. Market Indicators Relative to prior period
 Research & Forecast Report ALBUQUERQUE, NM Q4 20 Industrial Picked Over Key Takeaways > > Owner user acquisitions strong > > Supply tightens > > New construction projects gaining more momentum The appetite
Market Report Q ///////// Inland Empire Industrial. ///////////////L o s A n g e l e s /////////////
 ///////////////L o s A n g e l e s ///////////// ///////////O r a n g e C o u n t y /////////// ////////////V e n t u r a ///////////////// ////////// I n l a n d E m p i r e //////////// Market Report
Hudson at University. Class A Office Space For Lease. Property Highlights University Drive East, Suite 210 Bryan, Texas 77802
 Hudson at University Class A Office Space For Lease Property Highlights Monument and building fascia signage available High end finishes with restrooms, break room, conference room and seven offices Available
101 E Washington Street, Ste 400 Greenville, SC Q 18. Market Report
 101 E Washington Street, Ste 400 Greenville, SC 29601 2Q 18 Market Report GREENVILLE/SPARTANBURG 2Q18 OFFICE REPORT * MARKET SUMMARY The Greenville Spartanburg Office market remained fairly steady at the
FOR SALE Former Bank Branch-8615 Collier Blvd.
 FOR SALE Former Bank Branch-8615 Collier Blvd. NAPLES, FLORIDA 34114 PRESENTED BY Paul Rutledge First Vice President +1 813 273 8471 +1 941 228 2198 cell paul.rutledge@cbre.com Kelsey Cansler Sales Associate
Industrial Outlook. An in-depth look at the Louisville industrial market. Analysis includes leasing, sales, construction and employment.
 Industrial Outlook Louisville An in-depth look at the Louisville industrial market. Analysis includes leasing, sales, construction and employment. JLL Research Insight Industrial market quick out of the
Overall Industrial Market Off to Solid First Quarter; Flex Market Rebounding
 Research & Forecast Report RALEIGH-DURHAM INDUSTRIAL Overall Industrial Market Off to Solid First Quarter; Flex Market Rebounding Emily Bostic Research Analyst Raleigh-Durham Key Takeaways > > The Triangle
Vacancy Net Absorption Construction Rental Rate. Vacancy Rate 1.7% Change from Q3 17 (Basis Points) -20 BPS. Construction Completions
 -20 BPS. Construction Completions") Forecast Vacancy Net Absorption Construction Rental Rate Vacancy Rate 1.7% Change from Q3 17 (Basis Points) -2 BPS Net Absorption 394,4 Construction Completions 191,7 Average Asking Rent Change from Q3
Forecast Vacancy Net Absorption Construction Rental Rate Vacancy Rate 1.7% Change from Q3 17 (Basis Points) -2 BPS Net Absorption 394,4 Construction Completions 191,7 Average Asking Rent Change from Q3
17th Annual Real Estate Review & Forecast
 2017 17th Annual Real Estate Review & Forecast This Year s Sponsors Member FDIC Construction: Review & Forecast 2017 Page 2 Permits Issued 142 New Commercial Construction Permits issued for all Elkhart
Market Research. Market Indicators
 colliers international LAS VEGAS, NV Market Research OFFICE Second Quarter 2009 Market Indicators Net Absorption Construction Rental Rate Q2-09 Q3-2009 Projected Clark County Economic Data UNEMPLOYMENT
The CoStar Office Report
 The CoStar Office Report Y E A R - E N D 2 0 0 8 YEAR-END 2008 PHOENIX Table of Contents Table of Contents.................................................................... A Methodology........................................................................
2Q 16. Long Island Market Report
 2Q 16 Long Island Market Report Long Island Office 2Q 216 Long Island 2Q16 Office Office Report The Long Island Office market ended the second quarter 216 with a vacancy rate of 7.5%. The vacancy rate
The CoStar Retail Report
 The CoStar Retail Report M I D - Y E A R 2 0 0 9 Southwest Florida Retail Market Southwest Florida Retail Market MID-YEAR 2009 SOUTHWEST FLORIDA Table of Contents Table of Contents....................................................................