PARK WEST RELOCATION OPTIONS
|
|
|
- Myron Lester
- 6 years ago
- Views:
Transcription
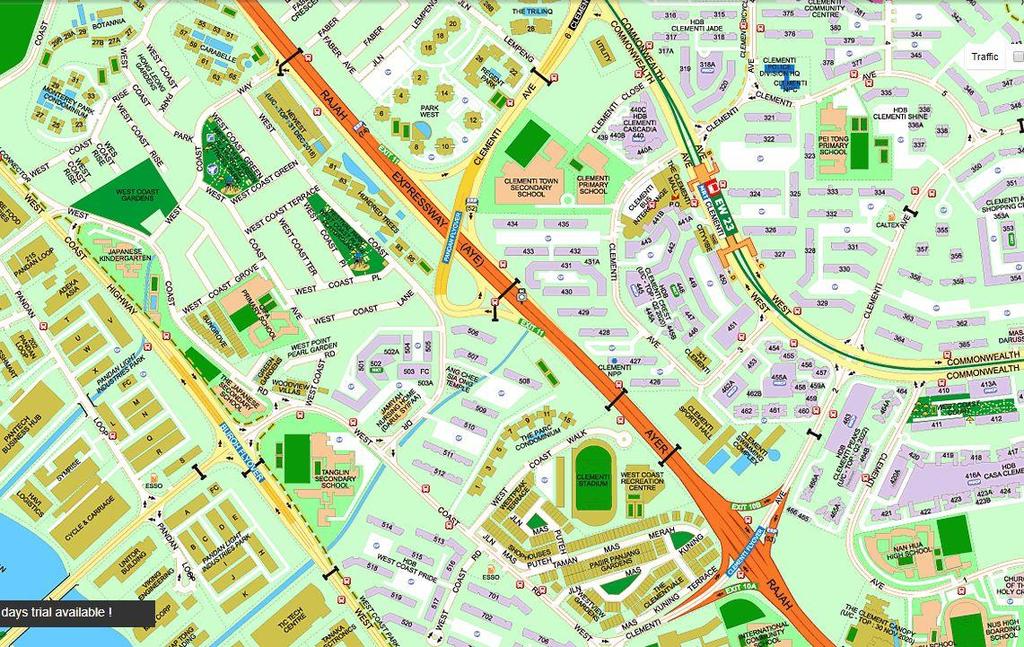
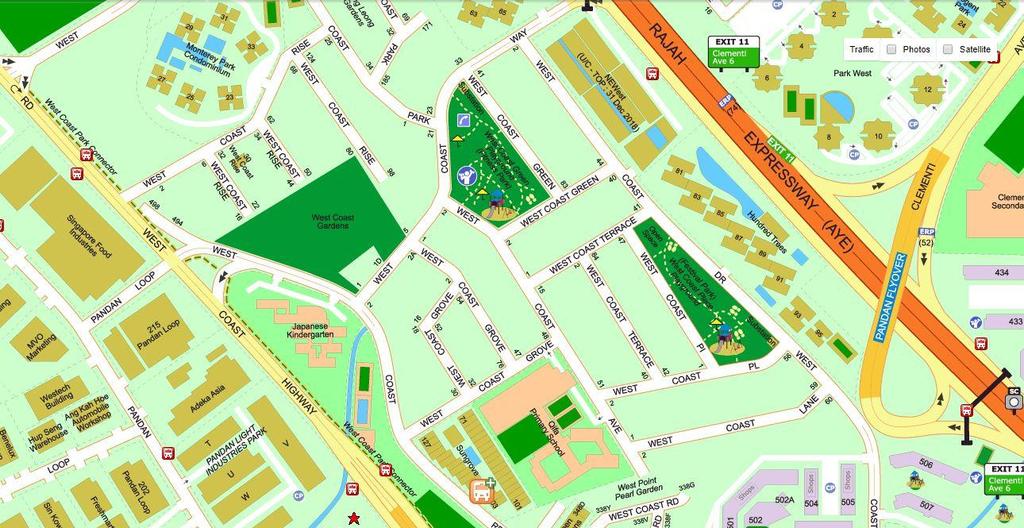
1 PARK WEST RELOCATION OPTIONS

2 Planning the next step Estimated Timeline to Receive Sale Proceeds Buyers Checklist What are our Relocation Options? How long it takes for relocation? Who can help us with the relocation?
 File objection, if any If no objection To receive the Sale Proceeds less 5% retention sum;")

3 Scenario 1 No Objections ESTIMATED TIMELINE STB Application Deadline to file objection Sale Order Legal Completion Delivery of Possession 14/2/2018 7/3/ /3/ /6/ /12/2018 To file an application with Strata Titles Board (STB) File objection, if any If no objection To receive the Sale Proceeds less 5% retention sum; or 100% of the Gross Sale Proceeds if vacant possession is delivered upon Legal Completion To receive the balance 5% of the Gross Sale Proceeds upon handover 21 days 7 days 3 months 6 months STB Application Legal Completion Vacant Possession Liquidated $5,000 per day per strata lot for delay in delivery of possession, if any
4 Scenario 2 Objections Filed at STB ESTIMATED TIMELINE STB Application Deadline to file objection STB 1 st Hearing STB 2 nd Hearing Sale Order Legal Completion Delivery of Possession 14/2/2018 7/3/2018 2/5/2018 6/6/ /6/ /9/ /3/2019 To file an application with Strata Titles Board (STB) File objection, if any Objection filed To receive the Sale Proceeds less 5% retention sum; or 100% of the Gross Sale Proceeds if vacant possession is delivered upon Legal Completion To receive the balance 5% of the Gross Sale Proceeds upon handover 21 days 8 weeks 5 weeks 2 weeks 3 months 6 months STB Application Legal Completion Vacant Possession Liquidated $5,000 per day per strata lot for delay in delivery of possession, if any

5 Buyers Checklist 1. Budget Purchase Price Renovation Buyer s Stamp Duty, ABSD Other Costs like Legal Fees for Conveyancing, Agent Fees (for HDB Resale Flat), etc Mortgage Loan 2. Type of Housing Private Condominium, HDB Resale Flat, Landed Property

6 Buyers Checklist 3. Location Proximity to schools or work place Proximity to amenities like supermarkets, hawker centres, parks, etc Proximity to public transport like MRT station, bus stops Easy access to expressways Other must have 4. Property Tenure Freehold, 99-year leasehold Size and number of bedrooms Age of property new (< 10 years old), older properties (> 10 years old) Facilities eg. Swimming pool, gym, tennis court, etc Layout eg. big living room, enclosed kitchen, balcony, view, etc Others eg. Handicapped friendly, sufficient carparking


7 Relocation Options Private Condo Landed Property HDB Resale Flat Move in with Family Members
8 PRIVATE CONDOMINIUM
9 Project Name Address Tenure TOP Year Age of Condo No of Bedrooms Size(sqft) Asking / Starting from / Guide Price PSF D5 - BUONA VISTA / WEST COAST / CLEMENTI (PTE CONDOMINIUM) The Clement Canopy Clementi Ave 1 99-yr Br (last 3 units) 657 $1,123,000 $1,709 3 Br 990 $1,396,000 $1,410 3Br + G 1,109 $1,566,000 $1,412 4 Br 1,346 $1,923,000 $1,429 The Trilinq 28 Jalan Lempang 99-yr Br 538 $896,000 $1,665 2 Br 1,109 $1,368,000 $1,234 3 Br 1,346 $1,555,000 $1,155 4 Br 1,518 $1,722,000 $1,134 The Vision West Coast Crescent 99-yr Br 818 $1,100,000 $1,345 2 Br 904 $1,149,000 $1,271 3 Br 1,302 $1,500,000 $1,152 3 Br 1,313 $1,800,000 $1,371 4 Br 1,604 $1,850,000 $1,153 Hundred Trees West Coast Drive 999-yr Br 485 $760,000 $1,567 2 Br 915 $1,180,000 $1,290 3 Br 1,163 $1,500,000 $1,290 4 Br 1,475 $2,000,000 $1,356 The Parc Condominium 1-15 West Coast Walk Freehold Br 980 $1,380,000 $1,408 3 Br 1,216 $1,620,000 $1,332 3 Br 1,292 $1,748,000 $1,353 4 Br 1,421 $1,989,400 $1,400 ClementiWoods Condominium West Coast Road 99-yr Br 560 $800,000 $1,429 4 Br 1,625 $1,750,000 $1,077 Blue Horizon West Coast Crescent 99-yr Br 926 $950,000 $1,026 2 Br 958 $1,020,000 $1,065 3 Br 1,151 $1,250,000 $1,086 * Listings as of 23 January 2018
10

11
12 LANDED PROPERTY
13 Project Address Tenure TOP Year Age of Property Type No of Bedrooms Land Size (sqft) Built-Up Size(sqft) Asking Price Land Price PSF D5 - BUONA VISTA / WEST COAST / CLEMENTI (LANDED) NEWest 1 West Coast Drive 999-yr Cluster House 4 2,519 $2,280,000 $905 Westside 33 33B West Coast Road Freehold Cluster House 4 2,509 $2,198,000 $876 The Clementvale Mas Kuning Terrace 99-yr Inter-Terrace 5 2,046 2,450 $1,950,000 $953 Corner-Terrace 5 2,619 3,213 $2,350,000 $897 Sungrove West Coast Grove 99-yr Semi-Detached (Cluster) 5 5,200 7,100 $2,900,000 $408 Pasir Panjang Gardens Taman Mas Merah Freehold Terrace 3 1,671 2,482 $3,000,000 $1,209 Corner-Terrace 4 3,000 2,480 $2,800,000 $933 West Coast Lane 999-yr Corner-Terrace (Renovated) 3 2,400 2,890 $3,500,000 $1,211 * Listings as of 23 January 2018

14
15
16 HDB RESALE FLAT
17 Clementi Executive Flat Last 30 Transactions for HDB Clementi 5-Room Flat No Address Property Type Size Transacted Price PSF Contract Date Clementi Ave 6 Level 10 to 12 HDB Exec 150 sqm $820K $508 Jan Clementi Street 13 #02-XX HDB Exec 147 sqm $870K $550 Dec Clementi West Street 2 #10-XX HDB Exec 150 sqm $795K $492 Nov Clementi Avenue 6 #04-XX HDB Exec 150 sqm $825K $511 Nov Clementi Street 13 #10-XX HDB Exec 149 sqm $888K $554 Sep Clementi St 13 Level 10 to 12 HDB Exec 147 sqm $850K $537 Sep Clementi Avenue 6 #02-XX HDB Exec 144 sqm $755K $487 Sep Clementi Avenue 6 #14-XX HDB Exec 147 sqm $870K $550 Sep Clementi Street 13 #12-XX HDB Exec 147 sqm $830K $525 Aug Clementi Avenue 6 #10-XX HDB Exec 150 sqm $770K $477 Aug Clementi Avenue 6 #03-XX HDB Exec 149 sqm $772K $481 Aug Clementi Street 13 #12-28 HDB Exec 147 sqm $888K $561 Jul Clementi Street 13 #10-88 HDB Exec 151 sqm $827K $509 Apr Clementi Street 13 #02-64 HDB Exec 149 sqm $770K $480 Mar Clementi St 13 Level 10 to 12 HDB Exec 161 sqm $930K $537 Mar Clementi Street 13 #12-62 HDB Exec 149 sqm $885K $552 Dec Clementi Avenue 6 #01-41 HDB Exec 154 sqm $750K $452 Oct Clementi Street 13 #04-82 HDB Exec 147 sqm $865K $547 Oct Clementi Avenue 3 # HDB Exec 162 sqm $960K $550 Sep Clementi Street 13 #12-48 HDB Exec 163 sqm $908K $517 Sep Clementi Street 13 #10-56 HDB Exec 149 sqm $880K $549 Aug Clementi St 13 Level 10 to 12 HDB Exec 146 sqm $880K $560 Aug Clementi Avenue 2 # HDB JB 163 sqm $790K $450 Jul Clementi West Street 2 # HDB Exec 160 sqm $760K $441 Jun Clementi Avenue 6 #01-13 HDB Exec 154 sqm $700K $422 May Clementi Street 13 #08-66 HDB Exec 147 sqm $910K $575 May Clementi Avenue 6 #10-33 HDB Exec 150 sqm $838K $519 May Clementi Ave 6 Level 1 to 3 HDB Exec 155 sqm $769K $462 May Clementi Avenue 6 #03-27 HDB Exec 148 sqm $705K $443 Apr Clementi Ave 6 Level 7 to 9 HDB Exec 154 sqm $840K $507 Mar-16 No Address Property Type Size Transacted Price PSF Contract Date Clementi West St 1 Level 1 to 3 HDB 5 Rm 119 sqm $522K $407 Jan Commonwealth Avenue West #07-XX HDB 5 Rm 125 sqm $585K $ Dec Clementi Avenue 2 #10-XX HDB 5 Rm 119 sqm $700K $546 Dec A Clementi Avenue 3 #21-XX HDB 5 Rm 119 sqm $870K $679 Dec Clementi Ave 3 Level 13 to 15 HDB 5 Rm 110 sqm $770K $650 Nov Clementi Avenue 2 #04-XX HDB 5 Rm 119 sqm $650K $507 Nov Clementi Avenue 2 #10-XX HDB 5 Rm 117 sqm $650K $516 Nov Clementi Ave 1 Level 7 to 9 HDB 5 Rm 117 sqm $800K $635 Oct Clementi Avenue 1 #18-XX HDB 5 Rm 113 sqm $810K $666 Oct Clementi West Street 1 #14-XX HDB 5 Rm 119 sqm $578K $451 Oct Clementi Street 14 #09-XX HDB 5 Rm 126 sqm $738K $544 Oct Clementi Avenue 1 #29-XX HDB 5 Rm 118 sqm $898K $707 Sep Clementi Avenue 3 #08-XX HDB 5 Rm 110 sqm $740K $625 Sep Clementi Avenue 2 #03-XX HDB 5 Rm 119 sqm $618K $482 Aug Clementi Avenue 3 #06-XX HDB 5 Rm 110 sqm $718K $606 Aug Clementi West Street 1 #07-48 HDB 5 Rm 119 sqm $545K $425 Jul Clementi Street 14 # HDB 5 Rm 121 sqm $677K $520 Jun Clementi Avenue 1 # HDB 5 Rm 113 sqm $835K $687 Jun Clementi Avenue 2 #24-42 HDB 5 Rm 119 sqm $738K $576 May Clementi Avenue 2 #06-44 HDB 5 Rm 119 sqm $675K $527 May Clementi Avenue 1 # HDB 5 Rm 113 sqm $803K $660 May Clementi Avenue 6 #05-11 HDB 5 Rm 127 sqm $670K $490 May Clementi Avenue 1 # HDB 5 Rm 117 sqm $888K $705 May Clementi Avenue 3 # HDB 5 Rm 110 sqm $815K $688 May Clementi Avenue 2 #25-48 HDB 5 Rm 119 sqm $755K $589 Apr Clementi Ave 3 Level 22 to 24 HDB 5 Rm 110 sqm $783K $661 Apr A Clementi Avenue 3 #39-07 HDB 5 Rm 119 sqm $1 040K $812 Apr A Clementi Ave 3 Level 34 to 36 HDB 5 Rm 119 sqm $1 020K $796 Apr Clementi Avenue 3 # HDB 5 Rm 110 sqm $680K $574 Mar Clementi Ave 2 Level 16 to 18 HDB 5 Rm 119 sqm $718K $560 Mar-17
18 Jurong East Executive Flat Last 30 Transactions for HDB Jurong East 5-Room Flat No Address Property Type Size Transacted Price PSF Contract Date 1 287D Jurong East Street 21 #12-XX HDB Exec 145 sqm $860K $551 Jan Jurong East Avenue 1 #12-XX HDB Exec 149 sqm $555K $346 Dec C Toh Guan Rd Level 13 to 15 HDB Exec 143 sqm $780K $507 Dec Jurong East Street 21 #04-XX HDB Exec 148 sqm $600K $377 Dec C Jurong East Street 21 #12-XX HDB Exec 144 sqm $860K $ Nov Jurong East Avenue 1 #03-XX HDB Exec 147 sqm $540K $341 Nov D Toh Guan Road #17-XX HDB Exec 140 sqm $794K $527 Nov Teban Gardens Road #10-XX HDB Exec 146 sqm $600K $382 Nov A Toh Guan Road #21-XX HDB Exec 140 sqm $788K $523 Nov D Toh Guan Road #18-XX HDB Exec 140 sqm $810K $537 Oct Jurong East Avenue 1 #04-XX HDB Exec 149 sqm $601K $375 Oct Jurong East Avenue 1 #08-XX HDB Exec 147 sqm $540K $341 Sep C Jurong East Street 21 #08-XX HDB Exec 144 sqm $722K $466 Sep Jurong East St 31 Level 4 to 6 HDB Exec 149 sqm $697K $435 Aug C Jurong East Street 21 #09-XX HDB Exec 144 sqm $806K $520 Aug Jurong East Street 31 #06-XX HDB Exec 149 sqm $688K $429 Aug B Jurong East Street 21 #15-XX HDB Exec 144 sqm $760K $490 Aug C Jurong East Street 21 # HDB Exec 140 sqm $770K $511 Jul C Toh Guan Road #12-80 HDB Exec 145 sqm $792K $507 Jul A Jurong East Street 31 # HDB Exec 149 sqm $630K $393 Jun A Jurong East St 21 Level 1 to 3 HDB Exec 173 sqm $720K $387 Jun C Toh Guan Rd Level 13 to 15 HDB Exec 145 sqm $900K $577 Jun A Toh Guan Road #05-58 HDB Exec 144 sqm $750K $484 Jun Jurong East Avenue 1 # HDB Exec 149 sqm $610K $380 Jun Jurong East Avenue 1 # HDB Exec 149 sqm $628K $392 Jun Jurong East Street 31 # HDB Exec 141 sqm $625K $412 Jun Teban Gardens Road # HDB Exec 142 sqm $639K $418 Jun Jurong East Avenue 1 # HDB Exec 147 sqm $575K $363 May D Toh Guan Rd Level 1 to 3 HDB Exec 144 sqm $680K $439 Apr D Jurong East St 21 Level 7 to 9 HDB Exec 145 sqm $858K $550 Apr-17 No Address Property Type Size Transacted Price PSF Contract Date Pandan Gardens #04-XX HDB 5 Rm 104 sqm $365K $326 Jan D Toh Guan Road #02-XX HDB 5 Rm 123 sqm $535K $404 Jan Jurong East St 21 Level 13 to 15 HDB 5 Rm 120 sqm $565K $437 Jan Jurong East St 13 Level 4 to 6 HDB 5 Rm 120 sqm $558K $432 Jan Jurong East Street 21 #05-XX HDB 5 Rm 120 sqm $485K $ Dec Pandan Gardens #03-XX HDB 5 Rm 114 sqm $350K $285 Dec Jurong East St 21 Level 4 to 6 HDB 5 Rm 121 sqm $525K $403 Dec Toh Guan Rd Level 4 to 6 HDB 5 Rm 120 sqm $559K $433 Dec Jurong East St 21 Level 7 to 9 HDB 5 Rm 120 sqm $533K $413 Dec Jurong East St 21 Level 22 to 24 HDB 5 Rm 120 sqm $755K $584 Dec Toh Guan Rd Level 7 to 9 HDB 5 Rm 120 sqm $600K $464 Dec Pandan Gdns Level 4 to 6 HDB 5 Rm 114 sqm $365K $297 Dec Toh Guan Road #06-XX HDB 5 Rm 121 sqm $600K $461 Dec Jurong East Street 24 #10-XX HDB 5 Rm 121 sqm $500K $384 Dec Jurong East Street 32 #13-XX HDB 5 Rm $540K 29-Nov Jurong East Street 24 #11-XX HDB 5 Rm $275K 11-Nov Jurong East Street 21 #20-XX HDB 5 Rm 120 sqm $603K $467 Nov Jurong East Street 31 #03-XX HDB 5 Rm 121 sqm $465K $357 Nov Toh Guan Road #12-XX HDB 5 Rm 121 sqm $608K $467 Nov Pandan Gardens #09-XX HDB 5 Rm 114 sqm $375K $306 Nov Jurong East Street 13 #02-XX HDB 5 Rm 120 sqm $515K $399 Nov Pandan Gardens #06-XX HDB 5 Rm 104 sqm $355K $317 Nov Jurong East Street 21 #02-XX HDB 5 Rm 120 sqm $475K $368 Nov Jurong East Street 13 #22-XX HDB 5 Rm 120 sqm $670K $519 Nov D Jurong East St 21 Level 10 to 12 HDB 5 Rm 123 sqm $650K $491 Nov Jurong East Street 32 #12-XX HDB 5 Rm 135 sqm $517K $356 Nov Jurong East Street 24 #10-XX HDB 5 Rm 121 sqm $528K $406 Nov Jurong East St 21 Level 10 to 12 HDB 5 Rm 121 sqm $530K $407 Nov Jurong East Street 24 #02-XX HDB 5 Rm 121 sqm $398K $306 Oct Toh Guan Rd Level 19 to 21 HDB 5 Rm 121 sqm $652K $501 Oct-17
19 Queenstown Executive Flat Last 30 Transactions for HDB Queenstown 5-Room Flat No Address Property Type Size Transacted Price PSF Contract Date Mei Ling Street #05-XX HDB Exec 146 sqm $968K $616 Jan Mei Ling St Level 7 to 9 HDB Exec 146 sqm $958K $609 Oct Mei Ling Street #07-XX HDB Exec 155 sqm $968K $580 Sep Mei Ling Street # HDB Exec 150 sqm $860K $533 Jul Mei Ling Street # HDB Exec 156 sqm $1 160K $691 Jul Mei Ling St Level 7 to 9 HDB Exec 146 sqm $945K $601 Jul Mei Ling Street #07-85 HDB Exec 153 sqm $997K $605 Jun Mei Ling Street # HDB Exec 156 sqm $925K $551 Mar Mei Ling Street #17-47 HDB Exec 150 sqm $930K $576 Feb Mei Ling Street # HDB Exec 146 sqm $935K $595 Oct Mei Ling Street # HDB Exec 150 sqm $990K $613 Sep Mei Ling Street #03-91 HDB Exec 144 sqm $862K $556 Aug Mei Ling Street #08-59 HDB Exec 146 sqm $960K $611 Jul Mei Ling Street #04-67 HDB Exec 153 sqm $998K $606 Dec Dover Crescent # HDB Exec 146 sqm $800K $509 Aug Mei Ling Street #03-85 HDB Exec 153 sqm $930K $565 Jun Mei Ling Street #08-73 HDB Exec 150 sqm $980K $607 Aug Queens Close # HDB Exec $900K 11-Nov Mei Ling Street #16-73 HDB Exec 150 sqm $1 000K $619 Jul Mei Ling St Level 6 to 10 HDB Exec 153 sqm $900K $546 Jun Mei Ling Street #18-49 HDB Exec 146 sqm $895K $569 May Mei Ling Street # HDB Exec 157 sqm $900K $533 Jan Mei Ling Street #04-53 HDB Exec 147 sqm $835K $528 Dec Mei Ling Street #08-51 HDB Exec 147 sqm $865K $547 Nov Stirling Road # HDB Exec $580K 3-Oct Mei Ling Street # HDB Exec 147 sqm $793K $501 Jul Mei Ling Street # HDB Exec 149 sqm $840K $524 Jun Mei Ling Street #08-69 HDB Exec 142 sqm $855K $560 May Mei Ling Street #04-59 HDB Exec 146 sqm $825K $525 Apr Mei Ling Street #02-49 HDB Exec 146 sqm $778K $495 Apr-11 No Address Property Type Size Transacted Price PSF Contract Date 1 23 Ghim Moh Link #33-XX HDB 5 Rm 113 sqm $950K $781 Jan Holland Dr Level 10 to 12 HDB 5 Rm 117 sqm $720K $572 Jan Ghim Moh Road #05-XX HDB 5 Rm 117 sqm $700K $556 Jan Dover Rd Level 4 to 6 HDB 5 Rm 147 sqm $849K $537 Jan C'wealth Ave West Level 7 to 9 HDB 5 Rm 125 sqm $585K $435 Dec Ghim Moh Rd Level 16 to 18 HDB 5 Rm 119 sqm $815K $636 Dec Dover Crescent #04-XX HDB 5 Rm 134 sqm $738K $512 Dec Clarence Lane #07-XX HDB 5 Rm 122 sqm $860K $655 Dec Holland Drive #22-XX HDB 5 Rm 147 sqm $988K $625 Dec Strathmore Avenue #08-XX HDB 5 Rm 110 sqm $735K $ Nov Mei Ling Street #02-XX HDB 5 Rm 136 sqm $826K $564 Nov Commonwealth Drive #39-XX HDB 5 Rm 117 sqm $1 038K $824 Nov Ghim Moh Road #03-XX HDB 5 Rm 119 sqm $705K $550 Nov Ghim Moh Rd Level 10 to 12 HDB 5 Rm 125 sqm $760K $565 Nov Holland Drive #17-XX HDB 5 Rm 117 sqm $740K $588 Nov Ghim Moh Road #19-XX HDB 5 Rm 117 sqm $818K $650 Nov C Holland Drive #37-XX HDB 5 Rm 117 sqm $945K $751 Nov Stirling Rd Level 7 to 9 HDB 5 Rm 115 sqm $824K $666 Nov Queens Close #13-XX HDB 5 Rm 125 sqm $688K $512 Oct Commonwealth Drive #40-XX HDB 5 Rm 117 sqm $1 035K $822 Oct Ghim Moh Link #40-XX HDB 5 Rm 113 sqm $988K $813 Oct D Holland Drive #06-XX HDB 5 Rm 117 sqm $875K $695 Oct Strathmore Avenue #23-XX HDB 5 Rm 110 sqm $860K $726 Oct Holland Close #10-XX HDB 5 Rm 125 sqm $920K $684 Oct Ghim Moh Link Level 19 to 21 HDB 5 Rm 113 sqm $960K $789 Sep Mei Ling St Level 4 to 6 HDB 5 Rm 122 sqm $780K $594 Sep Holland Drive #18-XX HDB 5 Rm 114 sqm $800K $652 Sep Holland Drive #09-XX HDB 5 Rm 117 sqm $735K $584 Sep Holland Drive #18-XX HDB 5 Rm 117 sqm $825K $655 Sep Holland Dr Level 16 to 18 HDB 5 Rm 147 sqm $888K $561 Sep-17


 16 to")


20 How long it takes for relocation? Viewing of Properties (2 to 4 weeks) Finalise Selection Put 1% Option Money Exercise Option Pay 4% (2 weeks from Option Date) 16 to 24 weeks or 4 to 6 months Renovation (4 to 6 weeks) Completion of Sale (8 to 10 weeks from date of Exercise)


21 Park West Relocation Team Janice Lim Adrian Tan Andrew Yeo Emily Yeo Faith Chng Kim Soon Ian Teo Ron Quek
22 THANK YOU!
SFR Condo Residential Lot Sales Inventory Sales Inventory Sales Inventory. Month YTD Month Month YTD Month Month YTD Month
 Grand Strand Market Report 2017 capped off a great year for the Grand Strand as full year SFR sales volume and median sales price were up 9.8% and 4.3%, respectively. Condo sales activity increased 3.0%
PROPERTY ANALYSIS REPORT - SUMMARY. #13-09, Pebble Bay, 132 Tanjong Rhu Road, (S)
") - SUMMARY This report is designed to help buyers, sellers and industry experts to make better informed property decisions. It includes detailed analysis of the property, sales prices, rental prices, investment
- SUMMARY This report is designed to help buyers, sellers and industry experts to make better informed property decisions. It includes detailed analysis of the property, sales prices, rental prices, investment
While a project is typically acquired on a specific date
 A Presentation of the National Association of Home Builders While a project is typically acquired on a specific date Building rehab (if there are multiple buildings) is typically completed building by
PRIVATE TREATY LIST FEBRUARY 2019
 RESIDENTIAL LANDED 17 CORAL ISLAND, D04 * 1. 2½ -storey detached house, 4 + 1 -bedrooms. Leasehold 99 years wef 2005. VP. Land / floor area: approx. 7,557 sq ft / 8,697 sq ft, respectively Orientated towards
California Housing Market Update. Monthly Sales and Price Statistics September 2018
 California Housing Market Update Monthly Sales and Price Statistics September 2018 Sales Had the Largest Decline since March 2014 California, September 2018 Sales: 382,550 Units, -3.3% YTD, -12.4% YTY
California Housing Market Update. Monthly Sales and Price Statistics November 2018
 California Housing Market Update Monthly Sales and Price Statistics November 2018 Home Sales: Largest Decline Since 2014 California, November 2018 Sales: 381,400 Units, -4.6% YTD, -13.4% YTY 700,000 600,000
Monthly Indicators % % %
 Monthly Indicators 2016 Percent changes calculated using year-over-year comparisons. New Listings were down 27.6 percent for single family homes and 41.8 percent for townhouse-condo properties. Pending
Monthly Indicators % + 9.7% %
 Monthly Indicators 2016 Percent changes calculated using year-over-year comparisons. New Listings were up 11.1 percent for single family homes and down 30.8 percent for townhouse-condo properties. Pending
Monthly Indicators + 4.8% - 3.5% %
 Monthly Indicators 2015 New Listings were up 45.0 percent for single family/duplex homes but decreased 44.1 percent for townhouse-condo properties. Pending Sales increased 14.3 percent for single family/duplex
PROPERTY ANALYSIS REPORT - SUMMARY. #03-08, Vida, 5 Peck Hay Road, (S)
") - SUMMARY This report is designed to help buyers, sellers and industry experts to make better informed property decisions. It includes detailed analysis of the property, sales prices, rental prices, investment
- SUMMARY This report is designed to help buyers, sellers and industry experts to make better informed property decisions. It includes detailed analysis of the property, sales prices, rental prices, investment
HDB MARKET PULSE REAL ESTATE DATA TREND Q3 2018
 HDB MARKET PULSE REAL ESTATE DATA TREND Q3 2018 SkyTerrace @ Dawson Page 1 Despite lingering concerns about the depreciating value of aging flats, the HDB resale volume hit a five-year high in 2018 The
Comparables report. This report provides comparable property information selected by. to help establish the best market price for SA4 6RP.
 Comparables report This report provides comparable property information selected by to help establish the best market price for SA4 6RP 1 June 2017 Search area SA4 6RP Search radius Within ¼ mile Marketed
Property Take. Singapore Residential. Highlights. 27 Jan Q14 update on HDB resale and rental
 Property Take 27 Jan 2015 update on HDB resale and rental Singapore Residential Highlights This report and infographic are rental data for HDB RPI is down 1.5% QoQ and 6% YoY to 137.0 in, from 139.1 in
Large 3 bedroom condo in West Keystone
 Large 3 bedroom condo in West Keystone Summary 3 BR 2 Bath Condo - sleeps up to 8 Description 1638 Quicksilver - a SkyRun Keystone Property Welcome to 1638 Quicksilver! Our newest 3 bedroom in Quicksilver;
MLS of Greater Cincinnati - Charts for the Month: November 2017
 MLS of Greater Cincinnati - Charts for the Month: November 2017 The following charts provide an overview of what has occurred in the MLS over the past month. Each chart provides a historical trend. The
Greater Las Vegas Snapshot by Sale Type
 9.% Closed Sales Trend by Type December Closings by Type 8.% 7.% 6.% 8% Short Sales 1% 5.% 4.% 3.% Traditional Equity 82% 2.% 1.%.% Greater Las Vegas Snapshot by Sale Type - SFR Only Available List Price
California Housing Market Update. Monthly Sales and Price Statistics August 2018
 California Housing Market Update Monthly Sales and Price Statistics August 2018 Sales Declined for the 4 th Consecutive Month California, August 2018 Sales: 399,600 Units, -2.1% YTD, -6.6% YTY 700,000
California Housing Market Update. Monthly Sales and Price Statistics December 2018
 California Housing Market Update Monthly Sales and Price Statistics December 2018 Sales Reached the Lowest Level since Jan 2015 California, December 2018 Sales: 372,260 Units, -5.2% YTD, -11.6% YTY 700,000
PROPINSIGHT A Detailed Property Analysis Report
 PROPINSIGHT A Detailed Property Analysis Report 40,000+ Projects 10,000+ Builders 1,200+ Localities Report Created On - 7 Oct, 2015 Price Insight This section aims to show the detailed price of a project
Monthly Indicators % % - 9.2%
 Monthly Indicators 2016 New Listings were down 1.4 percent for single family/duplex homes and 25.0 percent for townhouse-condo properties. Pending Sales increased 58.3 percent for single family/duplex
Rambutan Road Report by Justin, HP: Property Summary Sheet Latest Avg PSF: $897 psf (Apr 10)
") Unit Pricing Selected Address Property Summary Sheet : 23 Rambutan Road #02-01 (1038sqft) Unit Transacted : $ 774,380 ($ 746 psf) on Apr 1, 1997 Median Price^ based on current listings : $ 1,035,924 ($
Unit Pricing Selected Address Property Summary Sheet : 23 Rambutan Road #02-01 (1038sqft) Unit Transacted : $ 774,380 ($ 746 psf) on Apr 1, 1997 Median Price^ based on current listings : $ 1,035,924 ($
July 2012 was $162,256. ($153,956). was $314,607. was $172,488. ($164,426). Kansas City Region Average Sales Price - Existing Homes
. was $314,607. was $172,488. ($164,426). Kansas City Region Average Sales Price - Existing Homes") July 212 Kansas City Regional Real Estate Market Report Average Sales Price The average exis ng home sale price in July 212 was $162,256. 25 Kansas City Region Average Sales Price - Existing Homes July
July 212 Kansas City Regional Real Estate Market Report Average Sales Price The average exis ng home sale price in July 212 was $162,256. 25 Kansas City Region Average Sales Price - Existing Homes July
California Housing Market Update. Monthly Sales and Price Statistics October 2018
 California Housing Market Update Monthly Sales and Price Statistics October 2018 Sales Had the 2 nd Largest Drop in the Last 6 Months California, October 2018 Sales: 397,060 Units, -3.7% YTD, -7.9% YTY
PROPINSIGHT A Detailed Property Analysis Report
 PROPINSIGHT A Detailed Property Analysis Report 40,000+ Projects 10,000+ Builders 1,200+ Localities Report Created On - 7 Oct, 2015 Price Insight This section aims to show the detailed price of a project
Mass Briefing: 22 nd March 2017
 Mass Briefing: 22 nd March 2017 RARE FREEHOLD DEVELOPMENT IN DISTRICT 2!!! When Attention Is On Other Side of Singapore When Attention Is On Other Side of Singapore Location Right At The Doorstep Of CBD
City of Surrey Land Development Applications
 City of Surrey Land Development Applications Development Permits Issued Application Final Approval 16 000337 06-Feb-17 12528 52A Ave Development Permit to reduce the front yard (north) setback to facilitate
California Housing Market Update. Monthly Sales and Price Statistics May 2018
 California Housing Market Update Monthly Sales and Price Statistics May 2018 Sales Lost Momentum as Mortgage Rates Continued to Climb California, May 2018 Sales: 409,270 Units, +0.3% YTD, -4.6% YTY 700,000
27 FEBRUARY 2019, WEDNESDAY
 RESIDENTIAL - LANDED 1 Property: 2 Property: 3 Property: 17 CORAL ISLAND, SENTOSA COVE- D04 2.5-storey bungalow 99 yrs wef 2005 Land: 7557 sq ft / Built: 8697 sq ft 76 HILLCREST ROAD - D11 2-storey semi
HENG HARDWARE ENGINEERING PTE LTD
 S/N Project 1 52th STOREY POSBANK HQ AT ROBINSON 2 BEDOK WATER RECLAMATION PLANT 3 BISHAN MRT 4 BOON LAY MRT EXTENSION 5 CHANGI NORTH FACTORY CUM OFFICE 6 CHANGI PRISON COMPLEX - SPECIAL SERVICE CENTRE
L A N D E D H O U S E S F O R S A L E *** Direct from Developer ***
 L A N D E D H O U S E S F O R S A L E *** Direct from Developer *** I. LOCATION MAP Scroll down for more details II. PROPERTY DETAILS Page 1 of 11 HOUSES FOR SALE *** Direct from Developer *** Important
45 Court Street New Haven, CT 06511
 PROFESSIONAL OFFICE BUILDING SALE - LEASE BACK AVAILABLE 45 Court Street New Haven, CT 06511 14,194 SF Office Building Presently owner occupied w/ 2 tenants willing To sign long-term leases Also willing
Huge 2 Bedroom Condo with Private Hot Tub - Quick Walk to the Slopes!
 Huge 2 Bedroom Condo with Private Hot Tub - Quick Walk to the Slopes! Summary 2 BR 2 Bath Condo - sleeps up to 9 Description 221 Cinnamon Ridge I - a SkyRun Keystone Property -- Walking distance to Mountain
PROPINSIGHT A Detailed Property Analysis Report
 PROPINSIGHT A Detailed Property Analysis Report 40,000+ Projects 10,000+ Builders 1,200+ Localities Report Created On - 7 Oct, 2015 Price Insight This section aims to show the detailed price of a project
The University of Massachusetts Campus Master Plan. Faculty Senate April 21st
 The University of Massachusetts Campus Master Plan Faculty Senate April 21st Update on process and schedule 2011 Summer 2012 Oct Nov Dec Jan Feb Mar Apr May Jun Jul Aug Sep Oct Nov Dec Jan Feb Mar Apr
Monthly Indicators % % - 3.5%
 Monthly Indicators 2017 New Listings were up 6.3 percent for the category but decreased 33.1 percent for the category. Pending Sales increased 5.0 percent for but decreased 1.3 percent for. The Median
PROPINSIGHT A Detailed Property Analysis Report
 PROPINSIGHT A Detailed Property Analysis Report 40,000+ Projects 10,000+ Builders 1,200+ Localities Report Created On - 7 Oct, 2015 Price Insight This section aims to show the detailed price of a project
Bella Luna Gorgeous 3 Bedroom 3 Bath Condo - New Owners!!
 Bella Luna 202 - Gorgeous 3 Bedroom 3 Bath Condo - New Owners!! Summary 3 Bedroom 3 Bath Luxury Condo Description The Bella Luna is one of the finest places to stay in Orange Beach! This complex is not
THE OUTLOOK FOR HOUSING IN ILLINOIS
 THE OUTLOOK FOR HOUSING IN ILLINOIS Jonathan Smoke Chief Economist January 25, 2017 NATIONAL TRENDS 2 2000.01 2000.05 2000.09 2001.01 2001.05 2001.09 2002.01 2002.05 2002.09 2003.01 2003.05 2003.09 2004.01
PROPINSIGHT A Detailed Property Analysis Report
 PROPINSIGHT A Detailed Property Analysis Report 40,000+ Projects 10,000+ Builders 1,200+ Localities Report Created On - 7 Oct, 2015 Price Insight This section aims to show the detailed price of a project
L A N D E D H O U S E S F O R S A L E *** Direct from Developer ***
 L A N D E D H O U S E S F O R S A L E *** Direct from Developer *** I. LOCATION MAP Scroll down for more details II. PROPERTY DETAILS Page 1 of 8 HOUSES FOR SALE *** Direct from Developer *** II. PROPERTY
2017 IN REVIEW THE BLUE MTS. REAL ESTATE MARKET REPORT LOCATIONS ROYAL LEPAGE S 2016 BROKERAGE OF THE YEAR FOR ONTARIO.
 THE BLUE MTS. REAL ESTATE MARKET REPORT IN REVIEW WE RE PROUD AND GRATEFUL TO HAVE BEEN CHOSEN AS ROYAL LEPAGE S BROKERAGE OF THE YEAR FOR ONTARIO OVERVIEW RECORD VOLUME SALES, HIGHER PRICES, SHORTER SALE
M onthly arket. July Table of Contents. Monthly Highlights
 Table of Contents Market Inventory...2 www.gaar.com Monthly Highlights The median sale price of single-family, detached homes climbed to $190,000 in July 2014, the highest level since August 2008. Market
Oversupply persists despite improved sales activity for affordable product Mar. 2019
 March 19 MONTHLY STATISTICS PACKAGE Oversupply persists despite improved sales activity for affordable product 19, April 1, 19 March saw a modest decline in city wide sales activity compared to last year.
PROPINSIGHT A Detailed Property Analysis Report
 PROPINSIGHT A Detailed Property Analysis Report 40,000+ Projects 10,000+ Builders 1,200+ Localities Report Created On - 17 Aug, 2016 Price Insight This section aims to show the detailed price of a project
Al Andalus Spanish Style Apartments 30% During Construction and 70% on Handover AL ANDALUS JUMEIRAH GOLF ESTATES
 Al Andalus Spanish Style Apartments 30% During Construction and 70% on Handover AL ANDALUS JUMEIRAH GOLF ESTATES Jumeirah Golf Estate s new community is characterized by rich, elegant living in view-oriented
Information sheet A Data
 House prices: Statistics activity House prices change over time, but do so at different rates in different places. In this activity you will use statistical diagrams and measures to compare house prices
657 S Belvoir South Euclid, OH Mark Khuri
 657 S Belvoir South Euclid, OH 44121 Overview Property Type: Multi-Family Size: 6,612 sq ft Sale Price: $499,000 # of Units: 8 Year Built: 1972 # of Stories: 2 Construction: Brick Parking Type: Covered
NNN Investment Offering Auction 122 Harper Ave. Carolina Beach, NC Hampton INN
 NNN Investment Offering Auction 122 Harper Ave. Carolina Beach, NC Hampton INN 122 HARPER AVE. PHOTO LOG LOOKING NE AT SITE LOOKING SW AT SITE LOOKING WEST AT SITE LOOKING NORTH AT SITE PDF Created with
PROPINSIGHT A Detailed Property Analysis Report
 PROPINSIGHT A Detailed Property Analysis Report 40,000+ Projects 10,000+ Builders 1,200+ Localities Report Created On - 7 Oct, 2015 Price Insight This section aims to show the detailed price of a project
Outlook for Median Home Selling Prices. United States data are useless for us.
 Outlook for Median Home Selling Prices Outline United States Data Unobserved Prices The Future of California s Median Home Price Bill Watkins August 28, 28 2.% Existing Single-family Housing Sales percent
PROPINSIGHT A Detailed Property Analysis Report
 PROPINSIGHT A Detailed Property Analysis Report 40,000+ Projects 10,000+ Builders 1,200+ Localities Report Created On - 7 Oct, 2015 Price Insight This section aims to show the detailed price of a project
(RM47,184,200) (RM5,662,300) (RM5,662,300) (RM5,662,300) (RM9,029,300) (RM7,472,500) (RM5,687,500) (RM5,687,500) (RM2,320,500) 30% of comm.
 (RM5,662,300) (RM5,662,300) (RM5,662,300) (RM9,029,300) (RM7,472,500) (RM5,687,500) (RM5,687,500) (RM2,320,500) 30% of comm.") INCOME APPROACH TO VALUE (DISCOUNTED CASH FLOW ) - NO GROWTH MODEL 0.5 1.5 2.5 3.5 4.5 5.5 6.5 7.5 GROSS DEVELOPMENT VALUE (GDV) Total Year 1 Year 2 Year 3 Year 4 Year 5 Year 6 Year 7 Year 8 Residential
INCOME APPROACH TO VALUE (DISCOUNTED CASH FLOW ) - NO GROWTH MODEL 0.5 1.5 2.5 3.5 4.5 5.5 6.5 7.5 GROSS DEVELOPMENT VALUE (GDV) Total Year 1 Year 2 Year 3 Year 4 Year 5 Year 6 Year 7 Year 8 Residential
PROPINSIGHT A Detailed Property Analysis Report
 PROPINSIGHT A Detailed Property Analysis Report 40,000+ Projects 10,000+ Builders 1,200+ Localities Report Created On - 7 Oct, 2015 Price Insight This section aims to show the detailed price of a project
PROPINSIGHT A Detailed Property Analysis Report
 PROPINSIGHT A Detailed Property Analysis Report 40,000+ Projects 10,000+ Builders 1,200+ Localities Report Created On - 7 Oct, 2015 Price Insight This section aims to show the detailed price of a project
A Panel Discussion of Developments, Trends and Issues Affecting Commercial Property Iowa Commercial Real Estate Expo
 A Panel Discussion of Developments, Trends and Issues Affecting Commercial Property By Bryon Tack, MAI, CAE Polk County Deputy Assessor January 1 : Assessment of property (appraisal date) Historical data
Resale Market June Resale Market June *Based on numbers compiled on 2 nd July 2018.
 About Q: What is the SRX Residential Property Flash Report? A: The SRX Residential Property Flash Report is a monthly report that tracks and disseminates resale and rental property prices for HDB and Non-Landed
Resale Market September Resale Market September *Based on numbers compiled on 2 nd October 2018.
 About Q: What is the SRX Residential Property Flash Report? A: The SRX Residential Property Flash Report is a monthly report that tracks and disseminates resale and rental property prices for HDB and Non-Landed
Resale Market April Resale Market April *Based on numbers compiled on 2 nd May 2018.
 About Q: What is the SRX Residential Property Flash Report? A: The SRX Residential Property Flash Report is a monthly report that tracks and disseminates resale and rental property prices for HDB and Non-Landed
Resale Market May Resale Market May *Based on numbers compiled on 4 nd June 2018.
 About Q: What is the SRX Residential Property Flash Report? A: The SRX Residential Property Flash Report is a monthly report that tracks and disseminates resale and rental property prices for HDB and Non-Landed
Resale Market March Resale Market March *Based on numbers compiled on 2 nd April 2018.
 About Q: What is the SRX Residential Property Flash Report? A: The SRX Residential Property Flash Report is a monthly report that tracks and disseminates resale and rental property prices for HDB and Non-Landed
Resale Market August Resale Market August *Based on numbers compiled 4 th September 2017.
 About Q: What is the SRX Residential Property Flash Report? A: The SRX Residential Property Flash Report is a monthly report that tracks and disseminates resale and rental property prices for HDB and Non-Landed
Resale Market December Resale Market December *Based on numbers compiled on 2 nd January 2017.
 About Q: What is the SRX Residential Property Flash Report? A: The SRX Residential Property Flash Report is a monthly report that tracks and disseminates resale and rental property prices for HDB and Non-Landed
Resale Market October Resale Market September 2018 *Based on numbers compiled on 5 th November 2018.
 Resale Market October 2018 About Q: What is the SRX Residential Property Flash Report? A: The SRX Residential Property Flash Report is a monthly report that tracks and disseminates resale and rental property
Monthly Indicators % % %
 Monthly Indicators 2018 Percent changes calculated using year-over-year comparisons. New Listings were down 12.9 percent for single family homes and 21.3 percent for townhouse-condo properties. Pending
BUILDING STATISTICS SUMMARY Period From: Jan Year: 2018
 Period From: Jan 01-31 There were 23 completed. There were 42 issued with a total construction value of SINGLE FAMILY DWELLINGS 8 $4,440,000.00 CARRIAGE HOUSES 0 $0.00 SECONDARY SUITES 2 $65,000.00 Construction
Puerto Rico Housing Finance Authority Housing Stimulus Programs
 Puerto Rico Housing Finance Authority Housing Stimulus Programs March 31, 2012 (Final with US Data) Total sales assisted by PRHFA stimulus from $240MM Fund Assignment As of March 31, 2012 Silent Second
PROPINSIGHT A Detailed Property Analysis Report
 PROPINSIGHT A Detailed Property Analysis Report 40,000+ Projects 10,000+ Builders 1,200+ Localities Report Created On - 7 Oct, 2015 Price Insight This section aims to show the detailed price of a project
England Occupancy Survey May 2017 SUMMARY OF RESULTS
 England Occupancy Survey 2017 SUMMARY OF RESULTS Room occupancy in 2017 increased +1% to 73%. Bedspace occupancy also increased +1% to 54%. Weekday room occupancy remained stable at 72% whilst weekend
PROPINSIGHT A Detailed Property Analysis Report
 PROPINSIGHT A Detailed Property Analysis Report 40,000+ Projects 10,000+ Builders 1,200+ Localities Report Created On - 7 Oct, 2015 Price Insight This section aims to show the detailed price of a project
Monthly Indicators + 7.3% + 6.6% + 8.3% Single-Family Market Overview Condo Market Overview New Listings Pending Sales.
 Monthly Indicators 2018 The three most prominent national market trends for residential real estate are the ongoing lack of abundant inventory, the steadily upward movement of home prices and year-over-year
North York. Development Portfolio North York
 North York Director : Tom Keefe For further information about these projects, contact: Beverly Thomas 1) - Highway 00 Jane St Keele St C N R Dufferin St 10 Finch Ave E Finch Ave W Sheppard Ave W Steeles
Manhattan Residential Rental Market Report
 Manhattan Residential Rental Market Report First Quarter 6 First Quarter 6 This report analyzes data on Manhattan rental market activity in the First Quarter of 6 (January through March 3). By the end
PROPINSIGHT A Detailed Property Analysis Report
 PROPINSIGHT A Detailed Property Analysis Report 40,000+ Projects 10,000+ Builders 1,200+ Localities Report Created On - 7 Oct, 2015 Price Insight This section aims to show the detailed price of a project
Charming and Updated 2 Bedroom with High End Finishes!
 Charming and Updated 2 Bedroom with High End Finishes! Summary 2 BR 2 Bath Condo - sleeps up to 8 Description 2065 The Pines - a SkyRun Keystone Property Welcome to 2065 The Pines, a lovely second floor
PROPINSIGHT A Detailed Property Analysis Report
 PROPINSIGHT A Detailed Property Analysis Report 40,000+ Projects 10,000+ Builders 1,200+ Localities Report Created On - 7 Oct, 2015 Price Insight This section aims to show the detailed price of a project
Presented by Corporate Visions Pte Ltd
 Our Vision : To be the leading consultancy in commercial and industrial properties Our Mission: To provide professional, value-added and cost effective business space solutions Presented by Corporate Visions
Dec December 2018
 December MONTHLY STATISTICS PACKAGE Job market weakness and lending restrictions a common thread in s housing market, January, 19 As oversupply continues in Calgary s housing market, December prices eased
Foreclosure. Report Douglas County Property 3,000 2,680 2,500 2,403 2,180 2,000 1,856 1,500 1,258 1,279 1,000 1, ,062 1,051
 3, 2,68 2,5 2,43 2,18 2, Douglas County Property 1,856 1,5 Foreclosure 1,258 1, Report 21 8 912 1,64 992 1,62 1,51 1,279 652 5 415 212 27 2 21 22 23 24 25 26 27 28 29 21 Page 1 of 12 Table of contents
PROPINSIGHT A Detailed Property Analysis Report
 PROPINSIGHT A Detailed Property Analysis Report 40,000+ Projects 10,000+ Builders 1,200+ Localities Report Created On - 7 Oct, 2015 Price Insight This section aims to show the detailed price of a project
FOR SALE MAHN PLAZA. John Son. my.leeorange.net/11512magnolia bre #
 FOR SALE 11512 Magnolia Street Garden Grove, CA Exclusive Advisor: John Son 714.564.7183 json@lee-associates.com bre #01069091 my.leeorange.net/11512magnolia TABLE OF CONTENTS FINANCIAL INFORMATION Financial
Rental Market February 2018 *Based on numbers compiled 9 th March 2018.
 Rental Market February 2018 About Q: What is the SRX Residential Property Flash Report? A: The SRX Residential Property Flash Report is a monthly report that tracks and disseminates resale and rental property
Rental Market January 2018 *Based on numbers compiled 9 th February 2018.
 Rental Market January 2018 About Q: What is the SRX Residential Property Flash Report? A: The SRX Residential Property Flash Report is a monthly report that tracks and disseminates resale and rental property
Rental Market May 2018 *Based on numbers compiled 11 th June 2018.
 Rental Market May 2018 About Q: What is the SRX Residential Property Flash Report? A: The SRX Residential Property Flash Report is a monthly report that tracks and disseminates resale and rental property
Rental Market July 2018 *Based on numbers compiled 6 th August 2018.
 Rental Market July 2018 About Q: What is the SRX Residential Property Flash Report? A: The SRX Residential Property Flash Report is a monthly report that tracks and disseminates resale and rental property
Rental Market September 2017 *Based on numbers compiled 7 th October 2017.
 Rental Market September 2017 About Q: What is the SRX Residential Property Flash Report? A: The SRX Residential Property Flash Report is a monthly report that tracks and disseminates resale and rental
PROPINSIGHT A Detailed Property Analysis Report
 PROPINSIGHT A Detailed Property Analysis Report 40,000+ Projects 10,000+ Builders 1,200+ Localities Report Created On - 7 Oct, 2015 Price Insight This section aims to show the detailed price of a project
Manhattan Residential Rental Market Report
 average $2,33 $2,755 $3,15 $4,312 median $2,155 $2,525 $3,1 $3,6 Washington Harlem $4,8 $3,225 Morningside $4,22 $3,835 $3,4 $3,35 Upper Side $3,939 $3,4 C e n t r a l P a r k $4,876 $4,498 $3,45 $4,125
PROPINSIGHT A Detailed Property Analysis Report
 PROPINSIGHT A Detailed Property Analysis Report 40,000+ Projects 10,000+ Builders 1,200+ Localities Report Created On - 7 Oct, 2015 Price Insight This section aims to show the detailed price of a project
SIM LIAN GROUP LIMITED
 MEDIA RELEASE Overwhelming Response to Wandervale by Sim Lian Group Executive condominium ideally located at Choa Chu Kang Central more than 1.4 times subscribed Singapore, February 28, 2016 Following
May 2008 MLS Month in Review
 May 28 MLS Month in Review The Albuquerque Market continues to improve, and it s evident that finally, the negative media is turning into positive media. This month s TOP Selling Price Range is $2K to
New properties will be added daily. Please check individual adverts for closing dates. Studio sheltered flat ref no: 154
 New properties will be added daily. Please check individual adverts for closing dates Studio sheltered flat ref no: 154 Location:Rectory Close, Snodland Landlord: Social Rent: 88.74 pw Service Charge:
Presented by Corporate Visions Pte Ltd
 Our Vision : To be the leading consultancy in commercial and industrial properties Our Mission: To provide professional, value-added and cost effective business space solutions Presented by Corporate Visions
FALLON CHURCHILL COUNTY, NEVADA RESIDENTIAL REAL ESTATE TRACKING REPORT
 FALLON CHURCHILL COUNTY, NEVADA RESIDENTIAL REAL ESTATE TRACKING REPORT 3rd QUARTER 15 BOB GETTO, C.R.S. & S.F.R. Nevada real estate broker, Lic # 16039 Council of Residential Specialists certified, National
PROPINSIGHT A Detailed Property Analysis Report
 PROPINSIGHT A Detailed Property Analysis Report 40,000+ Projects 10,000+ Builders 1,200+ Localities Report Created On - 7 Oct, 2015 Price Insight This section aims to show the detailed price of a project
PROPINSIGHT A Detailed Property Analysis Report
 PROPINSIGHT A Detailed Property Analysis Report 40,000+ Projects 10,000+ Builders 1,200+ Localities Report Created On - 7 Oct, 2015 Price Insight This section aims to show the detailed price of a project
CASE STUDY DEVELOPER CONTRIBUTES LAND AS EQUITY INTRODUCTION
 CASE STUDY DEVELOPER CONTRIBUTES LAND AS EQUITY INTRODUCTION This case study demonstrates where a developer owns a parcel of land that they are developing, and they want the Performance Indicators in the
New year kicks off with slow sales Jan. 2019
 January 19 19 MONTHLY STATISTICS PACKAGE New year kicks off with slow sales 19, February 1, 19 As economic challenges linger into 19, housing markets remain on a sluggish pace. January sales totalled 8
PROPINSIGHT A Detailed Property Analysis Report
 PROPINSIGHT A Detailed Property Analysis Report 40,000+ Projects 10,000+ Builders 1,200+ Localities Report Created On - 17 Aug, 2016 Price Insight This section aims to show the detailed price of a project
While every reasonable care has been taken in preparing the contents of this property summary, the developer and Knight Frank agent cannot be held
 Classic yet contemporary Rear perspective THE COURTYARD POOLSIDE /DINING PAVILION OUTDOOR DINING PAVILION Executive Summary Developer Aurum Land Pte Ltd (Subsidiary of Woh Hup Holdings Pte Ltd) Description
JES2 and JES3 Releases. RSU Level. r6.0 build 151 r2.3, r2.2, r2.1 r2.3, r2.2, r2.1 RSU1803
 level and Integrated System Test (IST) lab details IBM Software run in CA's Integrated System Test (IST) lab Type Publish Date Includes PTFs, HIPERs, PRPs, and required PREREQs published in: CSM level