Colorado Springs Metro Area Apartment Vacancy and Rent Study
|
|
|
- Joleen Cox
- 6 years ago
- Views:
Transcription
1 Colorado Springs Metro Area Apartment Vacancy and Rent Study Third Quarter 2017 Sponsored by Apartment Association of Southern Colorado State of Colorado Division of Housing ARA, A Newmark Company researched and authored by Ron L. Throupe, Ph.D. & Jennifer L Von Stroh Copyright 2017 Report covers the complete Multi-Family Market
2 Survey Sponsors Apartment Association of Southern Colorado 2790 North Academy Blvd., Suite 227 Colorado Springs, CO Laura Russmann, Executive Director : fax Colorado Division of Housing 1313 Sherman Street, #518 Denver, CO Alison George, Director : fax ARA, A Newmark Company 1800 Larimer Street, Suite 1700 Denver, CO Kevin McKenna, Executive Managing Director kmckenna@aranewmark.com Researched and Authored by Ron L Throupe University of Denver Daniels College of Business Burns School of Real Estate & Construction Management 944 Aztec Drive Castle Rock, CO (425) voice rthroupe@du.edu Jennifer L. Von Stroh Colorado Economic & Management Associates 2581 East Wynterbrook Drive Denver, CO VonStrohHousingSurvey@gmail.com The sponsors of the Colorado Springs Metropolitan Area Apartment Vacancy and Rent Survey contract with an independent researcher to produce this information. No individual information is released by the researcher to a sponsor or to the public. It is illegal and unethical to copy this report without the permission of the researcher. Copyright 2017
3 TABLE OF CONTENTS Topic Page Summary 1 Methodology 2 Map - Colorado Springs Metro Area Apartment Markets 4 Graph of Metropolitan Area Vacancy by Quarter 5 Graph of Rent by Quarter 6 Graph of Rent per Square Foot by Quarter 7 Graph of Total Apartment Units by Quarter 8 Graph of Resident Turnover by Quarter 9 Graph of Vacancy and Rent by Apartment Type 10 Vacancy Rates by Market Area 11 Vacancy Rates by Size of Building 12 Vacancies by Age of Building 13 Average Rents by Market Area 14 Average Rents by Size of Building 15 Average Rents by Age of Building 16 Average Rents by Apartment Type 17 Average Rents for the Metropolitan Area by Market Area 18 Average Rent Per Square Foot by Apartment Type and Market Area 19 Median Rent by Apartment Type 20 Economic Vacancy Rates by Size, Age, and Market Area 21 Rental Losses from Discounts/Concessions, Models, Delinquents, and Bad Debts 22 Average Rent for Apartment/Building/Community Features and Amenities 23 Apartment Unit Inventory and Absorption 24 Resident Turnover per Month by Size and Age of Buildings 25 Number of Survey Responses by Market Area by Quarter 26 Composite Report for Colorado Springs Metro Area 27 Reports by Market Areas Northwest 28 Northeast 29 Far Northeast 30 Southeast 31 Security/Widefield/Fountain 32 Southwest 33 Central 34
4 Colorado Springs Vacancy & Rental Rate Executive Summary Third Quarter 2017 VACANCY: 5.4% o Last Quarter: 6.4 % o This quarter 2016: 4.0 % o This quarter 2015: 4.2 % o o o One market area showed an increase in vacancy rate while six market areas showed a decrease. Buildings with units had the highest vacancy rate at 6.6%. Buildings with 9-50 units had the lowest vacancy rate of 3.4 %. Historically, larger buildings have the highest vacancy rates. Buildings constructed After 2010 had the highest vacancies at Those constructed had the lowest vacancy rate at 2.0 %. RENTAL RATES o Median rent: $ 1, Last quarter: $ 1, This quarter 2016: $ 1, This quarter 2015: $ o Average rent: $ 1, Last quarter: $ 1, This quarter 2016: $ 1, This quarter 2015: $ o Rent / square foot: $ 1.34 Last quarter: $ 1.35 This quarter 2016: $ 1.24 This quarter 2015: $ 1.13 o o Average Rent for Units constructed 2010-now $ 1, $ 1, $ 1, $ 1, $ $ prior $ 1, Rents do not include the cost of rental discounts and concessions. For the current quarter, rental discounts and concessions averaged 5.9 percent, as compared to 13.2 percent for the prior quarter. ECONOMIC VACANCY: 13.4 % o Last Quarter: 18.8% o This quarter 2016: 12.2% o This quarter 2015: 10.4% Economic vacancy is defined as physical vacancy plus concessions and discounts as a percent of gross potential rent. NEW UNITS ADDED Current Quarter: 711 Current Year: 1,481 Total Units: 49,220 1
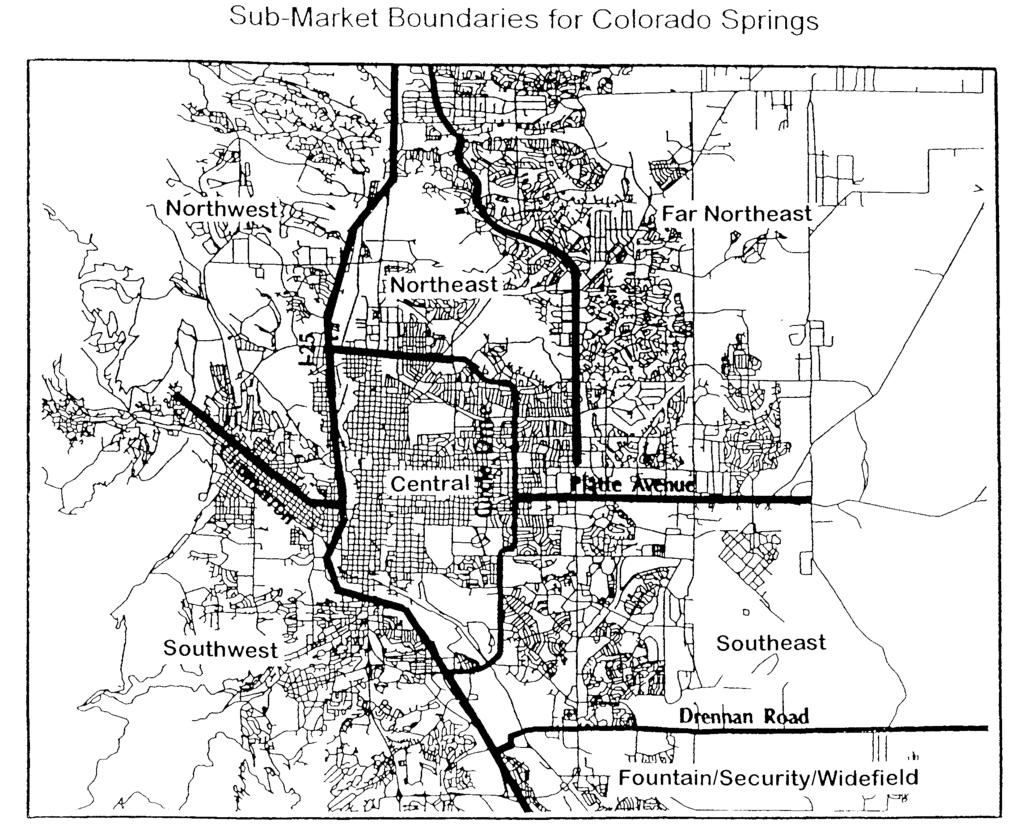
5 For the third quarter of 2017, there was a net absorption of 1,129 units for the Colorado Springs area. For third quarter of 2016, there was a net absorption of 581. For third quarter of 2015, the total absorption was 149 units. Absorption is the net change in the number of apartment units rented in the current time period (quarter/year) compared to the previous time period (quarter/year). OVERALL COMMENTS The third quarter of 2017 saw the addition of 711 units to the inventory, as compared to a total of 108 in third quarter For all of 2016 there were a total of 528 new additions and for 2015, 753. For all of 2014 there were 716 new additions. For 2013 there were 568 additions was the first year of significant inventory additions since 2009 (299), and the most since 2003 (1449), which represented a historic high during a prior economic cycle. With a limited number of new additions the prior two years, a somewhat lowering of the unemployment rate, continued immigration, and an increase in metro area natural population, a continued low vacancy rate this quarter was expected. Historically there is a downward movement in the vacancy rate during the second and third quarters of the year, which we have seen again in The overall average rent for the last ten years has increased from around $ in 2002 to $1, this quarter. The Colorado Springs Area Apartment Vacancy and Rent Survey reports median and average rates, and, as a result, there are often differences in rental rates and vacancy rates by apartment type, size, location, and age of building/complex. All information is based on data received for the month of September, except for resident turnover and rental losses, which is for August. This survey is conducted via online submissions. It includes only those units with a certificate of occupancy. This quarter s Survey includes information on 22,150 apartment units. The Survey is possible because of the excellent participation and help of professionals in the apartment industry and the consistent support of the Survey sponsors. Comments on the Survey are welcome at VonStrohHousingSurvey@gmail.com REPORT METHODOLOGY The purpose of the Colorado Springs Metropolitan Area Apartment Vacancy and Rental Survey is to show vacancy and rental rates by type of apartment (efficiency; one bedroom; two bedroom, one bath; two bedroom, two bath; three bedroom; other; and totals) and by location, age, size of unit, and size of building. The Survey includes all multi-family rental, two units and up. The survey covers seven market areas: northwest; northeast; far northeast; southeast; Security/Widefield/Fountain; southwest; and central. The boundaries for the Colorado Springs Metropolitan Area are: Northwest: on the east, I-25 and on the south, Cimarron Street, Eighth Street and Lower Gold Camp Road; Northeast: on the west and southwest, I-25, Nevada Avenue, Austin Bluffs Parkway, Union Blvd., and Circle Drive and on the south, Platte Avenue; on the north, northeast, and east, Academy Boulevard; Far Northeast: on the west and northwest, Academy Boulevard and I-25; on the south, Platte Avenue; Southeast: on the north, Platte Avenue, on the west, Circle Drive and I-25 and on the south, Drennan Road; 2
6 Security/Widefield/Fountain: on the north, Drennan Road and on the west, I-25; Southwest: on the east, I-25 and on the north and west, Cimarron Street, Eighth Street, and Lower Gold Camp Road; and Central: on the north and east, Austin Bluffs Parkway, Union Blvd, Circle Drive and on the south and west, Circle Drive and I-25. Market area reports are labeled by one of the above seven market areas. With the reports for each market area, the following format is used for each type of apartment by rent level: 9 = number of units vacant (first figure) 194 = total number of units reporting (second figure) 4.6% = vacancy rate (third figure) When no figures are shown, no apartments of that specific size and rent level were reported. With the summary tables, there may be no data or there may be only a limited number of complexes and disclosing the information would reduce confidentiality. All vacancy and rental rates are as of the 10 th of February for the first quarter, 10 th of June for the second quarter, 10 th of September of the third quarter and the 10 th of December for the fourth quarter. The data for resident turnover is from the respective months of February, May, August and November. The market samples are based on the assumption that the rates were for unfurnished rental units with tenants paying electricity and gas. Apartment complex/building lists were developed from official lists. Returned survey forms were checked for completeness, then coded and entered into the computer for processing. Tabulations are performed by the use of a computerized program. The cumulative totals have a confidence interval of +/-1 percent at the 95 percent confidence level. The information for this survey was obtained from participating apartment managers, owners, and property managers. All information collected on each building/complex is TOTALLY CONFIDENTIAL. Only survey totals are published. Information furnished by participants is considered reliable. The sponsors and author make no warranty, express or implied, and assume no legal liability or responsibility for the inclusion of data from the participants in the survey or for the use of the data from the Survey. Any quotations and/or reproductions of the survey must indicate the sponsors and the author. This report is copyrighted by Jennifer L. Von Stroh. Since 1995 the Division of Housing of the State of Colorado has funded the Colorado Multi-Family Housing Vacancy and Rental Survey for various Colorado communities. These surveys cover the first and third quarters. A public/private partnership has committed to sponsor the Colorado Springs Metropolitan Area Apartment Vacancy and Rental survey for the Second and Fourth Quarters. In the spirit of cooperation, all sponsors share in the credit for this combined effort to provide information on the apartment industry. The intent is to provide information that will be used by all individuals associated with the industry. The excellent industry cooperation by various apartment associations, county and local officials, apartment owners and managers is appreciated. Survey management and analysis was done by Dr. Ron L. Throupe of The University of Denver and Jennifer L. Von Stroh of Colorado Economic and Management Associates. The sponsors and author of this report view it as a work in progress. The intent is to make this Survey consistent in methodology and scope with the other multi-family housing surveys that are conducted for the remainder of the state. The goal is to have multi-family rental market data that is comparable statewide. As the sample size increases and the research procedures become fixed, new market areas will be added to the report. The market areas selected for the report were determined on the basis of market size. Changes in format, tables and graphs are possible if user recommendation indicate a change is warranted. The accuracy and reliability of this Survey can be improved by increasing the size of the sample returns for each market area. If you are an owner or manager of multi-family rental housing in the listed market areas, and would like to participate in the Survey, please contact Jennifer Von Stroh at VonStrohHousingSurvey@gmail.com, or write to her at 2581 Wynterbrook Drive, Highlands Ranch, Colorado,
7 4

8 Vacancy by Quarter Vacancy Rate (in percent) Q Q Q Q Q Q Q Q Q Q Q Q Q Q Q Q Q Q Q Q Q Q Q Q Q Q Q Q Q Q Q Q Q Q Q Q Q Q Q Q Q Q Q Q Q3 Year and Quarter 5

9 Average Rent by Quarter 1200 Average Monthly Rent (in dollars) Q Q Q Q Q Q Q Q Q Q Q Q Q Q Q Q Q Q Q Q Q Q Q Q Q Q Q Q Q Q Q Q Q Q Q Q Q Q Q Q Q Q Q Q Q3 Year and Quarter 6

10 Rent per Square Foot 1.6 Rent per Square Foot (in dollars) Q Q Q Q Q Q Q Q Q Q Q Q Q Q Q Q Q Q Q Q Q Q Q Q Q Q Q Q Q Q Q Q Q Q Q Q Q Q Q Q Q Q Q Q Q3 Year and Quarter 7

11 Total Apartment Units Total Units Q Q Q Q Q Q Q Q Q Q Q Q Q Q Q Q Q Q Q Q Q Q Q Q Q Q Q Q Q Q Q Q Q Q Q Q Q Q Q Q Q Q Q Q Q3 Year and Quarter 8
12 Resident Turnover per Month 8 7 Turnover (in percent) Q Q Q Q Q Q Q Q Q Q Q Q Q Q Q Q Q Q Q Q Q Q Q Q Q Q Q Q Q Q Q Q Q Q Q Q Q Q Q Q Q Q Q Q Q Q Q Q Q Q Q Q Q Q Q Q Q Q Q Q Q Q Q Q Q Q Q Q Q Q Q Q Q Q Q Q Q Q Q Q3 Year and Quarter 9
13 Comparisons by Apartment Type Vacancy Rate (In percent) Efficiency One Bedroom Two Bedroom, One Bathroom Two Bedroom, Two Bathroom Three Bedroom All Units Average Rent (In dollars) Efficiency One Bedroom Two Bedroom, One Bathroom Two Bedroom, Two Bathroom Three Bedroom All Units Apartment Type 10
14 Vacancy Rates by Market Area First Figure For Colorado Springs Metro Area - Vacancy for Quarter Second Figure For Colorado Springs Metro Area - Four Quarter Average Figures for Market Areas Are For Current Quarter Year ### Quarter 4th 1st 2nd 3rd 4th 1st 2nd 3rd 4th 1st 2nd 3rd 4th 1st 2nd 3rd 4th 1st 2nd 3rd 4th 1st 2nd 3rd 4th 1st 2nd 3rd 4th 1st 2nd 3rd 4th 1st 2nd 3rd 4th 1st 2nd 3rd 4th Colorado Springs Vacancy for Quarter Four Quarter Average Change from a Year Ago Market Areas Northwest Northeast Far - Northeast Southeast Security/Widefield/Fountain Southwest Central
15 Vacancies by Size of Building (In Percent) Year ### Quarter 4th 1st 2nd 3rd 4th 1st 2nd 3rd 4th 1st 2nd 3rd 4th 1st 2nd 3rd 4th 1st 2nd 3rd 4th 1st 2nd 3rd 4th 1st 2nd 3rd 4th 1st 2nd 3rd 4th 1st 2nd 3rd 4th 1st 2nd 3rd 4th Colorado Springs Metro Area Building Size (Number of Units) 2 to to to to to and up Prior to third quarter 2003, 200 to 349 was for 200 and up. 12
16 Vacancies by Age of Building (In Percent) Year Quarter 4th 1st 2nd 3rd 4th 1st 2nd 3rd 4th 1st 2nd 3rd 4th 1st 2nd 3rd 4th 1st 2nd 3rd 4th 1st 2nd 3rd 4th 1st 2nd 3rd 4th 1st 2nd 3rd 4th 1st 2nd 3rd 4th 1st 2nd 3rd 4th Colorado Springs Metro Average Year Built To and up
17 Average Rent by Market Area (In Dollars) Year Market Area 4th 1st 2nd 3rd 4th 1st 2nd 3rd 4th 1st 2nd 3rd 4th 1st 2nd 3rd 4th 1st 2nd 3rd 4th 1st 2nd 3rd 4th 1st 2nd 3rd 4th 1st 2nd 3rd 4th Colorado Springs Metro Area Northwest Northeast Far Northeast Southeast Security/Widefield/ Fountain Southwest Central Rents are based on units being unfurnished with tenants paying gas and electricity. Average rent minus rental losses equals effective rent. Average rents do not reflect "rental losses" from discounts/concessions, models, delinquents, and bad debts. 14
18 Average Rent by Size of Building (In Dollars) Year Quarter 4th 1st 2nd 3rd 4th 1st 2nd 3rd 4th 1st 2nd 3rd 4th 1st 2nd 3rd 4th 1st 2nd 3rd 4th 1st 2nd 3rd 4th 1st 2nd 3rd 4th 1st 2nd 3rd 4th Colorado Springs Metro Area Building Size 2 to to to to to and up Rents are based on units being unfurnished with tenants paying gas and electricity. Average rent minus rental losses equals effective rent. Average rents do not reflect "rental losses" from discounts/concessions, models, delinquents, and bad debts. 15
19 Average Rent by Age of Building (In Percent) Year Quarter th 1st nd 3rd 4th 1st nd 3rd 4th 1st nd 3rd 4th 1st nd 3rd 4th 1st nd 3rd 4th 1st nd 3rd 4th 1st nd 3rd 4th 1st nd 3rd 4th Colorado Springs Metro Area Building Age To and up Rents are based on units being unfurnished with tenants paying gas and electricity. Average rent minus rental losses equals effective rent. Average rents do not reflect "rental losses" from discounts/concessions, models, delinquents, and bad debts. 16
20 Average Rent by Apartment Type (In Dollars) Market Area 4th 1st 2nd 3rd 4th 1st 2nd 3rd 4th 1st 2nd 3rd 4th 1st 2nd 3rd 4th 1st 2nd 3rd 4th 1st 2nd 3rd 4th 1st 2nd 3rd 4th 1st 2nd 3rd 4th Colorado Springs Metro Area Apartment Type Efficiency One bedroom Two bed, one bath Two bed, two bath Three bedroom Rents are based on the units being unfurnished with tenants paying electricity and gas. Average rents do not reflect "rental losses" from discounts, concessions, models, delinquents, and bad debts. 17
21 Average Rents for the Colorado Springs Metropolitan Area Efficiency 1 Bedroom 2 Bedroom, 1 Bathroom 2 Bedroom, 2 Bathroom Three Bedroom Other All Colorado Springs Market Areas Northwest Northeast Far Northeast Southeast Security/Widefield/Fountain Southwest Central
22 Rent per Square Foot by Apartment Type (In Dollars) Year Quarter 4th 1st 2nd 3rd 4th 1st 2nd 3rd 4th 1st 2nd 3rd 4th 1st 2nd 3rd 4th 1st 2nd 3rd 4th 1st 2nd 3rd 4th 1st 2nd 3rd 4th 1st 2nd 3rd 4th 1st 2nd 3rd 4th 1st 2nd 3rd 4th Colorado Springs Metro Area Apartment Type Efficiency One bedroom Two bedroom, one bath Two bedroom, two bath Three bedroom Rents are based on the units being unfurnished with tenants paying gas and electricity. 19
23 Median Rent by Apartment Type (In Dollars) Market Area Apartment Type th 1st nd 3rd 4th 1st nd 3rd 4th 1st nd 3rd 4th 1st nd 3rd 4th 1st nd 3rd 4th 1st nd 3rd 4th 1st nd 3rd 4th 1st nd 3rd 4th Colorado Efficiency Springs One bedroom Two bed, one bath Two bed, two bath Three bedroom All Northwest Efficiency One bedroom Two bed, one bath Two bed, two bath Three bedroom All Northeast Efficiency One bedroom Two bed, one bath Two bed, two bath Three bedroom All Far Efficiency Northeast One bedroom Two bed, one bath Two bed, two bath Three bedroom All Southeast Efficiency One bedroom Two bed, one bath Two bed, two bath Three bedroom All Security/ Efficiency Widefield/ One bedroom Fountain Two bed, one bath Two bed, two bath Three bedroom All Southwest Efficiency One bedroom Two bed, one bath Two bed, two bath Three bedroom All Central Efficiency One bedroom Two bed, one bath Two bed, two bath Three bedroom All Rents are based on the units being unfurnished with tenants paying electricity and gas. Average rents do not reflect "rental losses" from discounts, concessions, models, delinquents, and bad debts. 20
24 Economic Vacancy Rates by Size, Age and County Defined as Physcial Vacancy Plus Concessions and Discounts as a Percentage of Gross Potential Rent (In Percent) Building Type 4th 1st 2nd 3rd 4th 1st 2nd 3rd 4th 1st 2nd 3rd 4th 1st 2nd 3rd 4th 1st 2nd 3rd 4th 1st 2nd 3rd 4th 1st 2nd 3rd 4th 1st 2nd 3rd 4th Size (in units) Up to to up Age (year built) To up County Northwest Northeast Far Northeast Southeast Security/Widefield/Fountain Southwest Central Average
25 Rental Losses from Discounts and Concessions (In Percent) Building Type 4th 1st 2nd 3rd 4th 1st 2nd 3rd 4th 1st 2nd 3rd 4th 1st 2nd 3rd 4th 1st 2nd 3rd 4th 1st 2nd 3rd 4th 1st 2nd 3rd 4th 1st 2nd 3rd 4th Size (in units) Up to to up Age (year built) To up County Northwest Northeast Far Northeast Southeast Security/Widefield/F Southwest Central Average Prior to first quarter 1998, category was for 1990 up. Prior to first quarter 2002, was 22
APARTMENT MARKET TRENDS
 VOLUME 21 1ST QUARTER 2018 Featuring data from the Center for Business and Economic Research The Las Vegas apartment market saw a slight increase in the average asking rent and an increase the vacancy
Lied Institute Report on Apartment Market Trends featuring data from the Center for Business and Economic Research
 Volume 7, 3 rd Quarter, 2014 Lied Institute Report on featuring data from the Center for Business and Economic Research in 3 rd Quarter 2014 Las Vegas s apartment market saw small quarterly decreases in
INDUSTRIAL QUICK STATS SUMMARY & OUTLOOK MARKET TRENDS VACANCY & NET ABSORPTION ECONOMIC STATS
 PHOENIX, ARIZONA INDUSTRIAL THIRD QUARTER 217 QUICK STATS Direct Vacancy 8.7% Overall Vacancy 9.% Lease Rate NNN $.54 Gross Absorption Under Construction MARKET TRENDS Current Quarter 5,991,128 SF 4,751,494
APARTMENT MARKET TRENDS
 VOLUME 22 2nd QUARTER 2018 Featuring data from the Center for Business and Economic Research The Las Vegas apartment market saw an increase in the average asking rent and a decrease in the vacancy rate
CBER-LIED Report on Housing Market Conditions
 CBER-LIED Report on Housing Market Conditions CBER and Lied Institute Report Volume 62, 1st, Housing Markets Conditions in 1 st Beginning with this issue of the CBER-LIED Report on Housing Market Conditions,
7224 Nall Ave Prairie Village, KS 66208
 Real Results - Income Package 10/20/2014 TABLE OF CONTENTS SUMMARY RISK Summary 3 RISC Index 4 Location 4 Population and Density 5 RISC Influences 5 House Value 6 Housing Profile 7 Crime 8 Public Schools
Lied Institute Report on Apartment Market Trends featuring data from the Center for Business and Economic Research
 Volume 2, 2 nd Quarter, 2013 Lied Institute Report on featuring data from the Center for Business and Economic Research in 2 nd Quarter 2013 Average apartment rental rates in the Las Vegas Valley area
Market Research. OFFICE First Quarter 2010
 colliers international LAS VEGAS, NV Market Research OFFICE First Quarter 2010 Market Indicators Net Absorption Construction Rental Rate Q1-10 Q2-2010 Projected Clark County Economic Data Jan-10 Jan-09
Las Vegas Valley Executive Summary
 ARROYO MARKET SQUARE Las Vegas Valley Executive Summary Retail Market 4th Quarter 2013 THE DISTRICT AT GREEN VALLEY RANCH January 23, 2014 Re: Commercial Real Estate Survey: 4th Quarter, 2013 Dear Reader,
CONTACT. Great Location Within a mile of I-95 on CR210 Adjacent to Twin Creeks DRI: 5,000 homes 2.9 MM office, retail, others
 C O M M E R C I A L L A N D F O R S A L E +/- 1 A C O U T PA R C E L S AVA I L A B L E P R I C E : $ 1 8. 0 0 P E R S Q. F T. C O U N T Y R O A D 2 1 0 W E S T S T. J O H N S C O U N T Y J A C K S O N
GB Ridgepointe Investors, LLC
 Buck Blessing buck@gb85.com Steve Engel steve@gb85.com Gary Winegar gary@gb85.com BJ Hybl bj@gb85.com Dave Bunkers dave@gb85.com 102 N. Cascade Avenue Suite 550 Colorado Springs, CO 80903 Operations &
APARTMENT MARKET TRENDS
 VOLUME 23 3rd QUARTER 2018 Featuring data from the Center for Business and Economic Research The Las Vegas apartment market saw a slight increase in the average asking rent and an increase in the vacancy
quarter andd Figure % (2009 Q3) 15.68% Drop $741 (2013 Q1) Average Vacancy Rate (%) Average Rent
 15.68% Drop $741 (2013 Q1) Average Vacancy Rate (%) Average Rent") Lied Institute Report on featuring data from the Center for Business Economic Research Volume 17, 1 st Quarter, 2017 in 1 st Quarter 2017 The Las Vegas apartment market saw a slight increase in the average
Lied Institute Report on featuring data from the Center for Business Economic Research Volume 17, 1 st Quarter, 2017 in 1 st Quarter 2017 The Las Vegas apartment market saw a slight increase in the average
the Center percent). Rent Q Greater than 1050
. Rent Q Greater than 1050") Lied Institute Report on featuring data from the Center for Business Economic Research Volume 8, 4 th Quarter, 2014 in 4 th Quarter 2014 The Las Vegas apartment market saw a slight decrease in asking rents
Lied Institute Report on featuring data from the Center for Business Economic Research Volume 8, 4 th Quarter, 2014 in 4 th Quarter 2014 The Las Vegas apartment market saw a slight decrease in asking rents
OFFICE QUICK STATS SUMMARY & OUTLOOK MARKET TRENDS VACANCY & NET ABSORPTION ECONOMIC STATS
 LOS ANGELES SAN GABRIEL VALLEY OFFICE SECOND QUARTER 218 QUICK STATS Direct Vacancy 11.1% Overall Vacancy 11.4% Lease Rate FSG $2.32 Gross Absorption Under Construction MARKET TRENDS Current Quarter 345,68
OFFICE QUICK STATS SUMMARY & OUTLOOK MARKET TRENDS VACANCY & NET ABSORPTION ECONOMIC STATS
 LOS ANGELES CENTAL/SOUTHEAST OFFICE THIRD QUARTER 218 QUICK STATS Direct Vacancy 14.7% Overall Vacancy 15.2% Lease Rate FSG $3.16 Gross Absorption Under Construction MARKET TRENDS Change from Last Quarter
asking rent and the average asking rent
 Lied Institute Report on featuring data from the Center for Business Economic Research Volume 15, 3 rd Quarter, 2016 in 3 rd Quarter 2016 The Las Vegas apartment market saw an increase in the average asking
OFFICE QUICK STATS SUMMARY & OUTLOOK MARKET TRENDS VACANCY & NET ABSORPTION ECONOMIC STATS
 LOS ANGELES NORTH OFFICE FOURTH QUARTER 217 QUICK STATS Direct Vacancy 11.8% Overall Vacancy 12.5% Lease Rate FSG $2.75 Gross Absorption Under Construction MARKET TRENDS Current Quarter 1,6,941 SF 89,158
Upstate, SC 2Q17. Industrial Market Report. Q2 Industrial. Upstate Economy in 2Q17* Industrial Sector in 2Q17. Trends for 2Q17
 Upstate, SC 2Q17 Industrial Market Report The industrial market for the Upstate of South Carolina saw continued growth for the second quarter of 217. While there was a positive net absorption of 67,53
Las Vegas. in 2006Q11 (4.5%).
.") Lied Institute Report on featuring data from the Center for Business Economic Research Volume 13, 1 st Quarter, 2016 in 1 st Quarter 2016 The Las Vegas apartment market saw a slight increase in the average
Lied Institute Report on featuring data from the Center for Business Economic Research Volume 13, 1 st Quarter, 2016 in 1 st Quarter 2016 The Las Vegas apartment market saw a slight increase in the average
INDUSTRIAL QUICK STATS SUMMARY & OUTLOOK MARKET TRENDS VACANCY & NET ABSORPTION ECONOMIC STATS
 VENTURA COUNTY INDUSTRIAL FOURTH QUARTER 217 QUICK STATS Direct Vacancy 2.1% Overall Vacancy 2.4% Lease Rate NNN $.7 Gross Absorption Under Construction MARKET TRENDS Current Quarter 1,332,957 SF 774,362
Las Vegas Housing-Market Conditions
 Las Vegas Housing-Market Conditions The Center for Business and Economic Research Las Vegas Housing Market Searching for Bottom Volume 57, 4th The national housing market remained beset with problems in.
Landing Pointe Apartments
 2417 W. Campbell Ave. Investment Property Offering A 24 Unit Apartment Complex Located in Phoenix, Arizona Bill Hahn Senior Vice President 602 222 5105 Direct 602 418 9578 Mobile bill.hahn@colliers.com
INDUSTRIAL QUICK STATS SUMMARY & OUTLOOK MARKET TRENDS VACANCY & NET ABSORPTION ECONOMIC STATS. Current Quarter. Direct Vacancy 2.
 ORANGE COUNTY INDUSTRIAL SECOND QUARTER 218 QUICK STATS Direct Vacancy 2.2% Overall Vacancy 2.5% Lease Rate NNN $.95 Gross Absorption Under Construction MARKET TRENDS Current Quarter 2,956,71 SF 1,367,18
MONTGOMERY COUNTY JULY 2018
 STATPAK MONTGOMERY COUNTY JULY 2018 McEnearney.com MARKET IN A MINUTE A SUMMARY OF MARKET CONDITIONS FOR JUNE & FIRST HALF 2018 Contract activity in June 2018 was up 1.2% from June 2017, solely because
MARKET SUMMARY MICHIGAN, METRO DETROIT AREA FOURTH QUARTER 2016 P LAN T E M OR AN CRES A. pmcresa.com
 FOURTH QUARTER 2016 MICHIGAN, METRO DETROIT AREA MARKET SUMMARY P LAN T E M OR AN CRES A 26300 NORTHWESTERN HIGHWAY SOUTHFIELD, MI 48076 248.223.3500 pmcresa.com Connect with us for more information: Subscribe
OFFICE QUICK STATS SUMMARY & OUTLOOK MARKET TRENDS VACANCY & NET ABSORPTION ECONOMIC STATS
 ORANGE COUNTY OFFICE THIRD QUARTER 217 QUICK STATS Direct Vacancy 12.1% Overall Vacancy 12.9% Lease Rate FSG $2.61 Gross Absorption Under Construction MARKET TRENDS Current Quarter 2,479,293 SF 379, SF
INDUSTRIAL QUICK STATS SUMMARY & OUTLOOK MARKET TRENDS VACANCY & NET ABSORPTION ECONOMIC STATS
 ORANGE COUNTY INDUSTRIAL FOURTH QUARTER 217 QUICK STATS Direct Vacancy 2.3% Overall Vacancy 2.7% Lease Rate NNN $.91 Gross Absorption Under Construction MARKET TRENDS Current Quarter 4,283,991 SF 963,138
MONTGOMERY COUNTY MAY 2018
 STATPAK MONTGOMERY COUNTY MAY 2018 McEnearney.com MARKET IN A MINUTE A SUMMARY OF MARKET CONDITIONS FOR APRIL 2018 Contract activity in April 2018 was up just 0.9% from, but there were increases in four
OFFICE QUICK STATS SUMMARY & OUTLOOK MARKET TRENDS VACANCY & NET ABSORPTION ECONOMIC STATS
 INLAND EMPIRE OFFICE THIRD QUARTER 217 QUICK STATS Direct Vacancy 11.4% Overall Vacancy 11.7% Lease Rate FSG $1.83 Gross Absorption Under Construction MARKET TRENDS Current Quarter 529,634 SF 45,24 SF
CONTENTS. Executive Summary 1. Southern Nevada Economic Situation 2 Household Sector 5 Tourism & Hospitality Industry
 CONTENTS Executive Summary 1 Southern Nevada Economic Situation 2 Household Sector 5 Tourism & Hospitality Industry Residential Trends 7 Existing Home Sales 11 Property Management Market 12 Foreclosure
STATPAK MARKET IN A MINUTE A SUMMARY OF MARKET CONDITIONS FOR JANUARY McEnearney.com CONTRACTS URGENCY INDEX INVENTORY INTEREST RATES
 STATPAK LOUDOUN COUNTY FEBRUARY 2018 McEnearney.com MARKET IN A MINUTE A SUMMARY OF MARKET CONDITIONS FOR JANUARY 2018 Contract activity in January 2018 was down just 2.0% from January 2017, but that is
INDUSTRIAL QUICK STATS SUMMARY & OUTLOOK MARKET TRENDS VACANCY & NET ABSORPTION ECONOMIC STATS. Current Quarter. Direct Vacancy 2.
 LOS ANGELES NORTH INDUSTRIAL THIRD QUARTER 218 QUICK STATS Direct Vacancy 2.3% Overall Vacancy 2.6% Lease Rate NNN $1.1 Gross Absorption Under Construction MARKET TRENDS Current Quarter 1,632,564 SF 595,199
3 RD QUARTER 2016 RICHMOND INDUSTRIAL MARKET REPORT
 3 RD QUARTER 2016 RICHMOND INDUSTRIAL MARKET REPORT FORECAST The Richmond Industrial market continued trending in the positive direction in the third quarter, with the absorption of over 320,000 square
16 UNIT MULTI-FAMILY PORTFOLIO LOS ANGELES, CALIFORNIA
 16 UNIT MULTI-FAMILY PORTFOLIO 9206 S. Hoover St Los Angeles, CA 90044 Stabilized Portfolio Recent Rehab All Units (2010 2012) Very Low Vacancy Section 8 Units (10 of 16) Offer Excellent Income Stream
3 RD QUARTER 2015 RICHMOND INDUSTRIAL MARKET REPORT
 3 RD QUARTER FORECAST As the U.S. economy continued to show positive economic growth through the third quarter, the Richmond, VA Industrial market saw demand for warehouse and flex properties increase
OFFICE QUICK STATS SUMMARY & OUTLOOK MARKET TRENDS VACANCY & NET ABSORPTION ECONOMIC STATS
 VENTURA COUNTY OFFICE THIRD QUARTER 217 QUICK STATS Direct Vacancy 13.9% Overall Vacancy 14.3% Lease Rate FSG $2.25 Gross Absorption Under Construction MARKET TRENDS Current Quarter 34,43 SF 18,112 SF
STATPAK MARKET IN A MINUTE A SUMMARY OF MARKET CONDITIONS FOR FEBRUARY McEnearney.com CONTRACTS URGENCY INDEX INVENTORY INTEREST RATES
 STATPAK LOUDOUN COUNTY MARCH 2018 McEnearney.com MARKET IN A MINUTE A SUMMARY OF MARKET CONDITIONS FOR FEBRUARY 2018 Contract activity in February 2018 was almost unchanged, up just 0.2% from February
San Fernando Valley and Ventura County Witness Declining Vacancy
 OFFICE SAN FERNANDO & VENTURA MARKET REPORT San Fernando Valley and Ventura County Witness Declining MARKET OVERVIEW The San Fernando Valley and Ventura County office market saw total vacancy decrease
Multifamily Stable and Expanding
 Research & Forecast Report LAS VEGAS MULTIFAMILY Q3 2017 Multifamily Stable and Expanding > > Multifamily vacancy decreased to 3.0 percent in the second quarter of 2017 Economic Indicators > > No new projects
Office Stays Positive
 Q2 2014 OFFICE LAS VEGAS NEVADA RESEARCH & FORECAST REPORT Office Stays Positive While it may not always be pretty, Southern Nevada s office market continues to improve. Net absorption increased in the
CoStar Office Statistics. Y e a r - E n d Denver Office Market
 CoStar Office Statistics Y e a r - E n d 2 0 1 6 Year-End 2016 Denver Table of Contents Table of Contents................................................................. A Methodology......................................................................
MONTGOMERY COUNTY JANUARY 2019 MARKET IN A MINUTE A SUMMARY OF MARKET CONDITIONS FOR DECEMBER & 4TH QUARTER 2018
 STATPAK MONTGOMERY COUNTY JANUARY 2019 McEnearney.com MARKET IN A MINUTE A SUMMARY OF MARKET CONDITIONS FOR DECEMBER & 4TH QUARTER 2018 Contract activity in December 2018 was down 10.1% from December 2017
Shadow inventory in Texas
 With the national and local real estate markets turning positive, questions remain about the shadow inventory that was supposed to be holding down the market. Concerns over shadow inventory re-entering
Single Family Sales Maine: Units
 Maine Home Connection 19 Commercial St Portland, Maine 04101 MaineHomeConnection.com Office: (207) 517-3100 Email: Info@MaineHomeConnection.com For the fourth consecutive year, Maine home sales set a new
FOR SALE $350,000 $300,000
 MEDICAL OFFICE CONDO 4123 UNIVERSITY BLVD. S, UNIT E JACKSONVILLE, FL 32216 FEATURES GREAT LOCATION CONVENIENTLY LOCATED ON UNIVERSITY BOULEVARD IN CLOSE PROXIMITY TO MEMORIAL HOSPITAL +/- 1,842 SQ. FT.
CoStar Office Statistics. M i d - Y e a r Denver Office Market
 CoStar Office Statistics M i d - Y e a r 2 0 1 7 Mid-Year 2017 Denver Table of Contents Table of Contents................................................................. A Methodology......................................................................
Negative Absorption And Sharp Rise In Total Vacancy to Begin 2014
 OFFICE TRI-CITIES MARKET REPORT Negative Absorption And Sharp Rise In Total to Begin 214 MARKET OVERVIEW MARKET INDICATORS - VACANCY 19.4% NET ABSORPTION -154,9 CONSTRUCTION 155, RENTAL RATE $2.63 P UNEMPLOYMENT
Denver s Retail Sector Keeps Rolling 500, , , , , , , , ,000 50,000. Square Feet
 Research & Forecast Report METRO DENVER RETAIL Q4 2017 s Retail Sector Keeps Rolling Market Overview Net absorption finished the second half of 2017 with strong positive numbers from s Central and Northwest
The Impact of Market Rate Vacancy Increases One Year Report
 The Impact of Market Rate Vacancy Increases One Year Report January 1, 1999- December 31, 1999 Santa Monica Rent Control Board TABLE OF CONTENTS Summary 2 Market Rent Increases 1/1/99-12/31/99 4 Rates
126 BONITO AVENUE LONG BEACH, CA 90802
 LONG BEACH, CA 90802 MULTI-FAMILY INVESTMENTS For more information please contact: LONG BEACH, CA 90802 Sale Price: $1,575,000 Sale Price/SF: $434.48 Sale Price/Unit: $393,750 Rentable SF: 3,625 SF Lot
Time for Retail to Take Stock
 Q1 2013 RETAIL LAS VEGAS NEVADA RESEARCH & FORECAST REPORT Time for Retail to Take Stock It is heartening to say, after five years of a bad economy, that the first quarter of 2013 s 119,649 square feet
Office Market Continues to Improve
 Research & Forecast Report LAS VEGAS OFFICE Q3 2016 Office Market Continues to Improve > > Southern Nevada s office market is improving at a steady rate > > Net absorption has been positive in twelve of
Trends. Trends in Condominiums, Co-Ops and PUDs. Condominium Summary
 in Condominiums, Co-Ops and PUDs THE SAMPLE This 2012 edition reflects 2011 financial data from 2,062 properties in the United States and Canada, representing 264,084 units. Table 1 breaks down the sample
CoStar Office Statistics. F i r s t Q u a r t e r Colorado Springs Office Market
 CoStar Office Statistics F i r s t Q u a r t e r 2 0 1 7 First Quarter 2017 Colorado Springs Table of Contents Table of Contents................................................................. A Methodology......................................................................
16 UNIT MULTI-FAMILY PORTFOLIO LOS ANGELES, CALIFORNIA
 16 UNIT MULTI-FAMILY PORTFOLIO 9206 S. Hoover St Los Angeles, CA 90044 Stabilized Portfolio Recent Rehab circa. 2010 2012 (12 of 16 units) Very Low Vacancy Section 8 Offers Excellent Income Stream (11
MONTGOMERY COUNTY APRIL 2018
 STATPAK MONTGOMERY COUNTY APRIL 2018 McEnearney.com MARKET IN A MINUTE A SUMMARY OF MARKET CONDITIONS FOR MARCH 2018 Contract activity in March 2018 was down 6.0% from March 2017, and there were decreases
2.8% 2.0% $811M. 2017: A Solid Year for the Metro Denver Office Sector HIGHLIGHTED METRO DENVER OFFICE. Market Report Q ECONOMIC TRENDS
 Market Report METRO DENVER OFFICE Q4 2017 2017: A Solid Year for the Metro Denver Office Sector MARKET OVERVIEW Denver s office market finished 2017 with strong positive absorption during the fourth quarter
STATPAK MARKET IN A MINUTE A SUMMARY OF MARKET CONDITIONS FOR OCTOBER McEnearney.com CONTRACTS URGENCY INDEX INVENTORY INTEREST RATES
 STATPAK LOUDOUN COUNTY NOVEMBER 2018 McEnearney.com MARKET IN A MINUTE A SUMMARY OF MARKET CONDITIONS FOR OCTOBER 2018 Contract activity in October 2018 was down 7.6% from last October and was down in
Pikes Peak area housing Market Statistics (As of: 2/28/2018)
") Jan-1-1 -1-1 Jan-2-2 -2-2 Jan-3-3 -3-3 -4-4 -4-5 -5-5 -6-6 -6-7 -7-7 -8-8 -8-9 -9-9 -1-1 -1-11 -11-11 -12-12 -12-13 -13-13 -14-14 -14-15 -15-15 -16-16 -16-17 -17-17 Jan-1-1 -1-1 Jan-2-2 -2-2 Jan-3-3 -3-3
Jan-1-1 -1-1 Jan-2-2 -2-2 Jan-3-3 -3-3 -4-4 -4-5 -5-5 -6-6 -6-7 -7-7 -8-8 -8-9 -9-9 -1-1 -1-11 -11-11 -12-12 -12-13 -13-13 -14-14 -14-15 -15-15 -16-16 -16-17 -17-17 Jan-1-1 -1-1 Jan-2-2 -2-2 Jan-3-3 -3-3
WASHINGTON STATE APARTMENT MARKET REPORT SPRING 2018
 WASHINGTON STATE APARTMENT MARKET REPORT SPRING 2018 Vacancy Summary The statewide apartment vacancy rate increased from 3.7% to 4.7% in Fall 2018. While there is variability among the individual county
San Fernando Valley & Ventura County End 2015 On A Positive Note
 OFFICE SAN FERNANDO & MARKET REPORT San Fernando Valley & Ventura County End 2015 On A Positive Note MARKET OVERVIEW MARKET INDICATORS - VACANCY 15.4% NET ABSORPTION 74,400 CONSTRUCTION 120,933 RENTAL
STATPAK MARKET IN A MINUTE A SUMMARY OF MARKET CONDITIONS FOR JUNE & FIRST HALF McEnearney.com CONTRACTS URGENCY INDEX INVENTORY INTEREST RATES
 STATPAK LOUDOUN COUNTY JULY 2018 McEnearney.com MARKET IN A MINUTE A SUMMARY OF MARKET CONDITIONS FOR JUNE & FIRST HALF 2018 Contract activity in June 2018 was up 5.1% from June 2017. Through the first
RESEARCH & FORECAST REPORT
 Q3 2012 OFFICE LAS VEGAS NEVADA RESEARCH & FORECAST REPORT Office Forges Ahead Southern Nevada s office market continued to post positive net absorption in the third quarter of 2012, despite weak employment
MARKET IN A MINUTE A SUMMARY OF MARKET CONDITIONS FOR SEPTEMBER & 3rd QUARTER 2017
 STATPAK LOUDOUN COUNTY OCTOBER 2017 McEnearney.com MARKET IN A MINUTE A SUMMARY OF MARKET CONDITIONS FOR SEPTEMBER & 3rd QUARTER 2017 Contract activity in September 2017 was up just 0.6% from September
Pikes Peak area housing Market Statistics (As of: 9/30/2018)
") $156,25 $184, $174,697 $177,2 $21,53 $185,83 $173, $178,29 $172,25 $212,75 $21,95 $226,692 $197,5 $199, $196, $28, $25, $223,95 $216,75 $29,527 $234,9 $218,82 $229,74 $235,518 $231,457 $255, $259,11 $269,98
$156,25 $184, $174,697 $177,2 $21,53 $185,83 $173, $178,29 $172,25 $212,75 $21,95 $226,692 $197,5 $199, $196, $28, $25, $223,95 $216,75 $29,527 $234,9 $218,82 $229,74 $235,518 $231,457 $255, $259,11 $269,98
Minneapolis St. Paul Residential Real Estate Index
 University of St. Thomas Minneapolis St. Paul Residential Real Estate Index Welcome to the latest edition of the UST Minneapolis St. Paul Residential Real Estate Index. The University of St Thomas Residential
NORTHERN VIRGINIA NOVEMBER 2017
 STATPAK NORTHERN VIRGINIA NOVEMBER 2017 McEnearney.com MARKET IN A MINUTE A SUMMARY OF MARKET CONDITIONS FOR OCTOBER 2017 Contract activity in October 2017 was up 3.8% from October 2016, and there were
HISTORICAL VACANCY VS RENTS. Downtown Los Angeles Office Market Q Q RENTS VACANCY $31 2Q10 2Q11 2Q12 2Q13 2Q14
 www.colliers.com/losangeles OFFICE LOS ANGELES MARKET REPORT Rate Decrease Below 20% As Market Activity Remains Flat MARKET OVERVIEW MARKET INDICATORS - VACANCY 19.5% The Downtown Los Angeles market in
WISCONSIN HOUSING MARKETPLACE
 WISCONSIN REALTORS ASSOCIATION WISCONSIN HOUSING MARKETPLACE Date: 2/16/06 For Release: Immediately For More Information Contact: David E. Clark, Economist C3 Statistical Solutions Inc. Office phone: 414-803-6537
INDUSTRIAL QUICK STATS SUMMARY & OUTLOOK MARKET TRENDS VACANCY & NET ABSORPTION ECONOMIC STATS
 INLAND EMPIRE INDUSTRIAL FOURTH QUARTER 217 QUICK STATS Direct Vacancy 5.1% Overall Vacancy 5.3% Lease Rate NNN $.57 Gross Absorption Under Construction MARKET TRENDS Current Quarter 9,23,744 SF 16,31,563
Los Angeles Basin Retail Market Witnessed A Slight Increase In Vacancy Rates
 RETAIL GREATER LOS ANGELES BASIN MARKET REPORT Witnessed A Slight Increase In Vacancy Rates MARKET INDICATORS - VACANCY 6.2% NET ABSORPTION -551,200 CONSTRUCTION 1,946,000 RENTAL RATE $1.96 P NNN UNEMPLOYMENT
MARKET IN A MINUTE A SUMMARY OF MARKET CONDITIONS FOR MARCH & 1st QUARTER 2016
 STATPAK ` WASHINGTON, DC APRIL 2016 MARKET IN A MINUTE A SUMMARY OF MARKET CONDITIONS FOR MARCH & 1st QUARTER 2016 Contract activity in March 2016 was up 12.6% from March of 2015, and there were increases
Market Research. Market Indicators
 colliers international LAS VEGAS, NV Market Research OFFICE Third Quarter 2009 Market Indicators Net Absorption Construction Rental Rate Q3-09 Q4-2009 Projected Clark County Economic Data Jul-09 Jul-08
717 EAST 1ST STREET LONG BEACH, CA 90802
 LONG BEACH, CA 90802 MULTI-FAMILY INVESTMENTS LONG BEACH, CA 90802 Sale Price: $1,249,000 Sale Price/SF: $319.93 Sale Price/Unit: $312,250 Rentable SF: 3,904 SF Lot Size SF: 7,511 SF Units: 4 Floors: 2
2Q 16. Long Island Market Report
 2Q 16 Long Island Market Report Long Island Office 2Q 216 Long Island 2Q16 Office Office Report The Long Island Office market ended the second quarter 216 with a vacancy rate of 7.5%. The vacancy rate
2. The, and Act, also known as FIRREA, requires that states set standards for all appraisers.
 CHAPTER 4 SHORT-ANSWER QUESTIONS 1. An appraisal is an or of value. 2. The, and Act, also known as FIRREA, requires that states set standards for all appraisers. 3. Value in real estate is the "present
Quarterly Housing Market Update
 Quarterly Housing Market Update An Overview New Hampshire s current housing market performance, as well as its overall economy, is slowly improving, with positives such as increasing employment and rising
APARTMENT SURVEY 1 ST QUARTER 2016 DATA RENO/SPARKS METRO AREA PRESENTED BY JOHNSON PERKINS GRIFFIN, LLC PUBLISHED ON
 APARTMENT SURVEY 1 ST QUARTER 2016 DATA RENO/SPARKS METRO AREA PRESENTED BY JOHNSON PERKINS GRIFFIN, LLC PUBLISHED ON APRIL 20, 2016 TABLE OF CONTENTS STATEMENT OF METHODOLOGY... 1 ECONOMIC OUTLOOK...
NEVADA HOUSING MARKET UPDATE
 NEVADA HOUSING MARKET UPDATE A MONTHLY REPORT FROM THE LIED INSTITUTE FOR REAL ESTATE STUDIES Photo Credit: City of Henderson Location: Silver Springs TABLE OF CONTENTS LAS VEGAS METROPOLITAN AREA TRENDS...
PRINCE GEORGE S COUNTY AUGUST 2018
 STATPAK PRINCE GEORGE S COUNTY AUGUST 2018 McEnearney.com MARKET IN A MINUTE A SUMMARY OF MARKET CONDITIONS FOR JULY 2018 Contract activity in July 2018 was up 19.7% from July 2017, and through the first
American Community Survey 5-Year Estimates
 DP04 SELECTED HOUSING CHARACTERISTICS 2011-2015 American Community Survey 5-Year Estimates Note: This is a modified view of the original table. Supporting documentation on code lists, subject definitions,
Real Estate Investment Analysis
 Real Estate Investment Analysis July 6, 2018 SJ Fowler Real estate 4574 N 1st Ave #0 Tucson AZ 85718 David Walsh 520-591-1736 dw.sjfowler@gmail.com Property Photos, Main Property Photo Property Photos,
STATPAK MARKET IN A MINUTE A SUMMARY OF MARKET CONDITIONS FOR JULY McEnearney.com CONTRACTS URGENCY INDEX INVENTORY INTEREST RATES AFFORDABILITY
 STATPAK LOUDOUN COUNTY AUGUST 2017 McEnearney.com MARKET IN A MINUTE A SUMMARY OF MARKET CONDITIONS FOR JULY 2017 Contract activity in July 2017 was down 8.7% from July 2016, and there were decreases in
RESEARCH & FORECAST REPORT
 Q2 2012 OFFICE LAS VEGAS NEVADA RESEARCH & FORECAST REPORT Recovery Without Job Growth? Despite office employment still trending downwards, Southern Nevada s office market posted positive net absorption
2Q 17. Long Island Market Report
 2Q 17 Long Island Market Report Long Island Office 2Q 217 Long Island 2Q17 Office Office Report The Long Island Office market ended the second quarter 217 with a vacancy rate of 7.2%. The vacancy rate
Minneapolis St. Paul Residential Real Estate Index
 University of St. Thomas Minneapolis St. Paul Residential Real Estate Index Welcome to the latest edition of the UST Minneapolis St. Paul Residential Real Estate Index. The University of St Thomas Residential
REQUEST FOR QUALIFICATIONS
 A partnership among the Apartment Association of Metro Denver, Denver Housing Authority, Downtown Denver Partnership, and the City and County of Denver Table of Contents REQUEST FOR QUALIFICATIONS Introduction...
Medical Takes a Sick Quarter
 Research & Forecast Report LAS VEGAS MEDICAL OFFICE Q3 2015 Medical Takes a Sick Quarter > > After two quarters of growth, the medical real estate sector stalled in the third quarter of 2015 > > Asking
Economic Overview DENVER INDUSTRIAL/FLEX MARKET MONITOR FIRST QUARTER Denver s industrial flex market vibrant during the first quarter.
 Economic Overview DENVER INDUSTRIAL/FLEX MARKET MONITOR FIRST QUARTER 2015 Denver s industrial flex market vibrant during the first quarter. The Denver industrial market has record high asking rental rates,
American Community Survey 5-Year Estimates
 DP04 SELECTED HOUSING CHARACTERISTICS 2006-2010 American Community Survey 5-Year s Supporting documentation on code lists, subject definitions, data accuracy, and statistical testing can be found on the
Positive Net Absorption Recorded For The Ninth Consecutive Quarter
 OFFICE SAN FERNANDO & VENTURA MARKET REPORT Positive Net Absorption Recorded For The Ninth Consecutive Quarter MARKET OVERVIEW MARKET INDICATORS - VACANCY 15.2% NET ABSORPTION 116,700 CONSTRUCTION 120,933
Strong Absorption Drives Down Vacancy to Start 2017
 Research & Forecast Report GREATER PHOENIX INDUSTRIAL 2017 Strong Absorption Drives Down to Start 2017 Key Takeaways >> Industrial vacancy in Greater Phoenix dipped below 10 percent in the first quarter,
Research. New product, high rents CLEVELAND 1Q16 INDUSTRIAL MARKET. Current Conditions
 New product, high rents The Greater Cleveland industrial market absorbed 556,046 square feet in the first quarter of 2016, the 14th consecutive quarter of positive tenancy gains for the market. The positive
MARKET AREA UPDATE Report as of: 1Q 2Q 3Q 4Q
 MARKET AREA UPDATE Report as of: 1Q 2Q 3Q 4Q Year: 2013 Market Area (City, State): Arlington, Virginia Provided by (Company / Companies): McEnearney Associates, Inc. Realtors What are the most significant
Quarterly Market Report
 HOUSTON OFFICE JANUARY 2018 EXECUTIVE SUMMARY Office Market Shows Signs of Improvement Houston s overall vacancy rate remained relatively unchanged at 20.7% in, a decrease of 10 basis points quarter-over-quarter,
American Community Survey 5-Year Estimates
 DP04 SELECTED HOUSING CHARACTERISTICS 2007-2011 American Community Survey 5-Year Estimates Supporting documentation on code lists, subject definitions, data accuracy, and statistical testing can be found
Residential December 2009
 Residential December 2009 Karl L. Guntermann Fred E. Taylor Professor of Real Estate Adam Nowak Research Associate Year End Review The dramatic decline in Phoenix house prices caused by an unprecedented
RENTAL MARKET REPORT. Manitoba Highlights* Highlights. Housing market intelligence you can count on
 H o u s i n g M a r k e t I n f o r m a t i o n RENTAL MARKET REPORT Highlights* C a n a d a M o r t g a g e a n d H o u s i n g C o r p o r a t i o n Date Released: Spring 2012 Figure 1 Winnipeg CMA Brandon
NORTHERN VIRGINIA MARCH 2017
 STATPAK NORTHERN VIRGINIA MARCH 2017 McEnearney.com MARKET IN A MINUTE A SUMMARY OF MARKET CONDITIONS FOR FEBRUARY 2017 Contract activity in February 2017 was up 4.0% from February 2016, and there were