Manhattan Brooklyn Queens Change. Change
|
|
|
- Brian Douglas
- 6 years ago
- Views:
Transcription
1 The 2012 Mid-year Triboro Rental Report Overview: This report continues the collaboration between StreetEasy.com, On-Site, and Nancy Packes, Inc, to produce the Triboro Rental Report. We continue to document the most important story in the rental market: the evolving relationship between Manhattan, Brooklyn and Queens, in terms of who the renters are, and how rents reflect these trends. The chart below shows growth by unit type in all three boroughs. Overall, Brooklyn and Queens have seen the strongest increase in rents during the past year for studios through two bedroom units. This is not surprising, given that several rapidly gentrifying neighborhoods in Brooklyn, such as DUMBO and Williamsburg, are contributing to an explosion in rent appreciation. While Queens may currently lack the draw of chic neighborhoods, the ascent of Long Island City and Hunter s Point, coupled with a significant amount of new development currently being planned in Astoria, puts the borough in good position to continue these robust increases in the coming years. Manhattan Brooklyn Queens Studio $2,457 $2, $1,954 $2, $1,697 $2, N $1,807 $1, $1,584 $1, $1,132 $1, One Bedroom $3,429 $3, $2,596 $2, $2,446 $2, N $2,448 $2, $1,935 $2, $1,427 $1, Two Bedrooms $5,574 $5, $3,410 $4, $2,984 $3, N $3,388 $3, $2,757 $2, $1,810 $2, s in Preference: The strong rent growth, particularly in Brooklyn, is in part attributable to new hires in entry level positions, but comes at the expense of Manhattan rental buildings. The most vulnerable sector of the Manhattan market to outer borough competition is shown in the charts below. These three charts show growth in rents since 2011, when the market began to emerge from the post-lehman doldrums. More importantly, they also show the changes in the *Note: All 2011 figures, save for the On-Site and pipeline statistics, are derived from data from the first two quarters of 2011
2 proportions of unit types available in each year; this factor serves as the entry point for the story of the relationship among the boroughs. Manhattan Rent Volume Distribution (in Distribution) STU- STU- N 1BR- 1BR- N 2BR- 2BR- N $2,457 $2, , $1,807 $1, , $3,429 $3, ,801 3, $2,448 $2, ,621 1, $5,574 $5, ,332 1, $3,388 $3, , Brooklyn Rent Volume Distribution (in Distribution) STU- STU- N 1BR- 1BR- N 2BR- 2BR- N $1,954 $2, $1,584 $1, $2,596 $2, $1,935 $2, ,128 1, $3,410 $4, $2,757 $2, ,196 1,
3 Queens Rent Volume Distribution (in Distribution) STU- STU- N 1BR- 1BR- N 2BR- 2BR- N $1,697 $2, $1,132 $1, $2,446 $2, $1,427 $1, $2,984 $3, $1,810 $2, After two years of strong rent growth in Manhattan, about 5 annually, rents in the first half of 2012 in attended buildings in Manhattan grew 7.93 for studios, 3.74 for one bedroom units and 3.65 for two bedroom units. It is not surprising that rent growth was stronger for the smaller sizes for two reasons. First, as the economy continues to regain jobs lost in the last downturn, most new hires are at the entry level for financial analysts and attorneys. Second, with rising rents and little income inflation, renters often seek smaller homes to bridge the gap with rising rents. What is revealing is the proportion of unit types available in the first half of this year and how this has changed from past years. The above charts show this change in distribution, that is the proportion of available units during the first half of 2012 compared to the recent past. Studios increased by almost 11, while one and two bedroom units decreased in availability by more than 5. With very little new housing construction, it is not the composition of units built that is changing these proportions and, even in the most robust year for new construction, the existing housing stock is too voluminous to produce this shift. Further, if this change were caused by new construction, one bedroom availability would have increased, instead of decreasing, as this unit type generally comprises double the percentage of studios in a new building. No, the increase in the percentage of studios available in Manhattan in the first half of 2012 was the result of renters not renewing their leases, causing these units to be placed back on the market.
4 Typically, studio renters earn the least and pay the most towards rent. After two years of substantial increases, many of these renters could not afford any more hikes, and with the alternatives offered in Brooklyn and Queens, they chose not to renew. This move is highlighted in the outer borough studio and two bedroom categories, where significant increases in rent (15.9 and 22 for Brooklyn doorman studios and twos; 22.2 and 11.1 for Queens doorman studios and twos) and dwindling vacancies in both, indicate that those leaving Manhattan are either snapping up cheaper studio apartments, or pairing up with a roommate to take advantage of the less expensive two bedrooms. This is further substantiated by the fact that one bedrooms had growth that was more modest in both boroughs (10.2 for Brooklyn, 5.6 for Queens). The studio renter is typically younger and, for them, the outer boroughs are chic and cheap. Even though the rent gap has diminished greatly over the last few years between Manhattan, Brooklyn and Queens, homes are still substantially more affordable in the outer boroughs. The basic fact is that all three boroughs tap the same pool of renters. Why renters choose one location or the other is a large part of this story. For studio renters, the inclination is clearly turning away from Manhattan attended lobby or luxury rentals. Where it benefits Manhattan is in the unattended housing stock. This can be seen in the strongly rising rents for this part of the Manhattan market, as well as the moderate changes in unit type availability in the first half of the year. It also shows how timely and insightful the mayor s recent proposal is to promote smaller and more affordable studios: For one and two bedroom Manhattan renters, the decrease of 5.3 and 5.6, respectively, in available units during the first half of 2012 means more renters renewed, decreasing the supply of units that came to market. Renewals typically track the increases in market rent seen in re-rentals, so the decision to renew in Manhattan for these larger and more expensive homes indicates the renter found no desirable alternatives in Manhattan and rejected the choice of the outer boroughs. Of course, Manhattan has many neighborhoods and different rent levels. This older and more affluent demographic is demonstrating the preference for more established and expensive areas. Where Brooklyn and Queens are competing most strongly for Manhattan renters is in the less pricey neighborhoods where value is a key reason for renting rather than the environment of an established residential area. Brooklyn and Queens are also competing strongly in the new growth industries of creative and technology.
5 On-Site.com Statistics: On-Site is the leading provider of leasing management software for the apartment business in New York. Jake Harrington, CEO of On-Site, has provided the following analysis of emerging demographic trends in the three boroughs: Manhattan Employment Distribution 2006 to (YTD) Finance Creative Tech Law Medicine Student Wall Street vs. Creative/Tech Share of Employment in Manhattan
6 Analysis New York City continues to attract a more diverse profile of businesses than in previous years. We have been tracking the industries in which renters work for the last decade. Over the last six years, the gap between financial sector jobs and those in creative and technology has narrowed: Wall Street jobs have fallen 25 while creative/tech has risen 65. In terms of technology companies, giants like Google, Apple and Salesforce.com have established beachheads in New York. But start-ups, too, have flocked to the area, due in part to its proximity to financing: in the last five years over 1000 web-based tech startups emerged in NYC, 486 of which received venture capital funding. In fact, according to a report issued this spring, of the seven main tech regions in the country, New York was the only one to see any growth in VC deals since NYC deals increased 32 while Silicon Valley decreased 10. Another contributing factor is the changing definition of a tech firm. It s no longer just about building new technologies, but applying technology to existing industries many of which reside in New York City. In the past, technology was largely about hardware, but many of today s tech companies aim to transform existing businesses, targeting advertising firms, financial firms and media firms with headquarters here, so it s logical that these tech firms need to be in New York to succeed. Last month s Crain s New York noted that the atmosphere in certain boro neighborhoods is reminiscent of Silicon Valley in that talented tech workers are flocking there to live and work. Cornell University s president refers to the F-train corridor, after the subway line s 27-mile three-borough range. Cornell NYC is opening a 2-million square foot campus on Roosevelt Island in 2017 to foster engineering talent. Crain s writes on the draw of such an emerging center of innovation: Call it the Silicon Subway or whatever you want, but the fact is that the F train has become more than a line of convenience for the city's tech companies, funders and staffers alike. Today, it also ranks as a powerful drawing card. Some fledgling tech companies are finding that the high price of a New York presence is paying off. Crain s noted in May: For decades, New York has been known as the town companies left when they couldn't afford the higher salaries and rent. But a reversal is taking place among tech firms: Companies are moving here. They're drawn by a thriving ecosystem fed by money from private investors, and supported with incubator labs and other shared work spaces, some of them sponsored by the city. There's also proximity to hometown industries like media, advertising, fashion and finance all going through digital disruptions and a growing pool of engineers, as well as seasoned entrepreneurs.
7 Triboro Employment Industry Breakdown (Submarkets with sufficient transactions) Manhattan (all) Finance 43.9 Creative 11.4 Tech 14.9 Law 6.8 Medical 7.8 Student 15.1 Brooklyn (all) Finance 22.0 Creative 19.2 Tech 22.7 Law 12.2 Medical 12.2 Student 11.5 Queens (all) Finance 31.5 Creative 13.0 Tech 14.7 Law 8.4 Medical 16.8 Student 15.5
8 Triboro Employment Industry Breakdown (Submarkets with sufficient transactions) Manhattan prime Finance 44.7 Creative 11.3 Tech 14.6 Law 6.8 Medical 7.0 Student 15.6 Brooklyn DUMBO Finance 25.3 Creative 16.2 Tech 20.7 Law 12.9 Medical 12.9 Student 12.0 Queens LIC Finance 37.3 Creative 21.6 Tech 9.8 Law 2.0 Medical 11.8 Student 17.6

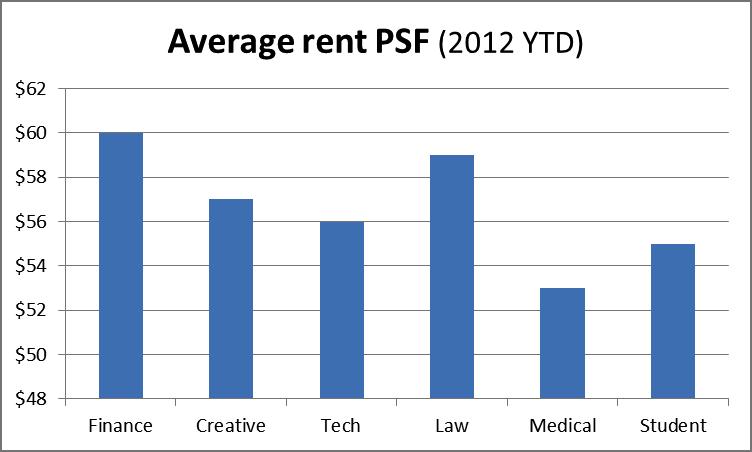
9 Triboro Demographic Summary Average Age Average Effective Rent PSF Median Income Income spent toward rent Finance 30.5 $60 $111, Creative 32.3 $57 $92, Tech 33.3 $56 $115, Law 35.4 $59 $170, Medical 36.6 $53 $90, Student 28.9 $55
10


11 Spending on rent vs. Ability* to spend (2012 YTD) * assumes average percentage of income were spent
12 Analysis With a great diversity in employers in New York City, which industries attract the optimal renters? Owners are achieving the highest effective rent per square foot from financial sector employees, despite the fact that lawyers and techies earn more. Lawyers also pay above average rent PSF. Medical industry renters pay the least, even less than students (although students often have a guarantor and subsidy). Looking at a renter s ability to spend, there appears to be further capacity to push rents. Why? Over the last five years, salaries have not decreased, yet today s income spent toward rent rests at its five-year average, having dropped 20 from its 2007 peak. This trend means that renters willingness to pay higher rents has not yet met their capacity to do so at least not across the board. Renters in creative industries spend the largest percentage of income toward rent, whereas finance, tech and medical are about average. This untapped capacity to push rents is particularly pronounced among lawyers, who earn the highest median income but spend the smallest percentage of it on rent. About On-Site Founded in 1999, On-Site.com has grown to become the gold standard in the apartment business. On-Site has a proven record of delivering best-in-class technology in a solution that can be implemented today. On-Site s marketing, leasing and mobile tools deliver lead generation, resident qualification, document storage, e-signatures and cloud computing services. On-Site allows apartment operators to maximize occupancy, enhance quality control, maintain compliance and ensure consistent success at all levels of property operations. Future Pipeline: The pipeline of new rental construction also tells a large part of this story. Over the past several years, Brooklyn and Queens have picked up momentum in new construction, and that momentum is expected to continue, as shown in the table below: Unknown Completion Date Manhattan 1,882 1,895 3,423 3,789 2,599 2,388 3,096 1,339 1,544 2,417 7,260 Brooklyn ,015 1,815 1, ,970 3, ,125 Queens , ,000 2,690
Key Findings on the Affordability of Rental Housing from New York City s Housing and Vacancy Survey 2008
 Furman Center for real estate & urban policy New York University school of law n wagner school of public service 110 West 3rd Street, Suite 209, New York, NY 10012 n Tel: (212) 998-6713 n www.furmancenter.org
New York City commercial real estate: Five factors that drove 2015 to historic highs by Shimon Shkury and Aryeh Orlofsky
 New York City commercial real estate: Five factors that drove 2015 to historic highs by Shimon Shkury and Aryeh Orlofsky May 03, 2016 - Front Section Shimon Shkury, Ariel Property AdvisorsAryeh Orlofsky,
Real Estate Technology
 The State of Real Estate Technology Commercial and multifamily real estate industries still rely on antiquated technology for critical business processes February 2018 Executive Summary In recent years,
LONG ISLAND CITY AND ASTORIA LIC AND ASTORIA ORANGE REPORT MODERN SPACES BROOKLYN 135 KENT AVENUE BROOKLYN, NY 11211
 LIC AND ASTORIA ORANGE REPORT T HE OR A N G E R E P O R T Q 3-2 014 - M A R K E T R E P O R T LONG ISLAND CITY AND ASTORIA M OD E RNSPACESNYC. C OM PG. 1 MODERN SPACES DITM ARS 10-63 JACKSON AVENUE Q3-2014
Stronger Office Market Looking Into Future
 Research & Forecast Report Long Island OFFICE MARKET Q2 2015 Stronger Office Market Looking Into Future Rose Liu Research & Financial Analyst Long Island Takeaways Class A & B Long Island economic and
REGIONAL. Rental Housing in San Joaquin County
 Lodi 12 EBERHARDT SCHOOL OF BUSINESS Business Forecasting Center in partnership with San Joaquin Council of Governments 99 26 5 205 Tracy 4 Lathrop Stockton 120 Manteca Ripon Escalon REGIONAL analyst april
Leasing activity remains strong through February; Downtown off to best start in years 10.0% 5.0%
 Office March 2017 New York Monthly Market Update Leasing activity remains strong through February; Downtown off to best start in years Manhattan Class A Asking Rents Manhattan Class A Vacancy Rents $100.00
2Q2017 L O N G ISLAND CITY
 2Q2017 L O N G ISLAND CITY M A R K E T R E P O R T INTRODUCTION L O N G I S L A N D C I T Y S A L E S R E P O R T Q 2 2 0 1 7 : LONG ISLAND CITY IS THE FASTEST GROWING NEIGHBORHOOD IN THE COUNTRY. The
Ten-Year Residential Rental Market Report CITI HABITATS
 Ten-Year Residential Rental Market Report 2007-2016 TEN-YEAR RESIDENTIAL RENTAL MARKET REPORT 2007-2016 The last ten years have been remarkable ones for the Manhattan rental market. This study covers the
The Seattle MD Apartment Market Report
 The Seattle MD Apartment Market Report Volume 16 Issue 2, December 2016 The Nation s Crane Capital Seattle continues to experience an apartment boom which requires constant construction of new units. At
HOUSING AFFORDABILITY
 HOUSING AFFORDABILITY (RENTAL) 2016 A study for the Perth metropolitan area Research and analysis conducted by: In association with industry experts: And supported by: Contents 1. Introduction...3 2. Executive
Multifamily Market Commentary February 2017
 Multifamily Market Commentary February 2017 Affordable Multifamily Outlook Incremental Improvement Expected in 2017 We expect momentum in the overall multifamily sector to slow in 2017 due to elevated
The Coldwell Banker Carlson Real Estate Market Report
 The Coldwell Banker Carlson Real Estate Market Report 2017 Year-End Stowe Area Report Our 2017 Year-End Market Report uses market-wide data, based on transactions that closed in 2017 in the Multiple Listing
Cambridge Office/Lab MarketView
 Cambridge Office/Lab MarketView CBRE Global Research and Consulting U.S. UNEMPLOYMENT 6.7% MA UNEMPLOYMENT 6.3% OCCUPIED SQ. FT. 19.4M OFFICE AVAIL. 10.0% LAB AVAIL. 18.4% UNDER CONSTRUCTION 1.8MSF *Arrows
1 Q M A NH AT TA N M A R K E T R E P O R T
 1Q2018 MANHATTAN M A R K E T R E P O R T INTRODUCTION M A N H A T T A N S A L E S R E P O R T Q 1 2 0 1 8 : THE NECESSITY OF BALANCE The first quarter of 2018 was a balancing act supported by declines
The State of Renters & Their Homes
 FORECLOSURES FINDING #14 The number of pre-foreclosure notices issued to one- to four-unit properties and condominiums in 2015 fell from the previous year. Pre-foreclosure notices for one- to four-unit
3Q2017 L O N G ISLAND CITY
 3Q2017 L O N G ISLAND CITY M A R K E T R E P O R T INTRODUCTION L O N G I S L A N D C I T Y S A L E S R E P O R T Q 3 2 0 1 7 : THE SKY IS THE LIMIT Here at Stribling, we are really excited by what s going
Monthly Market Update
 Monthly Market Update December 2015 New York City Office Outlook February 2016 M A N H A T T A N Class A Asking Rents M A N H A T T A N Class A Vacancy Rates $100.00 Jan-14 Jan-15 Jan-16 20.0% Jan-14 Jan-15
Peter Comitini Senior VP Associate Broker The Corcoran Group
 Sutton Area TriBeCa Upper East Side Upper West Side Washington Heights West Village Battery Park City Beekman Carnegie Hill Central Park South Chelsea Flatiron Clinton East Harlem East Village Financial
ECONOMIC CURRENTS. Vol. 5 Issue 2 SOUTH FLORIDA ECONOMIC QUARTERLY. Key Findings, 2 nd Quarter, 2015
 ECONOMIC CURRENTS THE Introduction SOUTH FLORIDA ECONOMIC QUARTERLY Economic Currents provides an overview of the South Florida regional economy. The report presents current employment, economic and real
>> 2017 Begins With Continued Strong Demand
 Research & Forecast Report Central Los Angeles OFFICE Q1 217 Accelerating success. >> 217 Begins With Continued Strong Demand Key Takeaways > Hudson Pacific's Icon at Sunset property delivered 323,3 square
THE MANHATTAN RENTAL MARKET REPORT
 TM THE MANHATTAN RENTAL MARKET REPORT YEAR END 2011 TABLE OF CONTENTS Introduction 3 Notable Trends 4 Mean Manhattan Rental Prices 5 Neighborhood Price Trends Harlem 7 Upper West 7 Upper East 7 Midtown
TABLE OF CONTENTS 03 INTRODUCTION 04 NOTABLE TRENDS 05 MEAN RENTAL PRICES 07 PRICE TRENDS
 TABLE OF CONTENTS 03 INTRODUCTION 04 NOTABLE TRENDS 05 MEAN RENTAL PRICES 07 PRICE TRENDS 07 LONG ISLAND CITY 07 ASTORIA 07 RIDGEWOOD 07 FLUSHING 08 REGO PARK 08 FOREST HILLS 08 JACKSON HEIGHTS 12 THE
Findings: City of Johannesburg
 Findings: City of Johannesburg What s inside High-level Market Overview Housing Performance Index Affordability and the Housing Gap Leveraging Equity Understanding Housing Markets in Johannesburg, South
KEY TOWER SALE highlights start of 2017
 KEY TOWER SALE highlights start of 2017 Demand for office space in the Greater Cleveland office market remained strong as 2016 wound down and transitioned into the first quarter of 2017. After netting
Appendix 1: Gisborne District Quarterly Market Indicators Report April National Policy Statement on Urban Development Capacity
 Appendix 1: Gisborne District Quarterly Market Indicators Report April 2018 National Policy Statement on Urban Development Capacity Quarterly Market Indicators Report April 2018 1 Executive Summary This
Strong year continues with high-profile leasing; rents remain flat as new and returning space looms 10.0% 5.0%
 $ PSF Office May 2017 New York Monthly Market Update Strong year continues with high-profile leasing; rents remain flat as new and returning space looms Manhattan Class A asking rents Manhattan Class A
2014 Plan of Conservation and Development
 The Town of Hebron Section 1 2014 Plan of Conservation and Development Community Profile Introduction (Final: 8/29/13) The Community Profile section of the Plan of Conservation and Development is intended
Summary. Houston. Dallas. The Take Away
 Page Summary The Take Away The first quarter of 2017 was marked by continued optimism through multiple Texas metros as job growth remained positive and any negatives associated with declining oil prices
Single Family Sales Maine: Units
 Maine Home Connection 19 Commercial St Portland, Maine 04101 MaineHomeConnection.com Office: (207) 517-3100 Email: Info@MaineHomeConnection.com For the fourth consecutive year, Maine home sales set a new
Brooklyn Rental Market Report July 2015 mns.com
 Brooklyn Rental Market Report July 2015 TABLE OF CONTENTS 03 Introduction 04 A Quick Look 05 Mean Brooklyn Rental Prices 10 Brooklyn Price Trends 11 Neighborhood Price Trends 11 Bay Ridge 12 Bedford-Stuyvesant
Performance of the Private Rental Market in Northern Ireland
 Summary Research Report July - December Performance of the Private Rental Market in Northern Ireland Research Report July - December 1 Northern Ireland Rental Index: Issue No. 8 Disclaimer This report
The Impact of Market Rate Vacancy Increases Eleven-Year Report
 The Impact of Market Rate Vacancy Increases Eleven-Year Report January 1, 1999 - December 31, 2009 Santa Monica Rent Control Board April 2010 TABLE OF CONTENTS Summary 1 Vacancy Decontrol s Effects on
Housing Market Update
 Housing Market Update March 2017 New Hampshire s Housing Market and Challenges Market Overview Dean J. Christon Executive Director, New Hampshire Housing Finance Authority New Hampshire s current housing
Real Estate Market Analysis
 One of the challenges facing the West Berkeley shuttle is to consider whether to expand the service beyond the current operations serving major employers, to a system that provides access to a more diverse
Manhattan Residential Rental Market Report
 Manhattan Residential Rental Market Report December & Fourth Quarter 217 Residential Rental Market Report December & Fourth Quarter 217 This report follows overall conditions in the Manhattan rental market
WHERE WILL WE LIVE? ONTARIO S AFFORDABLE RENTAL HOUSING CRISIS
 WHERE WILL WE LIVE? ONTARIO S AFFORDABLE RENTAL HOUSING CRISIS 48% of Ontario renters make less than $40,000 a year. Nearly half of Ontario renters pay unaffordable rental housing costs. 46% of all renters
Appendix D HOUSING WORK GROUP REPORT JULY 10, 2002
 Appendix D HOUSING WORK GROUP REPORT JULY 10, 2002 Work Group Assignment At the 20/20 forum in April 2001, the community expressed a need for housing policies which will protect both the Town s social
Las Vegas Valley Executive Summary
 ARROYO MARKET SQUARE Las Vegas Valley Executive Summary Retail Market 4th Quarter 2013 THE DISTRICT AT GREEN VALLEY RANCH January 23, 2014 Re: Commercial Real Estate Survey: 4th Quarter, 2013 Dear Reader,
E-commerce. E-commerce in the Bay Area. United States Year End How consumer demand for expedited deliveries is driving real estate
 1 E-commerce in the Bay Area United States Year End 2016 How consumer demand for expedited deliveries is driving real estate 2 Last-mile delivery and a new era for industrial Introduction real estate Adjusting
Monthly Market Update
 Monthly Market Update December 2015 New York City Office Outlook August 2016 M A N H A T T A N Class A Asking Rents M A N H A T T A N Class A Vacancy Rates $100.00 Jul-14 Jul-15 Jul-16 20.0% Jul-14 Jul-15
Sales of intermediate housing
 Sales of intermediate housing - 2009 Summary of issues...1 20.1 Introduction... 2 20.2 Intermediate Housing who has been housed... 2 Table 1: Shared ownership and OMHomeBuy sales, 2007/08...3 Fig 1: Total
Queens Rental Market Report November 2015 mns.com
 Queens Rental Market Report November 2015 TABLE OF CONTENTS 03 Introduction 04 A Quick Look 05 Mean Queens Rental Prices 10 Queens Price Trends 11 Neighborhood Price Trends 11 Long Island City 12 Astoria
INLAND EMPIRE REGIONAL INTELLIGENCE REPORT
 INLAND EMPIRE REGIONAL INTELLIGENCE REPORT June 2016 EMPLOYMENT After a slow start to 2016, the Inland Empire s labor market returned to form, in recent job figures. Seasonally adjusted nonfarm employment
CONTENTS. Executive Summary 1. Southern Nevada Economic Situation 2 Household Sector 5 Tourism & Hospitality Industry
 CONTENTS Executive Summary 1 Southern Nevada Economic Situation 2 Household Sector 5 Tourism & Hospitality Industry Residential Trends 7 Existing Home Sales 11 Property Management Market 12 Foreclosure
Detroit Inclusionary Housing Plan & Market Study Preliminary Inclusionary Housing Feasibility Study Executive Summary August, 2016
 Detroit Inclusionary Housing Plan & Market Study Preliminary Inclusionary Housing Feasibility Study Executive Summary August, 2016 Inclusionary Housing Plan & Market Study Objectives 1 Evaluate the citywide
AMAZON HQ2: Amazon s Near-Term Impact on the Queens and New York City Real Estate Market. January
 A whitepaper by Barbara Byrne Denham AMAZON HQ2: Amazon s Near-Term Impact on the Queens and New York City Real Estate Market January 2019 www.reis.com January 2019 By Barbara Byrne Denham Amazon s Near-Term
A matter of choice? RSL rents and home ownership: a comparison of costs
 sector study 2 A matter of choice? RSL rents and home ownership: a comparison of costs Key findings and implications Registered social landlords (RSLs) across the country should monitor their rents in
Strong Marketwide Leasing Activity Points To A Strong Finish for Tri-Cities
 OFFICE TRI-CITIES MARKET REPORT Strong Marketwide Leasing Activity Points To A Strong Finish for Tri-Cities MARKET OVERVIEW MARKET INDICATORS - VACANCY 14.9% NET ABSORPTION 254,6 CONSTRUCTION 113,8 RENTAL
San Francisco Bay Area to Marin, San Francisco, and San Mateo Counties Housing and Economic Outlook
 San Francisco Bay Area to 2020 Marin, San Francisco, and San Mateo Counties Housing and Economic Outlook Economic Forecast Summary 2017 Presented by Pacific Union International, Inc. and John Burns Real
HOULIHAN LAWRENCE COMMERCIAL GROUP
 HOULIHAN LAWRENCE COMMERCIAL GROUP TH QUARTER EXECUTIVE SUMMARY FOURTH QUARTER Dear Clients, With behind us and the new year in full swing, we can now reflect, summarize and gain insight from the past
Median Income and Median Home Price
 Homeownership Remains Unaffordable; Rental Affordability Showing Signs of Improvement Richard E. Taylor, Research Manager at MaineHousing MaineHousing has released the 217 Maine Homeownership and Rental
Queens Rental Market Report November 2017 mns.com
 Queens Rental Market Report November 2017 TABLE OF CONTENTS 03 Introduction 04 A Quick Look 10 Queens Price Trends 11 Neighborhood Price Trends 11 Long Island City 12 Astoria 13 Ridgewood 14 Flushing 15
Brooklyn Rental Market Report August 2015 mns.com
 Brooklyn Rental Market Report August 2015 TABLE OF CONTENTS 03 Introduction 04 A Quick Look 05 Mean Brooklyn Rental Prices 10 Brooklyn Price Trends 11 Neighborhood Price Trends 11 Bay Ridge 12 Bedford-Stuyvesant
APARTMENT MARKET SUPPLY AND DEMAND DATA. Prepared March 2012 PAGE 1
 APARTMENT MARKET SUPPLY AND DEMAND DATA Prepared March 2012 PAGE 1 SUMMARY OF MARKET CONDITIONS Inventory According to the 4 th quarter 2011 MFP report on the San Jose metro apartment market, the inventory
Multifamily Market Commentary December 2018
 Multifamily Market Commentary December 218 Small Multifamily a Big Deal in Los Angeles Small multifamily properties those with five- to 5-units are getting more attention as an important source of affordable
Residential Commentary - Perth Apartment Market
 Residential Commentary - Perth Apartment Market March 2016 Executive Summary The Greater Perth apartment market has attracted considerable interest from local and offshore developers. Projects under construction
San Francisco Bay Area to Sonoma County Housing and Economic Outlook
 San Francisco Bay Area to 2020 Sonoma County Housing and Economic Outlook Economic Forecast Summary 2017 Presented by Pacific Union International, Inc. and John Burns Real Estate Consulting, LLC On Nov.
UPGRADING PRIVATE PROPERTY AT PUBLIC EXPENSE The Rising Cost of J-51
 UPGRADING PRIVATE PROPERTY AT PUBLIC EXPENSE The Rising Cost of J-51 POLICY BRIEF By Tom Waters and Victor Bach June 2012 The Community Service Society of New York (CSS) draws on a 168-year history of
High-priced homes have a unique place in the
 Livin' Large Texas' Robust Luxury Home Market Joshua G. Roberson December 3, 218 Publication 2217 High-priced homes have a unique place in the overall housing market. Their buyer pool, home characteristics,
TROPHY PROPERTY FORSALE
 TROPHY PROPERTY FORSALE 34-39 31St, Astoria Vass Stevens Gr oup - http:/ ww.vass-stevens.com 718-880-3980 ABOUT VASS STEVENS The Vass Stevens Group is a New York City based real estate services and investment
Multifamily Metro Outlook: New York Spring 2018
 Overview The New York City metro is the nation s largest apartment market with 2.2 million rental units, of which 47 percent are rent-stabilized and 1.2 percent rent-controlled. As anticipated, a glut
San Francisco Bay Area to Napa County Housing and Economic Outlook
 San Francisco Bay Area to 019 Napa County Housing and Economic Outlook Bay Area Economic Forecast Summary Presented by Pacific Union International, Inc. and John Burns Real Estate Consulting, LLC On Nov.
MANHATTAN MARKET REPORT
 MANHATTAN MARKET REPORT Q1 MANHATTAN MARKET REPORT 1Q 2017 Manhattan s residential market is showing signs of improvement after a period of uncertainty leading up to the Presidential election, as it does
MULTIFAMILY MARKET REPORT GREATER TORONTO AREA FALL 2017
 MULTIFAMILY MARKET REPORT GREATER TORONTO AREA FALL 2017 Table of Contents 1.0 Demand Indicators 2.0 Economic Snapshot 3.0 Multifamily Housing Market Summary 4.0 Rental Market Summary 5.0 Secondary Rental
MARKET IN A MINUTE A SUMMARY OF MARKET CONDITIONS FOR MARCH & 1st QUARTER 2016
 STATPAK ` WASHINGTON, DC APRIL 2016 MARKET IN A MINUTE A SUMMARY OF MARKET CONDITIONS FOR MARCH & 1st QUARTER 2016 Contract activity in March 2016 was up 12.6% from March of 2015, and there were increases
San Francisco Bay Area to Santa Clara & San Benito Counties Housing and Economic Outlook
 San Francisco Bay Area to 019 Santa Clara & San Benito Counties Housing and Economic Outlook Bay Area Economic Forecast Summary Presented by Pacific Union International, Inc. and John Burns Real Estate
For personal use only
 US RESIDENTIAL FUND Investor Update November 2016 Disclaimer This Presentation is not a prospectus, product disclosure statement or other offering document under Australian law, including the Corporations
Affordably- Priced Housing
 Affordably- Priced Housing Can the next generation afford to live in Chester County? Chester County Planning Commission This slide deck is an annotated version of one presented at the Chesco2020 Affordably-Priced
>> Market Records Strong Demand To End 2016
 Research & Forecast Report Central Los Angeles OFFICE Q4 216 Accelerating success. >> Market Records Strong Demand To End 216 Key Takeaways > There is currently 61,4 square feet () of office product under
Queens Rental Market Report June 2016 mns.com
 Queens Rental Market Report June 2016 TABLE OF CONTENTS 03 Introduction 04 A Quick Look 10 Queens Price Trends 11 Neighborhood Price Trends 11 Long Island City 12 Astoria 13 Ridgewood 14 Flushing 15 Rego
A Tale of Two Canadas
 Centre for Urban and Community Studies Research Bulletin #2 August 2001 A Tale of Two Canadas Homeowners Getting Richer, Renters Getting Poorer Income and Wealth Trends in Toronto, Montreal and Vancouver,
H o u s i n g N e e d i n E a s t K i n g C o u n t y
 1999 2000 2001 2002 2003 2004 2005 2006 2007 2008 2009 2010 Number of Affordable Units H o u s i n g N e e d i n E a s t K i n g C o u n t y HOUSING AFFORDABILITY Cities planning under the state s Growth
WYNYARD CENTRAL HOUSING POLICY
 WYNYARD CENTRAL HOUSING POLICY 1 Policy objectives 1.1 To clarify the approach that Waterfront Auckland (WA) will take to delivering a thriving residential community. 2 Scope 2.1 Covers the approach to
Manhattan Rental Market Report October 2017 mns.com
 Manhattan Rental Market Report October 2017 TABLE OF CONTENTS 03 Introduction 04 A Quick Look 07 Mean Manhattan Rental Prices 11 Manhattan Price Trends 12 Neighborhood Price Trends 12 Battery Park City
The Profile for Residential Building Approvals by Type and Geography
 The Profile for Residential Building Approvals by Type and Geography Key Points: ABS Building Approvals for Australia peaked back in October 2015. As we have frequently highlighted, approvals have subsequently
ARLA Members Survey of the Private Rented Sector
 Prepared for The Association of Residential Letting Agents & the ARLA Group of Buy to Let Mortgage Lenders ARLA Members Survey of the Private Rented Sector Fourth Quarter 2010 Prepared by: O M Carey Jones
Housing, Retail and Arts
 Summary of Findings & Conclusions West Oakland Specific Plan Market Opportunity Report: Housing, Retail and Arts Prepared for City of Oakland Under subcontract to JRDV Architects DECEMBER 2011 Summary
San Francisco Bay Area to Marin, San Francisco, and San Mateo Counties Housing and Economic Outlook
 San Francisco Bay Area to 019 Marin, San Francisco, and San Mateo Counties Housing and Economic Outlook Bay Area Economic Forecast Summary Presented by Pacific Union International, Inc. and John Burns
US Worker Cooperatives: A State of the Sector
 US Worker Cooperatives: A State of the Sector Worker cooperatives have increasingly drawn attention from the media, policy makers and academics in recent years. Individual cooperatives across the country
Q Cape Town Office Market Report. In association with Baker Street Properties
 Cape Town Office Market Report 217 set for rental growth as economy improves, but the city continues to struggle to cater to large occupiers Q4 216 In association with Baker Street Properties 1 Central
M A N H A T T A N 69 THE FURMAN CENTER FOR REAL ESTATE & URBAN POLICY. Financial District Greenwich Village/Soho
 M A N H A T T A N Page Financial District 301 72 Greenwich Village/Soho 302 73 Lower East Side/Chinatown 303 74 Clinton/Chelsea 304 75 69 THE FURMAN CENTER FOR REAL ESTATE & URBAN POLICY Midtown 305 76
COLLIERS INTERNATIONAL 2019 LANDLORD SENTIMENT SURVEY
 COLLIERS INTERNATIONAL 2019 LANDLORD SENTIMENT SURVEY Colliers International 2019 Landlord Sentiment Survey 1 SURVEY OVERVIEW Colliers International s survey of landlords was conducted and completed between
Has The Office Market Reached A Peak? Vacancy. Rental Rate. Net Absorption. Construction. *Projected $3.65 $3.50 $3.35 $3.20 $3.05 $2.90 $2.
 Research & Forecast Report OAKLAND METROPOLITAN AREA OFFICE Q1 Has The Office Market Reached A Peak? > > Vacancy remained low at 5. > > Net Absorption was positive 8,399 in the first quarter > > Gross
REPORT BY THE COMMITTEE ON HOUSING AND URBAN DEVELOPMENT THE MAPPING OF MANDATORY INCLUSIONARY HOUSING (MIH) AND THE EAST HARLEM REZONING
 AND THE EAST HARLEM REZONING") CONTACT POLICY DEPARTMENT MARIA CILENTI 212.382.6655 mcilenti@nycbar.org ELIZABETH KOCIENDA 212.382.4788 ekocienda@nycbar.org REPORT BY THE COMMITTEE ON HOUSING AND URBAN DEVELOPMENT THE MAPPING OF MANDATORY
CONTACT POLICY DEPARTMENT MARIA CILENTI 212.382.6655 mcilenti@nycbar.org ELIZABETH KOCIENDA 212.382.4788 ekocienda@nycbar.org REPORT BY THE COMMITTEE ON HOUSING AND URBAN DEVELOPMENT THE MAPPING OF MANDATORY
San Francisco Bay Area to Santa Clara and San Benito Counties Housing and Economic Outlook
 San Francisco Bay Area to 2020 Santa Clara and San Benito Counties Housing and Economic Outlook Economic Forecast Summary 2017 Presented by Pacific Union International, Inc. and John Burns Real Estate
New Development Year-End Report
 New Development Year-End Report MANHATTAN $ 2,215 AVERAGE PRICE PER SQ. FT. CONTRACT SIGNED BROOKLYN $ 1,129 AVERAGE PRICE PER SQ. FT. CONTRACT SIGNED $ 2,86 $ 997 AVERAGE PRICE PER SQ. FT. CLOSED AVERAGE
Myth Busting: The Truth About Multifamily Renters
 Myth Busting: The Truth About Multifamily Renters Multifamily Economics and Market Research With more and more Millennials entering the workforce and forming households, as well as foreclosed homeowners
Rapid recovery from the Great Recession, buoyed
 Game of Homes The Supply-Demand Struggle Laila Assanie, Sarah Greer, and Luis B. Torres October 4, 2016 Publication 2143 Rapid recovery from the Great Recession, buoyed by the shale oil boom, has fueled
Trends in Scottish Residential Lettings
 The Citylets Report Issue 1 Spring 2007 Trends in Scottish Residential tings A Tale of Three Cities Introduction citylets.co.uk is Scotland s original residential lettings portal advertising over 45,000
The Texas 2005 Profile of Home Buyers and Sellers. Prepared by: NATIONAL ASSOCIATION OF REALTORS Research Division
 The Texas 2005 Profile of Home Buyers and Sellers Prepared by: NATIONAL ASSOCIATION OF REALTORS Research Division February, 2006 The 2005 NATIONAL ASSOCIATION OF REALTORS Profile of Home Buyers and Sellers
Housing Needs in Burlington s Downtown & Waterfront Areas
 Housing Needs in s Downtown & Waterfront Areas Researched and written by Vermont Housing Finance Agency for the City of Planning & Zoning Department 10/31/2011 Contents Introduction... 2 Executive Summary...
ARLA Members Survey of the Private Rented Sector
 Prepared for The Association of Residential Letting Agents ARLA Members Survey of the Private Rented Sector Second Quarter 2014 Prepared by: O M Carey Jones 5 Henshaw Lane Yeadon Leeds LS19 7RW June, 2014
Residential Rental Market Report JU NE & S EC O N D Q U A RT E R 2Q18
 Residential Rental Market Report JU NE & S EC O N D Q U A RT E R 2Q18 Manhattan Residential Rental Market Report June & Second Quarter 2018 This report follows conditions in the Manhattan rental market
250-UNIT, VALUE-ADD MULTI-HOUSING COMMUNITY IN PHOENIX, ARIZONA
 hfflp.com 250-UNIT, VALUE-ADD COMMUNITY IN, ARIZONA Holliday Fenoglio Fowler, L.P. ( HFF ), a licensed Arizona real estate broker. 2 SEDONA RIDGE APARTMENT HOMES SEDONA RIDGE APARTMENT HOMES 3 THE OFFERING
How Does the City Grow?
 This bulletin summarizes information from the City of Toronto s Land Use Information System II, providing an overview of the development projects received by the City Planning Division between January
Multifamily Market Commentary February 2018
 Multifamily Market Commentary February 2018 2018 Multifamily Affordable Market Outlook A Long Way to Go Momentum in the overall multifamily sector will likely slow in 2018 due to elevated levels of new
STATPAK MARKET IN A MINUTE A SUMMARY OF MARKET CONDITIONS FOR JUNE & FIRST HALF McEnearney.com CONTRACTS URGENCY INDEX INVENTORY INTEREST RATES
 STATPAK LOUDOUN COUNTY JULY 2018 McEnearney.com MARKET IN A MINUTE A SUMMARY OF MARKET CONDITIONS FOR JUNE & FIRST HALF 2018 Contract activity in June 2018 was up 5.1% from June 2017. Through the first
Trends in Housing Occupancy
 This bulletin is one in a series of background bulletins to the Official Plan Review. It provides an analysis of changes in household composition and housing occupancy between 1996 and 2006. A copy of
MARKET AREA UPDATE Report as of: 1Q 2Q 3Q 4Q
 MARKET AREA UPDATE Report as of: 1Q 2Q 3Q 4Q Year: 2013 Market Area (City, State): Arlington, Virginia Provided by (Company / Companies): McEnearney Associates, Inc. Realtors What are the most significant