2016 FORT WAYNE, INDIANA OFFICE MARKET SURVEY
|
|
|
- Sydney Greer
- 6 years ago
- Views:
Transcription


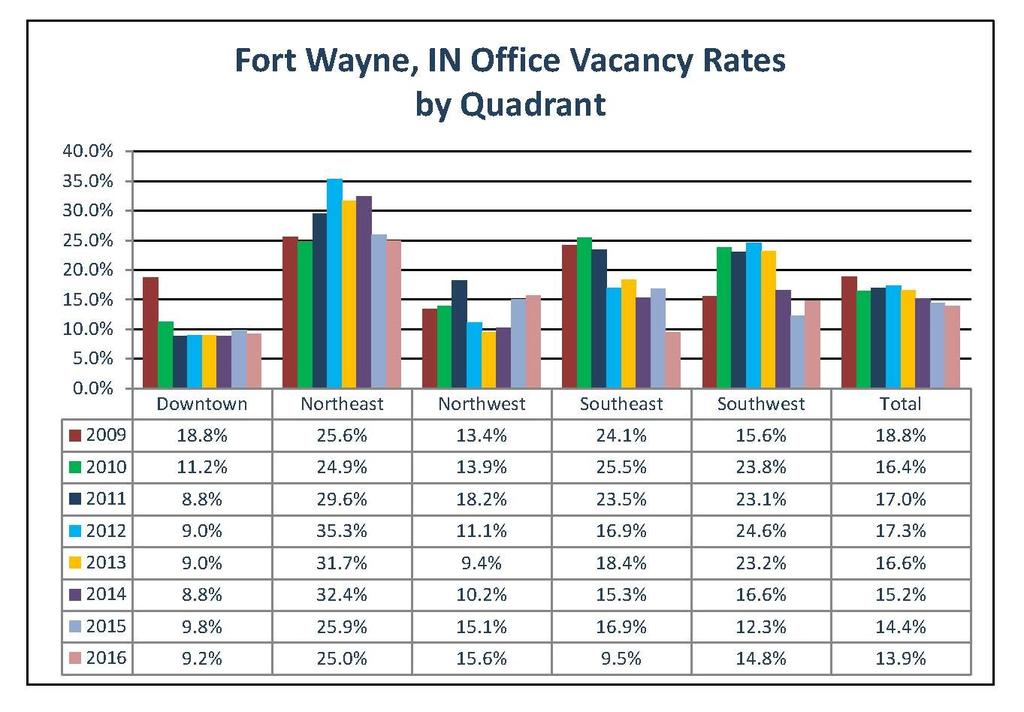
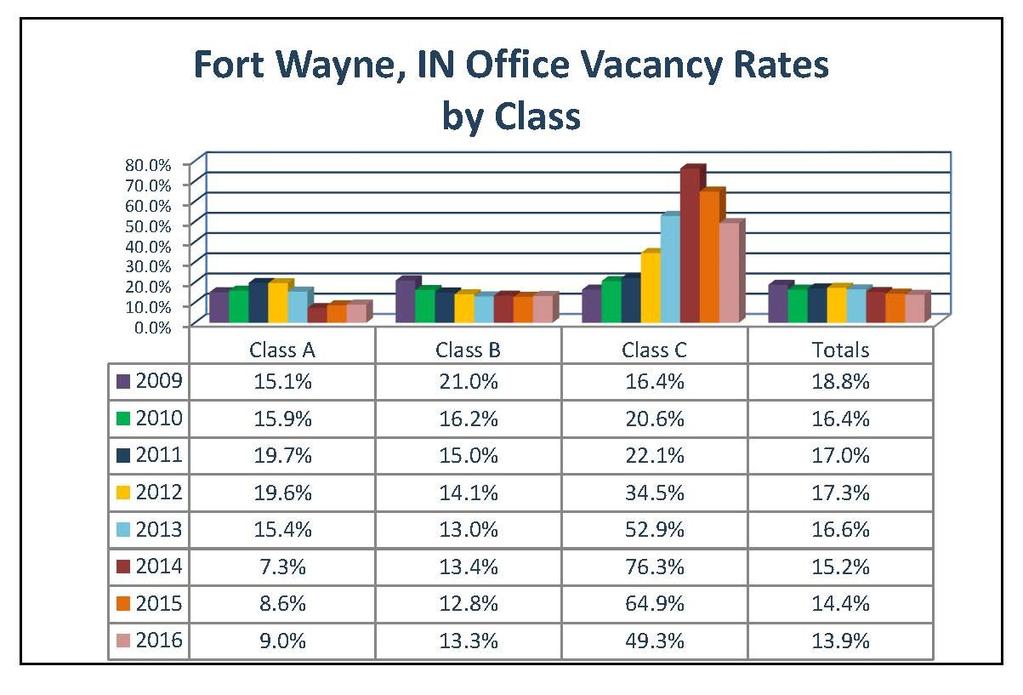
1 2016 FORT WAYNE, INDIANA OFFICE MARKET SURVEY 2016 REVIEW 2017 FORECAST PREPARED WITH THE ASSISTANCE OF New construction, renovation and relocation in downtown was the big story for the Fort Wayne office market in 2016, highlighted by Ash Skyline Plaza being 100% occupied. The office vacancy for the total Fort Wayne market decreased from 14.4% to 13.9% in the period from November 2015 to October Overall, the Fort Wayne office vacancy rate has decreased in 5 out of the past 7 years, reflecting a recovery in the market since the economic downturn of 2008/2009. There was limited new construction during the year other than Ash Skyline Plaza downtown and medical-related projects. Downtown has the lowest vacancy rate in the market and decreased from 9.8% to 9.2%. The northeast quadrant continues to have the highest vacancy rate at 25.0%, down from 25.9%. The southwest quadrant vacancy increased to 14.8% from 12.3%. The Class A vacancy rate remains low at 9%. Meanwhile, the Class B vacancy rate increased slightly to 13.3%, while Class C vacancy stood at 49.3%. The market dynamics are improving for landlords and rental rates are increasing. The overall decrease in market vacancy is reflective of steadily improving market conditions, especially downtown. The high vacancy in the northeast quadrant continues to negatively impact the overall market and especially the landlords in that submarket. Downtown will continue to be the focus of office activity in 2017, with announcements possible for more developments, adaptive reuses and companies relocating downtown. By contrast, more vacant space will hit the market in the suburbs in 2017, based on corporate downsizing and relocation and the closing of three for-profit colleges. We expect some of the space to be absorbed by local companies expanding within the market. Office users will move from B & C space to A & B space. Companies are moving to better space that has a greater emphasis on office space efficiency, collaboration, more natural light and open design with fewer hard walls. Space utilization per employee will decrease. We expect Class A rents to increase with fewer incentives required from landlords. We expect Class B & C rents to decrease and landlord concessions to continue, especially in the suburban submarkets. Steven K. Zacher, SIOR, CCIM Alfred J. Zacher, SIOR Joy Neuenschwander, CPM John M. Adams, CCIM Brian Bean Fletcher Moppert Dan Reese Brent L. Overholt, MAI Dave Kaverman Evan Rubin FOR MORE INFORMATION PLEASE CONTACT: THE ZACHER COMPANY 444 EAST MAIN STREET, SUITE 203, FORT WAYNE, IN PHONE: (260) INFO@ZACHERCO.COM PUBLISHED: OCTOBER 28, 2016

2 The Zacher Company

3 The Zacher Company

4 Average Full Service Lease Rates 2016 Notable Fort Wayne Office Transactions The Zacher Company


5 Methodology: The Zacher Company office market survey report is a compilation of data from many sources. The total amount of square footage in the marketplace area was originally gleaned from reports prepared by LoopNet, ICREX and CoStar. It is reviewed annually and adjusted due to circumstances in the market, such as new construction, re-positioning of existing buildings to another type of use and demolition. It includes office buildings only and does not include offices attached to industrial properties or flex space. The vacancy square footage is compiled from a combination of online data from multiple major listing services, brokers listing information from their websites and their mailings and industry knowledge. New construction is added to the inventory upon delivery of the space, during the reporting period. Available space also includes office spaces available for sub-lease. The brokers in our office are involved in the creation of this report to provide the most accurate information possible. We cannot be responsible, however, for errors, omissions, prior sale or lease or withdrawal from the market. The Zacher Company
2017 FORT WAYNE, INDIANA OFFICE MARKET SURVEY
 2017 FORT WAYNE, INDIANA OFFICE MARKET SURVEY 2017 REVIEW 2018 FORECAST PREPARED WITH THE ASSISTANCE OF Overall, the market conditions have stabilized. The most significant development for the Fort Wayne
2017 FORT WAYNE, INDIANA RETAIL MARKET SURVEY
 2017 FORT WAYNE, INDIANA RETAIL MARKET SURVEY REVIEW FORECAST PREPARED WITH THE ASSISTANCE OF Nationally, retailers are closing stores at a record pace as they feel the fallout from decades of overbuilding
2015 FORT WAYNE, INDIANA RETAIL MARKET SURVEY
 215 FORT WAYNE, INDIANA RETAIL MARKET SURVEY REVIEW FORECAST PREPARED WITH THE ASSISTANCE OF The period of October 214 - June 215 was an active time for retail transactions in the Fort Wayne area; however,
2018 NORTHEAST INDIANA INDUSTRIAL MARKET SURVEY
 2018 NORTHEAST INDIANA INDUSTRIAL MARKET SURVEY 2017 REVIEW 2018 FORECAST PREPARED WITH THE ASSISTANCE OF 2017 was a solid year for industrial real estate in Northeast Indiana. The vacancy rate at the
The past year is better described as a year of
 Omaha Office Market Report Omaha, Nebraska / January 2018 Omaha Office Market Conditions and Trends 2017 Office Market Underperforms Omaha s office market enjoyed a number of significant transactions in
INDUSTRIAL QUICK STATS SUMMARY & OUTLOOK MARKET TRENDS VACANCY & NET ABSORPTION ECONOMIC STATS
 PHOENIX, ARIZONA INDUSTRIAL THIRD QUARTER 217 QUICK STATS Direct Vacancy 8.7% Overall Vacancy 9.% Lease Rate NNN $.54 Gross Absorption Under Construction MARKET TRENDS Current Quarter 5,991,128 SF 4,751,494
OFFICE REPORT WINTER 2017
 A Global Division of Cressy Commercial Real Estate OFFICE REPORT WINTER 217 www.cressycommercial.com OFFICE BUILDING CLASSIFICATIONS Office buildings are loosely classified based on the quality of their
Miami-Dade County Office Market Report 4Q Real Capital Partners Real Estate Services. *Data Source CoStar Miami-Dade County Office Market Report
 Miami-Dade County Office Market Report 4Q 216 Real Capital Partners Real Estate Services *Data Source CoStar Miami-Dade County Office Market Report 4Q 216 Miami-Dade County Office Market Report Overview
Bakersfield 4Q18 Office Market Trends
 Bakersfield the higher cost of leasing in the submarket is unlikely to hinder demand as CRC s lease expirations create more available inventory within the University Centre Submarket. Mark J. Smith, SIOR
First Quarter Industrial Market Report 2017
 First Quarter Industrial Market Report 2017 03 04 04 04 05 06 08 09 10 11 13 Executive Summary National Economy Local Economy Oklahoma City Industrial Market Leasing Net Absorption and Inventory Rental
Indianapolis MARKETBEAT. Office Q Economy. Market Overview INDIANAPOLIS OFFICE
 INDIANAPOLIS OFFICE Economic Indicators Q2 17 Q2 18 MSA Employment 1.1M 1.1M MSA Unemployment 3.3% 3.0% U.S. Unemployment 4.3% 3. Market Indicators (Direct, All Classes) Q2 17 Q2 18 Total Market Vacancy
2Q 17. Office Market Report
 2Q 17 Office Market Report Low vacancy rates and steady rental rates characterize the Portland office market Portland s office market has reached a level of strength not seen since the great recession.
WINTER 2016 OMAHA, NEBRASKA INDUSTRIAL MARKET REPORT
 WINTER 2016 OMAHA, NEBRASKA INDUSTRIAL MARKET REPORT By Kevin Stratman OMAHA S THRIVING INDUSTRIAL MARKET SHOWS NO SIGNS OF SLOWING DOWN It is difficult to find one aspect of the Omaha industrial market
TRANSWESTERN OUTLOOK DC AT Q1O8
 TRANSWESTERN OUTLOOK DC AT Q1O8 Even With Soft Office Absorption, Vacancy Remains Low; Rents Continue to Edge Up The District of Columbia s office market experienced steady conditions during the 1st quarter
2011 Baton Rouge Office Market Overview
 2011 Baton Rouge Office Market Overview Presented by: Branon W. Pesnell, CCIM, SIOR Beau Box Commerical Gary Black Wampold Companies Jonann Stutzman JTS Management Drew Pearson, CCIM NAI Latter & Blum
Metropolitan Milwaukee Office Market Report Third Quarter 2015
 Metropolitan Milwaukee Office Market Report Third Quarter 2015 RETAIL OFFICE INDUSTRIAL LAND INVESTMENT NAI MLG COMMERCIAL 414 347 9400 757 N BROADWAY, SUITE 700, MILWAUKEE, WI 53202 MLGCOMMERCIAL.COM
3 RD QUARTER 2015 RICHMOND INDUSTRIAL MARKET REPORT
 3 RD QUARTER FORECAST As the U.S. economy continued to show positive economic growth through the third quarter, the Richmond, VA Industrial market saw demand for warehouse and flex properties increase
3 RD QUARTER 2016 RICHMOND INDUSTRIAL MARKET REPORT
 3 RD QUARTER 2016 RICHMOND INDUSTRIAL MARKET REPORT FORECAST The Richmond Industrial market continued trending in the positive direction in the third quarter, with the absorption of over 320,000 square
Q2:11. Transwestern Outlook WASHINGTON, D.C.
 11 Office Property Owners Invest in Renovating Older Product to Class A; Vacancy Edges Up as Rents Edge Down; Investment Sales Strong and Net Absorption Notable The District of Columbia office market experienced
RETAIL MARKET ANALYSIS
 RETAIL MARKET ANALYSIS Portland State University Despite the doom and gloom warnings of a retail apocalypse, the national story for retail is that things are stable. Nationwide vacancy is at 5.2 percent
OFFICE QUICK STATS SUMMARY & OUTLOOK MARKET TRENDS VACANCY & NET ABSORPTION ECONOMIC STATS
 VENTURA COUNTY OFFICE THIRD QUARTER 217 QUICK STATS Direct Vacancy 13.9% Overall Vacancy 14.3% Lease Rate FSG $2.25 Gross Absorption Under Construction MARKET TRENDS Current Quarter 34,43 SF 18,112 SF
No Where To Grow. ALBUQUERQUE, NM Q Retail. Research & Forecast Report. Key Takeaways. Market Indicators Relative to prior period
 Research & Forecast Report ALBUQUERQUE, NM Q2 20 Retail No Where To Grow Key Takeaways > > Supply of anchor spaces becoming scarce > > Renovations help to alleviate lack of new projects > > New projects
INDUSTRIAL QUICK STATS SUMMARY & OUTLOOK MARKET TRENDS VACANCY & NET ABSORPTION ECONOMIC STATS
 ORANGE COUNTY INDUSTRIAL FOURTH QUARTER 217 QUICK STATS Direct Vacancy 2.3% Overall Vacancy 2.7% Lease Rate NNN $.91 Gross Absorption Under Construction MARKET TRENDS Current Quarter 4,283,991 SF 963,138
Indianapolis MARKETBEAT. Office Q Economy. Market Overview INDIANAPOLIS OFFICE
 INDIANAPOLIS OFFICE Economic Indicators Market Indicators (Direct, All Classes) Direct Net Absorption/Direct Asking Rent 4-QTR TRAILING AVERAGE Direct Vacancy Q3 17 Q3 18 MSA Employment 1.05M 1.07M MSA
17th Annual Real Estate Review & Forecast
 2017 17th Annual Real Estate Review & Forecast This Year s Sponsors Member FDIC Construction: Review & Forecast 2017 Page 2 Permits Issued 142 New Commercial Construction Permits issued for all Elkhart
The CoStar Office Report
 The CoStar Office Report T H I R D Q U A R T E R 2 0 1 2 THIRD QUARTER 2012 PHOENIX Table of Contents Table of Contents.................................................................... A Methodology........................................................................
INDUSTRIAL QUICK STATS SUMMARY & OUTLOOK MARKET TRENDS VACANCY & NET ABSORPTION ECONOMIC STATS
 VENTURA COUNTY INDUSTRIAL FOURTH QUARTER 217 QUICK STATS Direct Vacancy 2.1% Overall Vacancy 2.4% Lease Rate NNN $.7 Gross Absorption Under Construction MARKET TRENDS Current Quarter 1,332,957 SF 774,362
3 RD QUARTER 2015 RICHMOND RETAIL MARKET REPORT FORECAST 5.7% VACANCY 509,220 SF UNDER CONSTRUCTION 370,165 SF NET ABSORPTION
 3 RD QUARTER 2015 RICHMOND RETAIL MARKET REPORT FORECAST As 2015 winds down, the vacancy rates are approaching an all time low. Retail inventory is down causing an increase in construction with national
OFFICE QUICK STATS SUMMARY & OUTLOOK MARKET TRENDS VACANCY & NET ABSORPTION ECONOMIC STATS
 LOS ANGELES SAN GABRIEL VALLEY OFFICE SECOND QUARTER 218 QUICK STATS Direct Vacancy 11.1% Overall Vacancy 11.4% Lease Rate FSG $2.32 Gross Absorption Under Construction MARKET TRENDS Current Quarter 345,68
OFFICE QUICK STATS SUMMARY & OUTLOOK MARKET TRENDS VACANCY & NET ABSORPTION ECONOMIC STATS
 INLAND EMPIRE OFFICE THIRD QUARTER 217 QUICK STATS Direct Vacancy 11.4% Overall Vacancy 11.7% Lease Rate FSG $1.83 Gross Absorption Under Construction MARKET TRENDS Current Quarter 529,634 SF 45,24 SF
CoStar Office Statistics. M i d - Y e a r Denver Office Market
 CoStar Office Statistics M i d - Y e a r 2 0 1 7 Mid-Year 2017 Denver Table of Contents Table of Contents................................................................. A Methodology......................................................................
OFFICE QUICK STATS SUMMARY & OUTLOOK MARKET TRENDS VACANCY & NET ABSORPTION ECONOMIC STATS
 ORANGE COUNTY OFFICE THIRD QUARTER 217 QUICK STATS Direct Vacancy 12.1% Overall Vacancy 12.9% Lease Rate FSG $2.61 Gross Absorption Under Construction MARKET TRENDS Current Quarter 2,479,293 SF 379, SF
Greenville is a tenant s market
 Research & Forecast Report GREENVILLE SPARTANBURG ANDERSON SOUTH CAROLINA OFFICE Q2 2018 Greenville is a tenant s market Crystal Baker Research Coordinator South Carolina Key Takeaways > > Large blocks
INDUSTRIAL QUICK STATS SUMMARY & OUTLOOK MARKET TRENDS VACANCY & NET ABSORPTION ECONOMIC STATS
 INLAND EMPIRE INDUSTRIAL FOURTH QUARTER 217 QUICK STATS Direct Vacancy 5.1% Overall Vacancy 5.3% Lease Rate NNN $.57 Gross Absorption Under Construction MARKET TRENDS Current Quarter 9,23,744 SF 16,31,563
Executive Park North - Office Park
 400 to 8,300 SF Office Suites starting at $350/ month w/utilities & janitorial!! Full Service Lease Rates (See attached list) Flex Suites 1,200-8,300 SF For information contact: Larry Crumbley CCIM, SIOR,
MARKET WATCH SOUTHERN CALIFORNIA & PHOENIX
 SOUTHERN CALIFORNIA & PHOENIX COMMERCIAL REAL ESTATE MARKET FOURTH QUARTER 217 MARKET WATCH SOUTHERN CALIFORNIA & PHOENIX 1.888.659.DAUM WWW.DAUMCOMMERCIAL.COM D/AQ Corp. # 1129558 DAUM TABLE OF CONTENTS
+48.6 million sf office inventory
 Research Market Report METROPOLITAN MILWAUKEE OFFICE 2018 Quarter 1 Research Wisconsin Introduction Following a strong second half of 2017, 2018 had a slow start. Despite an increase in vacancy and negative
Major tenant contractions and impending corporate development set the stage for 2014 and beyond
 Q1 2014 OFFICE MINNEAPOLIS-ST. PAUL OFFICE MARKET REPORT Major tenant contractions and impending corporate development set the stage for 2014 and beyond SF Absorbed Percent Vacant MARKET INDICATORS Q1
MANHATTAN MARKET REPORT
 MANHATTAN MARKET REPORT Q1 MANHATTAN MARKET REPORT 1Q 2017 Manhattan s residential market is showing signs of improvement after a period of uncertainty leading up to the Presidential election, as it does
Quarterly Market Report
 HOUSTON OFFICE JANUARY 2018 EXECUTIVE SUMMARY Office Market Shows Signs of Improvement Houston s overall vacancy rate remained relatively unchanged at 20.7% in, a decrease of 10 basis points quarter-over-quarter,
MULTIFAMILY MARKET ANALYSIS
 MULTIFAMILY MARKET ANALYSIS EVAN ABRAMOWITZ RMLS Student Fellow Master of Real Estate Development Graduate Student In late November, the National Association of Realtors indicated that Portland had the
Second Quarter Industrial Market Report 2017
 Second Quarter Industrial Market Report 2017 03 04 04 04 05 06 08 09 10 11 13 Executive Summary National Economy Local Economy Oklahoma City Industrial Market Leasing Net Absorption and Inventory Rental
CoStar Office Statistics. Y e a r - E n d Denver Office Market
 CoStar Office Statistics Y e a r - E n d 2 0 1 6 Year-End 2016 Denver Table of Contents Table of Contents................................................................. A Methodology......................................................................
CoStar Industrial Statistics. Y e a r - E n d Brownsville/Harlingen Industrial Market
 CoStar Industrial Statistics Y e a r - E n d 2 0 1 7 Brownsville/Harlingen Industrial Market Brownsville/Harlingen Industrial Market Year-End 2017 Brownsville/Harlingen Table of Contents Table of Contents.................................................................
The CoStar Office Report
 The CoStar Office Report Y E A R - E N D 2 0 0 8 YEAR-END 2008 PHOENIX Table of Contents Table of Contents.................................................................... A Methodology........................................................................
Time for Retail to Take Stock
 Q1 2013 RETAIL LAS VEGAS NEVADA RESEARCH & FORECAST REPORT Time for Retail to Take Stock It is heartening to say, after five years of a bad economy, that the first quarter of 2013 s 119,649 square feet
Upstate, SC 2Q17. Industrial Market Report. Q2 Industrial. Upstate Economy in 2Q17* Industrial Sector in 2Q17. Trends for 2Q17
 Upstate, SC 2Q17 Industrial Market Report The industrial market for the Upstate of South Carolina saw continued growth for the second quarter of 217. While there was a positive net absorption of 67,53
Industrial Market Report
 Industrial Market Report West Michigan Q4 - Year End 017 Wisinski of West Michigan Commercial Real Estate Services, Worldwide. 100 Grandville Ave SW Suite 100 Grand Rapids, MI 49503 616. 776. 0100 www.naiwwm.com
Summary. Houston. Dallas. The Take Away
 Page Summary The Take Away The first quarter of 2017 was marked by continued optimism through multiple Texas metros as job growth remained positive and any negatives associated with declining oil prices
Economic Overview DENVER INDUSTRIAL/FLEX MARKET MONITOR FIRST QUARTER Denver s industrial flex market vibrant during the first quarter.
 Economic Overview DENVER INDUSTRIAL/FLEX MARKET MONITOR FIRST QUARTER 2015 Denver s industrial flex market vibrant during the first quarter. The Denver industrial market has record high asking rental rates,
FOR SALE IRONS MANOR 946 NE 126TH ST, NORTH MIAMI, FL PRESENTED BY:
 FOR SALE 946 NE 126TH ST, NORTH MIAMI, FL 33161 PRESENTED BY: Matthew Rotolante, CCIM, SIOR Calum Winsor 305.235.1500 x1006 305.235.1500 x1008 mrotolante@lee-associates.com cwinsor@lee-associates.com EXECUTIVE
OFFICE QUICK STATS SUMMARY & OUTLOOK MARKET TRENDS VACANCY & NET ABSORPTION ECONOMIC STATS
 LOS ANGELES CENTAL/SOUTHEAST OFFICE THIRD QUARTER 218 QUICK STATS Direct Vacancy 14.7% Overall Vacancy 15.2% Lease Rate FSG $3.16 Gross Absorption Under Construction MARKET TRENDS Change from Last Quarter
INDUSTRIAL QUICK STATS SUMMARY & OUTLOOK MARKET TRENDS VACANCY & NET ABSORPTION ECONOMIC STATS. Current Quarter. Direct Vacancy 2.
 ORANGE COUNTY INDUSTRIAL SECOND QUARTER 218 QUICK STATS Direct Vacancy 2.2% Overall Vacancy 2.5% Lease Rate NNN $.95 Gross Absorption Under Construction MARKET TRENDS Current Quarter 2,956,71 SF 1,367,18
Good Year, Poor Quarter
 Q4 2013 RETAIL LAS VEGAS NEVADA RESEARCH & FORECAST REPORT Good Year, Poor Quarter After nine quarters of positive net absorption, Southern Nevada s retail market fell into negative net absorption territory
OFFICE QUICK STATS SUMMARY & OUTLOOK MARKET TRENDS VACANCY & NET ABSORPTION ECONOMIC STATS
 LOS ANGELES NORTH OFFICE FOURTH QUARTER 217 QUICK STATS Direct Vacancy 11.8% Overall Vacancy 12.5% Lease Rate FSG $2.75 Gross Absorption Under Construction MARKET TRENDS Current Quarter 1,6,941 SF 89,158
Washington, D.C. Quarterly Market Report. 4th Quarter lpcwashingtondc.com
 Washington, D.C. Quarterly Market Report th Quarter 17 Table of Contents Washington, D.C. Leasing & Market Research Metropolitan D.C. Market Overview...3 Washington, D.C. Quarterly Overview...5 Washington
HISTORICAL VACANCY VS RENTS. Downtown Los Angeles Office Market Q Q RENTS VACANCY $31 2Q10 2Q11 2Q12 2Q13 2Q14
 www.colliers.com/losangeles OFFICE LOS ANGELES MARKET REPORT Rate Decrease Below 20% As Market Activity Remains Flat MARKET OVERVIEW MARKET INDICATORS - VACANCY 19.5% The Downtown Los Angeles market in
CoStar Office Statistics. Y e a r - E n d McAllen/Edinburg/Pharr Office Market
 CoStar Office Statistics Y e a r - E n d 2 0 1 7 McAllen/Edinburg/Pharr Office Market Year-End 2017 McAllen/Edinburg/Pharr Table of Contents Table of Contents.................................................................
Industrial Market Report
 Industrial Market Report West Michigan Q2 2018 Wisinski of West Michigan Office Industrial Retail Multi-Family GRAND RAPIDS The Market 1,058,079 Total Population 130+ International Companies $60,212 Average
Homestretch: Office Market Set to Finish Strong
 Research & Forecast Report RENO OFFICE Q3 2016 Homestretch: Office Market Set to Finish Strong >> Vacancy drops significantly the largest drop quarter over quarter in 2016 >> Rental rates are not increasing
MARKETBEAT Columbus. Office Q1 2018
 COLUMBUS OFFICE Economic Indicators Q1 17 Q1 18 Unemployment 4.1% 3.8% Ohio Unemployment 5.1% 4.6% U.S. Unemployment 4.7% 4.1% Market Indicators (Overall, All Classes) Q1 17 Q1 18 Overall Vacancy 12.2%
MARKET SUMMARY MICHIGAN, METRO DETROIT AREA FOURTH QUARTER 2016 P LAN T E M OR AN CRES A. pmcresa.com
 FOURTH QUARTER 2016 MICHIGAN, METRO DETROIT AREA MARKET SUMMARY P LAN T E M OR AN CRES A 26300 NORTHWESTERN HIGHWAY SOUTHFIELD, MI 48076 248.223.3500 pmcresa.com Connect with us for more information: Subscribe
Las Vegas Valley Executive Summary
 ARROYO MARKET SQUARE Las Vegas Valley Executive Summary Retail Market 4th Quarter 2013 THE DISTRICT AT GREEN VALLEY RANCH January 23, 2014 Re: Commercial Real Estate Survey: 4th Quarter, 2013 Dear Reader,
Market Research. OFFICE First Quarter 2010
 colliers international LAS VEGAS, NV Market Research OFFICE First Quarter 2010 Market Indicators Net Absorption Construction Rental Rate Q1-10 Q2-2010 Projected Clark County Economic Data Jan-10 Jan-09
INDUSTRIAL MARKET ANALYSIS
 INDUSTRIAL MARKET ANALYSIS A. SYNKAI HARRISON Portland State University CoStar reports that speculative development in the industrial market in Portland is on the rise due to a lack of inventory. Many
Second Quarter: Suburban Maryland s Uptick in Leasing has yet to be Realized in Absorption Numbers
 Q2 2013 OFFICE SUBURBAN MARYLAND SUBURBAN MARYLAND MARKET REPORT Second Quarter: Suburban Maryland s Uptick in has yet to be Realized in Numbers Updated May 2012 MARKET INDICATIONS Q2 2013 Q3 2013 (p)
Former Marsh Neighborhood Market
 FOR SALE OR LEASE 7301 MAPLECREST ROAD, FORT WAYNE, INDIANA 46835 PROPERTY INFO ADAPTIVE REUSE READY! Develop this Class A box store into single or mixed use. Prospective users include: anchor retail,
INDUSTRIAL QUICK STATS SUMMARY & OUTLOOK MARKET TRENDS VACANCY & NET ABSORPTION ECONOMIC STATS. Current Quarter. Direct Vacancy 2.
 LOS ANGELES NORTH INDUSTRIAL THIRD QUARTER 218 QUICK STATS Direct Vacancy 2.3% Overall Vacancy 2.6% Lease Rate NNN $1.1 Gross Absorption Under Construction MARKET TRENDS Current Quarter 1,632,564 SF 595,199
Portland Multifamily Market
 Portland Multifamily Market According to Norris, Beggs & Simpson s First Quarter 2009 Multifamily Report, the overall multifamily vacancy rate has increased in the first quarter to 4.96% compared to 3.80%
101 E Washington Street, Ste 400 Greenville, SC Q 18. Market Report
 101 E Washington Street, Ste 400 Greenville, SC 29601 2Q 18 Market Report GREENVILLE/SPARTANBURG 2Q18 OFFICE REPORT * MARKET SUMMARY The Greenville Spartanburg Office market remained fairly steady at the
Columbus MARKETBEAT. Office Q2 2017
 COLUMBUS OFFICE Economic Indicators Market Indicators Q2 16 Q2 17 Unemployment 4.0% 3.9% Ohio Unemployment 5.0% 5.0% U.S. Unemployment 4.9% 4.4% Q2 16 Q2 17 Overall Vacancy 13.3% 13.4% 212K -80K Construction
The CoStar Industrial Report
 The CoStar Industrial Report M I D - Y E A R 2 0 1 0 Houston Industrial Market Houston Industrial Market MID-YEAR 2010 HOUSTON Table of Contents Table of Contents....................................................................
Office Market Heats Up as Temperatures Cool
 Research & Forecast Report RENO OFFICE Q3 2017 Office Market Heats Up as Temperatures Cool >>Vacancy decreased to 11.8% >>Positive net absorption of 36,041 square feet >>Construction is imminent with limited
The CoStar Office Report
 The CoStar Office Report Y E A R - E N D 2 0 0 9 YEAR-END 2009 SALT LAKE CITY Table of Contents Table of Contents.................................................................... A Methodology........................................................................
MARKET INDICATORS Q Q TOTAL 2,909,848 IN DEALS
 Research & Forecast Report DETROIT & ANN ARBOR OFFICE Q1 2017 OFFICE ENDS ON A STRONG NOTE Peter McGrath Metro Detroit s office market reported a strong first quarter, carrying over the previous quarter
Year End Deliveries Drive Leasing Activity In the Raleigh-Durham Market
 Research Report RALEIGH-DURHAM OFFICE Q4 2018 Accelerate Success Year End Deliveries Drive Leasing Activity In the Raleigh-Durham Market Kelsey Rogers Senior Research Analyst Raleigh-Durham Market Indicators
Strong Industry and Robust Development Benefit Industrial Market at Mid-Year 2016
 Research & Forecast Report NASHVILLE INDUSTRIAL 2nd Quarter 2016 Strong Industry and Robust Development Benefit Industrial Market at Mid-Year 2016 2Q 2016 Summary > > The tightening market coupled with
Housing: Where The Action Is. Presented by: Mary Bujold Maxfield Research Inc.
 Housing: Where The Action Is Presented to: Sensible LandUseCoalition Presented by: Mary Bujold Maxfield Research Inc. February 26, 2014 Headlines 2013: Widespread Market Recovery Twin Cities Housing Market
MULTIFAMILY MARKET ANALYSIS
 MULTIFAMILY MARKET ANALYSIS Portland State University Effective rent growth climbs in Q2 but continues downward annual trend. Occupancy remains relatively steady and slightly above long-term average. Rent
Madison Market Recap 2017 Q3
 Madison Market Recap 2017 Q3 INDUSTRIAL OFFICE RETAIL NAI MLG COMMERCIAL 608 663 6000 4602 S BILTMORE LANE, SUITE 117, MADISON, WI 53718 MLGCOMMERCIAL.COM M A D I S O N, W I Market Recap 2017 Q3 Office
2012 Profile of Home Buyers and Sellers New Jersey Report
 Prepared for: New Jersey Association of REALTORS Prepared by: Research Division December 2012 Table of Contents Introduction... 2 Highlights... 4 Conclusion... 7 Report Prepared by: Jessica Lautz 202-383-1155
CoStar Office Statistics. Y e a r - E n d Portland Office Market
 CoStar Office Statistics Y e a r - E n d 2 0 1 7 Year-End 2017 Portland Table of Contents Table of Contents................................................................. A Methodology......................................................................
THE TUCSON OFFICE MARKET 2011 OVERVIEW & 2012 FORECAST
 THE TUCSON OFFICE MARKET 2011 OVERVIEW & 2012 FORECAST Usually an historical context is provided when reporting on the state of the office market. Our reports over the last 25 years have done just that.
Market Segmentation: The Omaha Condominium Market
 Market Segmentation: The Omaha Condominium Market Roger P. Sindt Steven Shultz University of Nebraska at Omaha Introduction A highly visible and growing niche in the homeownership market is the condominium
KEY TOWER SALE highlights start of 2017
 KEY TOWER SALE highlights start of 2017 Demand for office space in the Greater Cleveland office market remained strong as 2016 wound down and transitioned into the first quarter of 2017. After netting
BOSTON INDUSTRIAL MARKET
 BOSTON INDUSTRIAL MARKET FIRST QUARTER 217 INDSTATUS WAREHOUSE SPACE Inside... Manufacturing market posts largest absorption in more than a year Warehouse rents reach highest price since 24 Six consecutive
Suburban Boston Industrial MarketView
 Suburban Boston Industrial MarketView CBRE Global Research and Consulting U.S. UNEMPLOYMENT 7.6% MA UNEMPLOYMENT 7.0% OCCUPIED SF 122.5M AVAILABILITY 19.7% SUBLEASE SF 2.6M UNDER CONSTRUCTION 170K *Arrows
Greater Boston Industrial Finishes 2015 with a Bang
 MARKETVIEW Boston Suburban Industrial, Q4 2015 Greater Boston Industrial Finishes 2015 with a Bang Vacancy 9.8% Availability 13.4% Occupied Sq. Ft. 128.7 MSF Sublease 0.9 MSF Figure 1: Industrial Vacancy
CoStar Industrial Statistics. Y e a r - E n d McAllen/Edinburg/Pharr Industrial Market
 CoStar Industrial Statistics Y e a r - E n d 2 0 1 7 McAllen/Edinburg/Pharr Industrial Market Year-End 2017 McAllen/Edinburg/Pharr Table of Contents Table of Contents.................................................................
Suburban Boston Office MarketView
 Suburban Boston Office MarketView CBRE Global Research and Consulting U.S. UNEMPLOYMENT 6.7% MA UNEMPLOYMENT 7.1% OCCUPIED SF 92.9M AVAILABILITY 20.3% SUBLEASE SF 2.6M UNDER CONSTRUCTION 1.6M *Arrows indicate
Colliers International Indiana Region
 Colliers International Indiana Region FIRST QUARTER 2011 INDUSTRIAL MARKET REPORT Q1 2011 INDUSTRIAL COLLIERS INTERNATIONAL INDIANA REGION RESEARCH & FORECAST REPORT Flourishing Developments and Company
MARKETBEAT Columbus. Office Q4 2018
 COLUMBUS OFFICE Economic Indicators Q4 17 Q4 18 Unemployment 4.0% 4.0% Ohio Unemployment 4.9% 4.6% U.S. Unemployment 4.1% 3.7% Market Indicators (Overall, All Classes) Q4 17 Q4 18 Overall Vacancy 14.3%
Cranes are Lifting Skylines and Future Vacancy
 MARKET REPORT NORTHERN VIRGINIA OFFICE Fourth Quarter 2016 Cranes are Lifting Skylines and Future Vacancy Northern Virginia continued to see increased demand in the fourth quarter, although 2016 numbers
3 RD QUARTER 2016 RICHMOND RETAIL MARKET REPORT FORECAST 5.3% VACANCY 349,524 SF UNDER CONSTRUCTION (137,905) SF NET ABSORPTION
 SF NET ABSORPTION") 3 RD QUARTER 2016 RICHMOND RETAIL MARKET REPORT FORECAST All signs indicate a stabilized market that continues to support well-located new development. The majority of absorption in the 3rd quarter was
3 RD QUARTER 2016 RICHMOND RETAIL MARKET REPORT FORECAST All signs indicate a stabilized market that continues to support well-located new development. The majority of absorption in the 3rd quarter was
CoStar Office Statistics. M i d - Y e a r Portland Office Market
 CoStar Office Statistics M i d - Y e a r 2 0 1 7 Mid-Year 2017 Portland Table of Contents Table of Contents................................................................. A Methodology......................................................................
FOR SALE SINGLE TENANT OFFICE BUILDING 100% LEASED
 FOR SALE SINGLE TENANT OFFICE BUILDING 100% LEASED For more information please contact: JANINE IRVIN, CCIM MARK IRVIN CCIM, SIOR Phone: (520) 620-1833 Facsimile: (520) 620-1830 Email: mark@markirvin.com
Brooklyn Rental Market Report April 2015 mns.com
 Brooklyn Rental Market Report April 2015 TABLE OF CONTENTS 03 Introduction 04 A Quick Look 05 Mean Brooklyn Rental Prices 10 Brooklyn Price Trends 11 Neighborhood Price Trends 11 Bay Ridge 12 Bedford-Stuyvesant
The CoStar Office Report. T h i r d Q u a r t e r Greensboro/Winston-Salem Office Market
 The CoStar Office Report T h i r d Q u a r t e r 2 0 1 4 Greensboro/Winston-Salem Office Market Third Quarter 2014 Greensboro/Winston-Salem Table of Contents Table of Contents.................................................................
Wisinski of West Michigan. Market Report. Greater Kalamazoo Q Office Industrial Retail Multi-Family
 Wisinski of West Michigan Market Report Greater Kalamazoo Q2-2017 Office Industrial Retail Multi-Family KALAMAZOO, MI The Market 262,866 Population $47,695 Median Household Income 35.1% Workforce with
RALEIGH-DURHAM MULTIFAMILY Q Unprecedented Investment Sales Crush All-Time Records in Research & Forecast Report.
 Research & Forecast Report RALEIGH-DURHAM MULTIFAMILY Q4 2015 Unprecedented Investment Sales Crush All-Time Records in 2015 Market Indicators Relative to prior period - Q4 2014 - Q4 2015 Emily Bostic Research