YEARS DOWNTOWN PLAN MONITORING REPORT
|
|
|
- Samson Ward
- 6 years ago
- Views:
Transcription


1 YEARS DOWNTOWN PLAN MONITORING REPORT SAN FRANCISCO PLANNING DEPARTMENT JUNE 2011
2 2011 San Francisco Planning Department 1650 Mission Street, Suite 400 San Francisco, CA
3 25 YEARS: DOWNTOWN PLAN MONITORING REPORT San Francisco Planning Department June 2011
4 Table of Contents EXECUTIVE SUMMARY Years: Downtown Plan 01 Economic Change and Unexpected Trends 02 Regional Context and What Lies Ahead YEARS: DOWNTOWN PLAN MONITORING REPORT, Report Organization 03 PART I: THE DOWNTOWN PLAN: GOALS ACHIEVED 05 Introduction 05 Space for Commerce 08 New Commercial Construction Downtown 08 Downtown Commercial Space Today 10 Space for Housing 12 New Housing Downtown 12 Jobs Housing Linkage Program (JHLP) 14 Protecting Existing Housing Downtown 16 Downtown Housing Today 17 Open Space 18 Downtown Open Space Today 20 Historic Preservation 21 Downtown Historic Preservation Today 21 Urban Form 23 Downtown Urban Form Today 24 Moving About Transportation 25 Downtown Transportation Today 26 PART II: ECONOMIC CHANGE AND REGIONAL GROWTH SINCE San Francisco Employment Change from Office to Other Activities 28 Sole Proprietors Shift from Large to Smaller Employers 28 Downtown Area Employment A Change in Location 33 Downtown C-3 Zone Employment Change 33 Downtown San Francisco in a Regional Context: What Lies Ahead? 34 San Francisco and the Region 34 The Downtown Plan Today and Tomorrow 35
5 APPENDICES Appendix A: Downtown Plan Objectives 37 Appendix B: Table 1: New Office Construction 38 Table 2: Larger Retail Projects 42 Table 3: New Hotel Construction 43 Table 4: Commercial to Residential Conversions 44 Table 5: New Housing Construction (10 units or more), Table 6: Jobs Housing Linkage Program Funds Collected 51 Table 7: Single Resident Occupancy Hotels Annual Inventory 52 Table 8: Open Space Created as Required by the Downtown Plan 53 Table 9: Downtown Park Special Fund Collections by Fiscal Year 54 Table 10: Historic Rated Buildings Downtown: Category I 55 Table 11: Historic Rated Buildings Downtown: Category II 60 Table 12: Historic Rated Buildings Downtown: Category III 61 Table 13: Historic Rated Buildings Downtown: Category IV 62 Table 14: Historic Rated Buildings Downtown: Category V??? 66 Table 15: Transfer of Development Rights (TDR) Summary 66 Table 16: Transit Impact Development Fund (TIDF) Collections by Fiscal Year 67 Appendix C: Downtown Plan Implementing Actions and Assessment 68 MAPS Map Downtown C-3 Zone 06 Map Downtown C-3 Zone 07 Map 3. New Commercial Development Downtown (Office, Retail, Hotel) 11 Map 4. Areas for New Housing Downtown 13 Map 5. New Housing Downtown 15 Map 6. Open Space Created by the Downtown Plan 19 Map 7. Employment Change in the Downtown Area 32 FIGURES Figure 1. New Construction Downtown 09 Figure 2. Employment Growth in San Francisco and the Bay Area 29 Figure 3. Employment Trends by Land Use 29 Figure 4. Employment Trends by Establishment Size 30 Figure 5. Sole Proprietorships by Industry 30 Figure 6. C-3 Employment Change by Land Use Sector 33 Figure 7. C-3 Employment by Industry 33

6 25 YEARS: DOWNTOWN PLAN MONITORING REPORT, When the Board of Supervisors approved the Downtown Plan in 1985, the Board also required that Downtown Plan monitoring reports be prepared periodically to keep track of and observe the impact of the Downtown Plan. This report looks back at the 25 years since the Downtown Plan was adopted and approved. It is a compilation of monitoring reports covering the period between 1985 and Implementing actions listed in the Downtown Plan are also evaluated by examining the degree to which they have been achieved. This report will then discuss the regional context and what may lie ahead for Downtown San Francisco.
7 Executive Summary 25 Years: Downtown Plan San Francisco s downtown commercial space has grown by some 26.2 million square feet since 1985 much of this within the Downtown Commercial (C-3) districts. The Downtown Plan shifted new commercial development to the South of Market (SoMa) as intended. The Plan s annual limit on new office space, institutionalized by a voter initiative, helped to manage the pace of new office development and diminished the construction of speculative office buildings. Establishing additional retail and other public serving establishments at street level was another achievement of the Downtown Plan, as was guiding new hotel construction to the Moscone Convention Center area. Together, these measures enhanced the downtown for residents, workers, and visitors. The Plan s overall housing production goals were also met, with a majority of new housing constructed in the downtown and neighboring areas as specified by the Plan. Since 1985, over 21,000 new units have been constructed in the downtown area and its environs. The Plan s efforts to protect existing housing especially affordable housing were among its greatest achievements. Today, through various rezonings supported by the Plan, Chinatown, North Beach, and surrounding residential areas remain intact, as have most single resident occupancy residential hotels (SROs) in and around downtown San Francisco. The Downtown Plan contributed to the retention of up to 29,000 units of housing and the preservation of over 19,000 rooms in SRO hotels. New open space was also created downtown as a result of the Plan. These spaces have been generally successful and well used. Many open spaces are now connected by a network of pedestrian throughways as called for by the Downtown Plan. The preservation of individual buildings and historic districts was another significant achievement of the Downtown Plan. Its historic preservation requirements have contributed to the retention of hundreds of individual buildings, as well as the character of historic districts. Moreover, new construction in conservation districts established by the Plan has generally respected the massing of existing historic structures. Also, the Transfer of Development Rights (TDR) Program has reduced development pressure to demolish historic buildings, by enabling the sale of development rights to other parcels in the C-3 district. The Plan also reinforced San Francisco s position as a top tourist destination by protecting Chinatown from downtown development. Today, Chinatown remains a major draw for tourists and visitors alike, and significantly contributes to San Francisco s vital visitor economy. Available evidence suggests that key transportation targets contained in the Plan have been achieved. Since 1985, the number of long term parking spaces has been limited and transit ridership likely increased, both important provisions of the Downtown Plan.
8 Economic Change and Unexpected Trends The Downtown Plan could not have anticipated the impact of larger economic forces on downtown San Francisco. These economic trends, among other factors, substantially affected San Francisco and the region. Downtown San Francisco remains a prime center for office based professional activities, but employment growth did not occur as expected. Regional decentralization drew most office jobs to the suburbs. A substantial amount of new job growth took place outside the downtown area in sectors Medical, Cultural, Institutional, and Educational not foreseen by the Plan. The conversion of office and other commercial space to residential units was another unexpected trend. And despite the increase in the supply of housing, affordability remains an issue. Since 1985 only 18% of housing constructed in the downtown area was affordable. Downtown Park Special Funds have not been used to acquire new land for open space in the center of the C-3 as intended. To date, these funds have only been used for open space development on existing public parcels at the edges of the Downtown C-3 district. And, although some transportation related targets have likely been met, vehicle trips entering downtown significantly increased, in direct contrast to the Plan s transportation goals. Ridesharing also declined, and while the number of long-term parking has remained stable, the amount of off-street parking has continued to grow. Regional Context and What Lies Ahead Downtown as currently envisioned by the Downtown Plan is at a point where it is largely built out, and the areas for growth are diminishing and limited. When the Downtown Plan was adopted, major pieces of infrastructure were in place or envisioned. Now, key changes have occurred and new investments are planned. The 1989 Loma Prieta earthquake severely damaged the Embarcadero Freeway. With its removal, the City was reconnected to the waterfront with a promenade, roadway and light rail line. This change also fostered the growth of downtown to the south, improving linkages to Rincon Hill and the Transbay area. The Rincon Hill Plan and Transbay Redevelopment Plan, both adopted in 2005, will guide the creation of a new residential neighborhood downtown centered on Folsom Street. The most significant project planned for the downtown however, is the new Transbay Transit Center. The Transit Center District Plan area will not only create an underground rail station to serve as the San Francisco terminus for Caltrain and the California high speed rail, but will likely include several million square feet of new commercial and residential space. While the idea for improving the Transbay Terminal has existed for a number of years, the potential for dramatically increasing transit capacity, creating new public space, and constructing several major new high rise buildings was not envisioned for the area in 1985 when the Downtown Plan was adopted. Today, the Transbay Center District Plan promises to build on the Downtown Plan, making adjustments where necessary, to ensure that the Transbay Transit Center and other infrastructure needed downtown are built. In the future, the core premise of downtown area planning must continue to be that a compact, walkable, and transit oriented downtown is the key precondition for the successful and sustainable growth of the city and the region. This planning should occur with increasing regional coordination, as it seeks to capitalize on the City s core assets including its transit infrastructure, visitor economy, and vibrant diversity. 2
9 25 Years: Downtown Plan Monitoring Report Approval of the Downtown Plan in 1985 included a requirement mandated in Chapter 10E of the San Francisco Administrative Code to conduct ongoing monitoring of the impacts of the Plan. In the 25 years since, four Downtown Plan Monitoring Reports have been prepared, with each issue changing format and focus. Nevertheless, all four reports chronicled basic monitoring requirements, noting changes in the amount of commercial space, employment, housing production, parking supply, collection and use of fees and other revenues, and historic preservation. This report represents a compilation of the Downtown Monitoring Report series and also builds on information and analysis contained in the Housing Inventory, the Commerce and Industry Inventory, the Pipeline Quarterly Report, and the Transbay Center District Plan. Report Organization This report is organized into two sections, Downtown Plan: 25 Years, and Economic Change and Regional Growth Since 1985 The first section evaluates to what extent the Plan s primary objectives were achieved. (See Appendix A for a list of Downtown Plan Objectives.) This section follows the Downtown Plan s chapters, covering in turn, Space for Commerce, Space for Housing, Open Space, Preserving the Past, Urban Form, and Moving About. 1 The second section, Economic Change and Regional Growth Since 1985, explores the impact of larger economic forces on Downtown San Francisco and how these affected the ability of the Plan to achieve its objectives. The section also places Downtown San Francisco in a regional context and hints at what lies ahead. As with previoius Downtown Plan Monitoring Reports, this 25 Years Monitoring Report provides pertinent data to inform current and future policy changes. The Downtown Plan also includes development guidelines and public policy actions; furthermore, it created requirements for new programs to improve services and infrastructure. These implementating actions as listed in the Downtown Plan are evaluated separately in Appendix B. 1 The Plan also contains a section on Seismic Safety that has been fully implemented and is not discussed in this report.
10

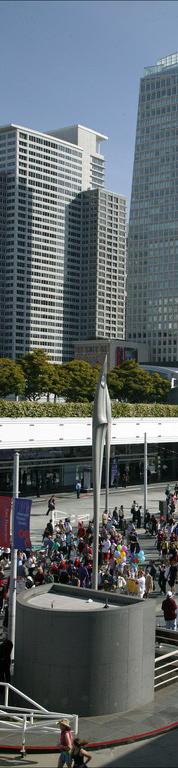
11 I. 25 Years : Downtown Plan Introduction The Downtown Plan, adopted in 1985, was developed under the fundamental assumption that significant employment and office development growth would occur. New commercial development would provide new revenue sources to cover a portion of the costs of necessary urban service improvements. Specific programs were created to satisfy needs for additional housing, transit, childcare and open space. Twenty-five years following adoption of the Downtown Plan, Downtown San Francisco remains the most concentrated employment and retail center in the Bay Area, retaining its compact and walkable form. Important architectural and historic buildings have been spared from demolition and conservation districts ensure that new buildings and modifications to older ones are in keeping with the architectural character of many downtown streets. Employment growth and development have also been managed so that new and existing residents, workers, and businesses will not be adversely impacted. Since 1985, over 26.2 million commercial square feet was built in the downtown area. 1 Of this new space, office buildings represent 19.7 million square feet, or 75%. New retail space also added 2.7 million square feet, while hotels added 3.8 million square feet in downtown San Francisco. Most of the new development occurred in the Downtown Commercial (C-3) zoned districts and in areas called for in the Downtown Plan. The Plan established a special use district near the Transbay Terminal to shift office construction to that area as a means of avoiding further disruption of the financial center north of Market. As an incentive to save older buildings and to shift construction to the South of Market (SoMa) where greater development capacity existed, the Plan enabled owners of buildings designated for preservation to sell development rights to office developers in the special use district. Much of the office growth since 1985 has occurred in the Transbay special use district. The Downtown Plan contains many more features. Open space, for instance, is required of all new office construction at a rate of one square foot of open space for each 50 square feet of office space. The shape of new buildings are evaluated using policies that reduce building bulk, increase light to the streets, control wind currents at street level, improve 1 Counting large projects only. 5


12 TAYLOR ST JONES ST BROADWAY PACIFIC AVE HYDE ST LEAVENWORTH ST MASON ST POWELL ST CHINATOWN JACKSON ST WASHINGTON ST BATTERY ST FRONT ST DAVIS ST DRUMM ST CLAY ST SACRAMENTO ST CALIFORNIA ST PINE ST UNION SQUARE MONTGOMERY ST SANSOME ST 1ST ST BEALE ST MAIN ST SPEAR ST STEUART ST FRANKLIN ST VAN NESS AVE FULTON ST GROVE ST POLK ST TURK ST BUSH ST LARKIN ST MCALLISTER ST SUTTER ST POST ST NORTH OF MARKET/ TENDERLOIN GOLDEN GATE AVE GEARY ST OFARRELL ST ELLIS ST EDDY ST STOCKTON ST GRANT AVE MARKET ST 4TH ST KEARNY ST 3RD ST MISSION ST 5TH ST 2ND ST HOWARD ST FOLSOM ST HARRISON ST BRYANT ST BRANNAN ST FREMONT ST 80 RINCON HILL TOWNSEND ST SOUTH BEACH KING ST GOUGH ST HAYES ST PAGE ST FELL ST OAK ST 12TH ST 11TH ST 10TH ST 9TH ST 8TH ST 6TH ST CENTRAL SOUTH OF MARKET 7TH ST 280 MISSION BAY 1985 DOWNTOWN C-3 ZONE 0 Miles MAP I
13 TAYLOR ST PACIFIC AVE MASON ST POWELL ST CHINATOWN SANSOME ST BATTERY ST DRUMM ST JACKSON ST JONES ST WASHINGTON ST CLAY ST SACRAMENTO ST CALIFORNIA ST LEAVENWORTH ST MONTGOMERY ST DAVIS ST FRONT ST STEUART ST SPEAR ST PINE ST UNION SQUARE BEALE ST FREMONT ST MAIN ST VAN NESS AVE POLK ST LARKIN ST HYDE ST BUSH ST NORTH OF MARKET/ TENDERLOIN SUTTER ST POST ST GEARY ST OFARRELL ST ELLIS ST EDDY ST STOCKTON ST GRANT AVE 3RD ST 2ND ST 1ST ST KEARNY ST MARKET ST FOLSOM ST RINCON HILL TURK ST 4TH ST GOUGH ST FRANKLIN ST MCALLISTER ST GROVE ST HAYES ST PAGE ST FELL ST OAK ST FULTON ST 9TH ST 10TH ST 11TH ST GOLDEN GATE AVE 8TH ST MISSION ST HOWARD ST 6TH ST CENTRAL SOUTH OF MARKET 7TH ST 5TH ST HARRISON ST BRYANT ST BRANNAN ST TOWNSEND ST KING ST 12TH ST 06TH ST MISSION BAY SOUTH BEACH 2010 DOWNTOWN C-3 ZONE Current Downtown C-3 Zone 1985 Downtown C-3 Zone 0 Miles MAP I

14 the pedestrian experience while measuring the skyline effects of tall buildings. The Downtown Plan is also associated with several requirements and fees related to office growth s impact on housing, transit, public art, childcare, and open space. The Downtown Plan guides decisions affecting downtown San Francisco, defined as the C-3 District. This report refers to the original 1985 C-3 zone, shown in Map 1, which included portions of Chinatown, SoMa, and the Tenderloin. The area covered by the C-3 zone today is shown in Map 2. SPACE FOR COMMERCE The principal section of the Downtown Plan is the Space for Commerce chapter. This section emphasizes the creation and expansion of office-based employment, especially in professional activities including legal, finance, and insurance, and identifies downtown San Francisco as the region s employment center. It calls for concentrating commercial development to create a dense, walkable employment core. The Downtown Plan, as modified by Proposition M, limited annual office space approvals to 950,000 square feet. Unused annual office space can roll over and accumulate over time, allowing for annual approvals to exceed this amount. Additionally, this key section of the Plan called for various rezonings to encourage street-level activity by requiring ground floor retail, the rezoning of Chinatown to protect it from commercial encroachment, and the retention of space for support commercial activities. New Commercial Construction Downtown Since the adoption of the Plan in 1985, San Francisco built millions of new commercial square feet much of it in the C-3 zone. Counting just large projects, 135 buildings representing an estimated 26.2 million square feet were constructed in the downtown area (Map 3). Approximately 18.7 million square feet in 80 buildings was constructed in the existing C-3 zone. Most of this construction (75%) was in office buildings (Figure 1). (See Appendix B, Tables 1-3 for lists of major new commercial construction including office, retail and hotel). Zoning changes called for by the Plan were also established. These changes promoted the visitor economy by requiring additional ground floor retail, preserving Chinatown, and guiding new hotel construction to the Moscone Convention Center area. The C-3-S (Downton 8
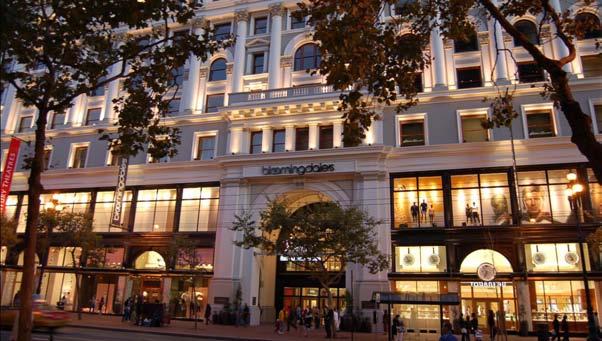
15 Office 75% 19,700,000 Retail 10% 2,700,000 Figure 1 Major New Construction Downtown Hotel 15% 3,800,000 Source: Department of Building Inspection, Planning Department Support) zone was also established to provide space for support commercial activities. Office Since 1985, a total of 19.7 million square feet of office was constructed in large projects in the downtown area. Of this space, 12.6 million was constructed in the C-3 zone, or 64%. Nearby, SoMa and Mission Bay each added approximately 1.3 million square feet of office space. Some notable office buildings constructed during this period include the Life Sciences complex in Mission Bay, Letterman Digital Arts in the Presidio, and in downtown the Federal Building, Rincon Center, and 560 Mission. Retail A substantial amount of new retail was also created, much of it at street level as called for in the Plan. Twenty-three retail projects representing 2.7 million square feet were built since The majority of this space (89%) was built in the C-3 zone, with 65% created in the C-3-R, Downtown Retail zoning district. These retail projects include the San Francisco Center (Nordstrom), the Ferry Building Marketplace, and the Westfield Center (Bloomingdale s). Redevelopment areas produced 57% of new retail space, or over 1.5 million square feet. Nearly half of this space however (750,000 square feet), is represented by the Westfield Center project. Hotel Seventeen new hotels were completed in and around downtown since the adoption of the Plan, with all but two located in the C-3 district where 95% of new rooms were created. Together these new hotels added almost 6,180 rooms, increasing total San Francisco visitor hotel rooms to over 33,000. About 40% of new hotel rooms were built in redevelopment areas, including the San Francisco Marriott (by far the largest at 1,498 rooms) and the W Hotel. Other hotels constructed during this period include the Intercontinental, Hotel Nikko, and the Downtown Courtyard by Marriott. Beyond these, almost every hotel in the downtown area has been renovated since
16 Downtown Commercial Space Today With mandated office development caps, San Francisco did not see the level of speculative office development as other cities have experienced over the past 25 years. Prior to the annual office limit controls, an average 1.7 million square feet of office space was built annually between 1965 and Since the implementation of the office limit controls, the annual average amount of new office space approved has dropped to about 788,000 square feet. 2 New retail development reinforced the downtown retail core centered on Union Square. Indeed, San Francisco retained and expanded its status as the primary retail destination in the region. The addition of ground floor retail to many new and existing buildings contributed to the overall vitality of the downtown area. This contributed to a successful visitor economy and promoted new hotel development around the Moscone Convention Center. Along with the preservation of Chinatown, which the Plan also called for, these measures successfully promoted the retention and expansion of the City s visitor economy. Not everything, however, went as the Plan anticipated. Although San Francisco remains a prime center for regional office activities, employment in legal, finance, and other professional activities including corporate headquarters, did not expand as expected. (See the next section, Economic Change and Regional Growth, for a discussion of these changes). New high rise housing construction was concentrated in and around the downtown area, while most office development proposed in recent years was outside the C-3 district, largely in Mission Bay. Although near downtown and served by the new 3rd Street light rail, new office space in Mission Bay is built on larger blocks and provides more parking than C-3 office buildings, resulting in additional auto trips and traffic and in contrast to the Downtown Plan s goal to concentrate employment uses in a walkable core. The C-3-S support commercial zone also did not substantially retain back office activities as intended: the Plan identified these businesses as important supporting functions including wholesaling, printing, building services, secondary office space and parking. Today, some of these activities are classified as production, distribution and repair (PDR). Although in some cases economic change contributed to decline in these industries (discussed in the next section Economic Change and Regional Growth), space designated for PDR businesses was developed for other uses. Of the space produced in the C-3-S zone since 1985, 65% was office, 14% was hotel (960 rooms), 12% was residential (562 units), and 9% was retail. Much of this development occurred around the Yerba Buena and Convention Center area. Commercial to residential conversions in downtown was another unanticipated trend. Since 2006, 18 commercial buildings representing an estimated 700,000 square feet converted to 683 residential units. 3 About 64% of these conversions occurred in former C-3 district office buildings. (See Appendix B, Table 4 for a list of commercial to residential conversions). 2 Since 1985, the office space development limit has not been reached with the exception of a single year, 2000, when there were more development proposals than available space. Since then, enough office space has been available to accommodate office development is the first year commercial to residential conversion information is available. 10

17 POTRERO AVE UTAH ST VERMONT ST BROADWAY PACIFIC AVE GOUGH ST JACKSON ST WASHINGTON ST FRANKLIN ST BUSH ST SUTTER ST POST ST " GEARY ST GROVE ST HAYES ST FELL ST OAK ST VAN NESS AVE ELLIS ST EDDY ST CLAY ST LARKIN ST TURK ST GOLDEN GATE AVE FULTON ST MCALLISTER ST PAGE ST POLK ST OFARRELL ST 12TH ST SACRAMENTO ST CALIFORNIA ST PINE ST " HYDE ST " " LEAVENWORTH ST UNION SQUARE JONES ST TAYLOR ST " " HOWARD ST 9TH ST MASON ST ^ ^! POWELL ST MARKET ST 8TH ST " " " " "! " " " " ^ "! " ^ ^" " " " " " " ^!! " " " " " " " " " " " " " " "! "! " "! "! " " " "! ^ "! " " ^ ^^ ^ ^!!! " " " ^!! ^ STOCKTON ST MISSION ST 7TH ST GRANT AVE ^! " FOLSOM ST 6TH ST KEARNY ST " MONTGOMERY ST 4TH ST 5TH ST SANSOME ST! BATTERY ST ^ 3RD ST! FRONT ST 2ND ST " DAVIS ST FREMONT ST 1ST ST HARRISON ST BRYANT ST MOSCONE/ YERBA BUENA " " BRANNAN ST! ^ "! " " " " " " " " " TOWNSEND ST MAIN ST BEALE ST KING ST 03RD ST " SPEAR ST " " GOUGH ST 11TH ST 10TH ST GUERRERO ST VALENCIA ST " " 12TH ST " " " 14TH ST DE HARO ST MISSION BAY " " 15TH ST TREAT AVE 16TH ST " " NEW COMMERCIAL DEVELOPMENT DOWNTOWN Miles MAP " ^! Office Hotel Retail 1985 C-3 Boundary I 11
 residential hotels from demolition or conversion to")
.")
18 SPACE FOR HOUSING To encourage a vibrant downtown, the Plan called for the preservation of existing housing and for the majority of new housing to be located in and near the downtown area. Recognizing the potential impact of commercial encroachment, the Plan protected downtown area housing including single room occupancy (SRO) residential hotels from demolition or conversion to non-residential use. To partially meet the demand forecasted by 90,000 new jobs, the Downtown Plan sought to increase the overall supply of housing in San Francisco, with the majority located in the downtown area (Map 4). Specifically, the Plan sought to build between 1,000 and 1,500 new units annually citywide. Today, there are approximately 68,000 units in the downtown area, about 20,000 of which are in the C-3 district. The Downtown Plan envisioned a series of high-density residential neighborhoods ringing the area, enabling people to live within walking distance of the central business district. Integrating housing would reduce the burden on transit and would help to enliven the downtown throughout all hours and days of the week. New Housing Downtown San Francisco housing production averaged over 1,670 units annually since 1985, exceeding the Downtown Plan s goal for new housing construction. As shown in Map 5, more than 21,680 units in over 250 buildings were produced in downtown. Of these new units, 39% were in redevelopment areas and 18% were affordable. As specified by the Plan, the majority of new housing was developed in the downtown area, with the C-3 zone accommodating 4,140 or 19%, of all housing units downtown. 4 Notable residential buildings constructed in the downtown area since 1985 include One Rincon Hill, The Beacon at 250 King, and the Infinity. In the C-3 zone, the Paramount, Trinity Plaza 1, and the Millennium were also constructed. (See Appendix B, Table 5 for a list of new housing constructed downtown). The Downtown Plan also called for the conversion of underutilized industrial and commercial areas around downtown to residential use. It specifically identified Rincon Hill and the Van Ness corridor as areas to be rezoned for housing, and recommended that the 4 In projects of ten units or more - the 21,680 units in the downtown area represent just over half of the 41,130 units constructed citywide since

19 GUERRERO ST VALENCIA ST POTRERO AVE UTAH ST VERMONT ST BROADWAY PACIFIC AVE JACKSON ST WASHINGTON ST VAN NESS AVE FRANKLIN ST GOUGH ST CLAY ST SACRAMENTO ST CALIFORNIA ST PINE ST TAYLOR ST MASON ST SANSOME ST BATTERY ST POWELL ST STOCKTON ST GRANT AVE KEARNY ST MONTGOMERY ST FRONT ST POLK ST DAVIS ST BEALE ST MAIN ST SPEAR ST RINCON POINT BUSH ST SUTTER ST POST ST GEARY ST ELLIS ST EDDY ST TURK ST GOLDEN GATE AVE MCALLISTER ST FULTON ST GROVE ST VAN NESS HAYES ST FELL ST OAK ST PAGE ST LARKIN ST OFARRELL ST 12TH ST HYDE ST LEAVENWORTH ST JONES ST 9TH ST MARKET ST 8TH ST MISSION ST 7TH ST HOWARD ST 4TH ST FOLSOM ST 6TH ST 5TH ST CENTRAL SOMA 3RD ST YERBA BUENA 2ND ST FREMONT ST 1ST ST HARRISON ST BRYANT ST BRANNAN ST RINCON HILL TOWNSEND ST KING ST SOUTH BEACH 03RD ST GOUGH ST SOUTH VAN NESS 11TH ST 12TH ST 10TH ST MISSION BAY 14TH ST DE HARO ST 15TH ST TREAT AVE 16TH ST AREAS IDENTIFIED FOR NEW HOUSING DOWNTOWN 1985 C-3 Boundary 0 Miles MAP I 13
20 Central South of Market and South Van Ness areas be studied as potential housing areas. It also acknowledged two redevelopment areas in the downtown area that created capacity for a large number of housing units: Yerba Buena Center and Rincon Point-South Beach Redevelopment Project Areas. Rincon Hill The 55-acre Rincon Hill area was specified by the Downtown Plan to be rezoned for mixed use development and high-density housing. The area was rezoned twice since The first rezoning was adopted in 1985 and divided the Rincon Hill area into residential and commercial/industrial sub-districts. That plan was revised in 2005 to focus primarily on high-density housing and raised height limits substantially for the area. To date, some 2,530 units have been completed. Rincon Point/South Beach The Plan called for the 115-acre Rincon Point/South Beach Redevelopment Plan to be implemented in two areas near the waterfront south of downtown. This redevelopment area, adopted in 1981, has provided more than 2,800 new housing units to date. Yerba Buena The 81-acre Yerba Buena Center area has created more than 2,500 new units. More than 1,400 units are designated for low and moderate-income residents. Van Ness The Downtown Plan called for the Van Ness Avenue corridor to be rezoned for mixed use development with an emphasis on high-density housing. The Planning Department adopted the Van Ness Avenue Special Use District in 1988 that required new housing to be developed at a 3:1 residential to non-residential ratio from Golden Gate Avenue to Vallejo Street. To date, about 1,190 units of housing have been completed here. South Van Ness A portion of the South Van Ness area was rezoned as part of the Market and Octavia Plan adopted in A small portion of the area is now being studied as part of the Western SoMa planning process. To date, 330 units have been completed within the South Van Ness area identified by the Downtown Plan. SoMa (Central) The Downtown Plan also called for existing housing clusters in SoMa to be studied as places for housing retention. In 1990, the Department adopted zoning changes in the Central South of Market that preserved existing residential enclaves. To date, 3,980 new units have been completed within this area. Mission Bay Although not specifically addressed in the Plan, the redevelopment of Mission Bay has created a large number of units just outside the downtown area. In addition to a new UCSF campus and other activities, Mission Bay has produced 2,719 new units. Jobs Housing Linkage Program (JHLP) Prompted by the Downtown Plan in 1985, a program to require large office developments to partially fund affordable housing was also established. 5 Today this program is known as the Jobs Housing Linkage program, which requires all net commercial additions of 25,000 square feet or more to contribute to the fund. Since 1985, the program collected $72.3 million, partially subsidizing the construction of over 1,000 units of affordable housing. (See Appendix B, Table 6 for a list of JHLP funds collected annually). 5 Originally called the Office Affordable Housing Production Program (OAHPP). 14

21 GUERRERO ST VALENCIA ST BROADWAY GOUGH ST FRANKLIN ST VAN NESS AVE BUSH ST SUTTER ST LARKIN ST POLK ST VAN NESS PACIFIC AVE JACKSON ST WASHINGTON ST CLAY ST SACRAMENTO ST CALIFORNIA ST PINE ST POST ST GEARY ST LEAVENWORTH ST HYDE ST JONES ST TAYLOR ST MASON ST POWELL ST STOCKTON ST GRANT AVE KEARNY ST SANSOME ST MONTGOMERY ST BATTERY ST 2ND ST DAVIS ST FRONT ST MARKET ST MISSION ST FREMONT ST 1ST ST MAIN ST BEALE ST SPEAR ST RINCON POINT RINCON HILL OFARRELL ST ELLIS ST EDDY ST TURK ST GOLDEN GATE AVE MCALLISTER ST FULTON ST GROVE ST HAYES ST FELL ST OAK ST PAGE ST 12TH ST 6TH ST 8TH ST HOWARD ST FOLSOM ST 7TH ST HARRISON ST 5TH ST BRYANT ST BRANNAN ST KING ST 3RD ST GOUGH ST 12TH ST 11TH ST 10TH ST 9TH ST 4TH ST 3RD ST YERBA BUENA SOUTH BEACH CENTRAL SOMA TOWNSEND ST MISSION BAY SOUTH VAN NESS 14TH ST 15TH ST TREAT AVE POTRERO AVE UTAH ST VERMONT ST DE HARO ST 16TH ST NEW HOUSING DOWNTOWN UNITS < > C-3 Boundary (Range: units) 0 Miles MAP 05 I
22 Protecting Existing Housing Downtown At the time the Downtown Plan was adopted, existing zoning did not prevent housing conversions or demolitions. Housing was being lost in the downtown area due to on-going office and commercial development. Because of their proximity to downtown, the Plan identified the North of Market/Tenderloin, Chinatown, and North Beach areas as locations where housing was most at risk of demolition or conversion to non-residential use. Single room occupancy residential hotels (SROs) were deemed especially at risk and identified as an irreplaceable resource for affordable housing. As a result, the Plan called for the preservation of housing and supported various efforts to realize this goal. Ultimately, these efforts made demolition and conversion of all housing subject to conditional use review and, in certain areas, prohibited this entirely. 6 Together these actions contributed to the retention of up to 29,000 units in the downtown area. Single Room Occupancy Hotels (SROs) The Downtown Plan supported regulations that prohibited the conversion or demolition of residential hotels. Today, SROs cannot convert to tourist hotels unless lost units are replaced. 7 SRO conversion and demolition controls were first enacted in 1981 after identifying the loss of residential hotels as a growing problem. In 1990, more comprehensive regulations were adopted, slowing the loss of SRO units. Enforcement however, remained difficult until 1995 when the Department of Building Inspection was charged with enforcing city laws protecting tenants against SRO conversion. 6 In 2008, Planning Code Section 317 added additional requirements and findings that the Planning Commission must make when considering any permit that involves the removal of a dwelling unit (Ord , approved 04/17/08). 7 Controls prohibiting the conversion and demolition of residential hotel units were first enacted in 1981 (San Francisco Administrative Code, Chapter 41). In 1991 these controls were substantially revised to prevent SROs from converting into non-residential uses unless they are replaced (Ord , approved 4/12/90). Today there are over 500 SRO buildings with 19,150 rooms, a 12% drop from 1989 when 21,710 rooms were counted. 8 Since then however, the number of rooms made permanently affordable through non-profit ownership has increased from 2,950 to 5,100. This was due to non-profit organizations converting tourist hotels to residential hotels and constructing new SRO buildings. (See Appendix B, Table 7 for an annual inventory of SRO rooms). Tenderloin/North of Market In the Tenderloin, the Downtown Plan called for the rezoning of the North of Market area to protect existing housing from encroachment by hotels and office buildings. 9 Specifically, the Plan supported new zoning that required conditional use approval for housing demolition or conversion above the second floor, banned new tourist hotels, and reduced heights in most areas to 80. Together these measures contributed to the preservation of 17,500 small rental apartments and residential hotel rooms, while allowing for the construction of 1,730 new units, many of which were affordable. Chinatown The Downtown Plan also called for the rezoning of Chinatown, immediately adjacent to the Downtown Financial District, to protect it from commercial encroachment. Ultimately this retained 5,500 units while allowing for the construction of 160 new units. North Beach North Beach was another area identified by the Plan where existing housing could be lost as employment in the adjacent Financial District expanded. In 1987, zoning changes were adopted that restricted residential conversions on the second storey and above and required conditional use approval for residential demolitions. This contributed to the retention of up to 6,000 units. 8 Department of Building Inspection is the first year SRO information is available. 9 The North of Market Rezoning Study Plan was released by the Planning Department in 1983 outlining a series of controls to preserve existing housing including rezoning the neighborhood to ban commercial development above the second floor, ban all new tourist development, and limit the height of new buildings in much of the area to 80 feet. 16
23 Downtown Housing Today The Downtown Plan s overall housing production goals were met. Since 1985, new housing construction has averaged over 1,670 units per year, exceeding the Plan s goal of building between 1,000 to 1,500 new units annually. The majority of this housing, or 53%, was produced in and around downtown as specified by the Plan. Recognizing that existing housing in the downtown area was inherently more affordable than new construction, and that housing demand increases with job growth, the Plan s efforts to protect existing housing were especially effective. The Plan supported efforts that made demolitions and conversions of all housing subject to conditional use review, and in some areas restricted the loss of housing units within buildings by floor or prohibited this entirely. The continued existence of SRO units today and the affordable housing resource they represent, are partly due to actions supported by the Plan. Chinatown, North Beach, and surrounding residential areas remain intact because of rezonings called for in the Plan. Some housing trends however, were not anticipated by the Plan. Since 2006 the first year data is available approximately 18 buildings representing 680 units are known to have converted from commercial to residential use. Some of these conversions include the 1,575 live-work units also constructed during this period, 76% of which were located in the South of Market (SoMa) area. Housing affordability also remains an issue. Although the majority of SRO rooms have been retained, only 26% represent permanently affordable housing. Furthermore, the cost of housing in surrounding areas identified by the Plan remains high. Except for designated affordable housing in redevelopment areas, new housing created downtown tends to be expensive and have done little to meet the demand of moderate to low income households. 17

24 OPEN SPACE The Downtown Plan anticipated the need for more open space to meet downtown s projected job growth and serve the needs of employees, residents and visitors. To address this, the Plan called for the preservation and enhancement of existing open spaces and the creation of a network of additional open space through public and private efforts. To create this open space network, the Plan required that publicly accessible open space be provided for all new construction projects, including substantial additions, in the C-3 district. One square foot of open space per 50 gross square feet of building space was required for all C-3 districts, except the C-3-R (Downtown Retail) district (where the requirement is one square foot of open space per 100 square feet of building space). New office developments in the C-3 were also required to contribute $2 per square foot of building space to the Downtown Park Special Fund. These funds were designated for the acquisition and development of parks and open spaces within the C-3. The Downtown Plan also created guidelines for open space to ensure that new spaces were well designed. Location, access, landscaping, access to sunlight and other standards were all a part of these guidelines. 18
25 STOCKTON ST MONTGOMERY ST WASHINGTON ST FRONT ST DAVIS ST DRUMM ST CLAY ST GRANT AVE SACRAMENTO ST SPEAR ST KEARNY ST CALIFORNIA ST PINE ST SANSOME ST BATTERY ST MARKET ST STEUART ST MAIN ST BUSH ST 1ST ST SUTTER ST POST ST FREMONT ST BEALE ST FOLSOM ST POWELL ST ELLIS ST GEARY ST OFARRELL ST 4TH ST 3RD ST MISSION ST 2ND ST HOWARD ST HARRISON ST BRYANT ST BRANNAN ST 5TH ST OPEN SPACE CREATED BY THE DOWNTOWN PLAN Feet MAP 06 1,000 Plan Created Open Space Existing Open Space 1985 C-3 Boundary I 19
26 Downtown Open Space Today Since 1985, 27 open spaces were created or enhanced as part of the Downtown Plan requirements (Map 6). These spaces include a 13,848 square foot urban garden at 560 Mission, an 11,140 square foot plaza at 555 Mission, and three plazas as part of the Foundry Square development at Howard and 1st Street. (See Appendix B, Table 8 for a list of Open Space created by the Plan). In general, downtown open spaces have been successful. Publicly and privately funded projects have created attractive spaces that are generally well-used. Developments have utilized a range of open space types, from plazas to roof gardens to walkways. Indoor spaces, roof gardens, and view terraces, which are required to be open to the public during normal working hours and to have street-level signs identifying the public space, generally meet those criteria. Public art is integrated into the design of many spaces, such as the roof garden at 150 California Street or the plaza at 199 Fremont Street. Because most recent development has taken place south of Market Street, many of the privately-provided small open spaces are located there, relieving somewhat an open space deficiency identified in the Downtown Plan. Most portions of the C-3 district are now within 900 feet of a downtown open space, or within one-quarter mile of a neighborhood-serving open space. Additionally, many open spaces are connected by a network of pedestrian throughways, enabling easier access to open spaces; for example, parallel pedestrian north/south walkways between First and Second and Market and Mission Streets, connect open spaces at 525 Market, 560 Mission, 55 Second and 77 Stevenson Streets. This distribution of new parks applies only to small privately-provided open spaces and not to larger new public parks, provided through the Downtown Park Special Fund. These funds, however, have been primarily used to develop parks on the outside edges of the C-3 on existing public parcels and not to acquire new lands for open space in the heart of the C-3 as was envisioned in the Downtown Plan. The Plan allows for the funds to be used for acquisition and/or development of open spaces, but to date they have only been used for open space development. Since 1985, contributions to the Downtown Park Special Fund totaled $10,995,904 million. This amount was collected from 27 new office buildings to provide more public open space in the downtown area. (See Appendix B, Table 9 for a list of funds collected annually). Some open spaces are also less well-used due to their design. Many types of open space, such as plazas or view terraces, are required to provide food services but do not. Others are difficult to access or are invisible from the street. Today the distribution of open space is generally adequate. If the downtown residential population continues to expand however, new residents will need neighborhood parks and recreation areas, not just the intimate urban spaces created by the Plan. As the residential population expands downtown, open space policies should evolve to create appropriate spaces. 20

27 HISTORIC PRESERVATION Another important aspect of the Plan is the preservation of historic buildings and districts. It identified significant buildings that must be retained as well as buildings regarded as contributory and encouraged for retention. The Plan established conservation districts with design guidelines for new buildings to promote compatibility with the existing historic context. It also classified buildings in one of four primary categories according to their age, architectural design, and relationship to the environment. Categories I and II are considered significant buildings. They are at least 40 years old, are considered Buildings of Individual Importance, and are rated excellent in architectural design or very good in both architectural design and relationship to the environment. Categories III and IV are defined as Contributory Buildings and are rated very good in architectural design or in relationship to the environment. Buildings in these categories may not be demolished unless the property retains no substantial remaining market value or reasonable use, or presents an imminent safety hazard. If major alterations are proposed, the Planning Commission and the Historic Preservation Commission considers them, using standards that respect the architectural character of the building. All other buildings not rated in the C-3 District are identified as Category V. (See Appendix B, Tables for a list of historic rated buildings). The Plan also created conservation districts where rated buildings are clustered. In these areas, new construction is expected to match the character and scale of historic buildings. New buildings are evaluated for scale, composition and massing, materials and colors, and detailing and ornamentation. The Downtown Plan also permits the Transfer of Development Rights (TDR) from historically rated buildings in the C-3 district to new development sites in the district. Transferable development rights are calculated as the difference between the gross floor area permitted and the amount of square footage used by the historic building. Parcels that contain certified historic structures may then sell the remaining permitted square footage to another parcel within the C-3 district. The intent is to maintain development potential in the C-3 while retaining historic buildings. Revenues from the sale of development rights can then be used to preserve and improve historic structures. 21
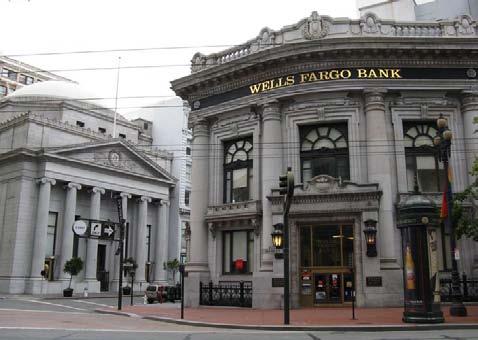
28 Downtown Historic Preservation Today The historic preservation requirements created by the Downtown Plan have contributed to the preservation of individual buildings and to the scale and character of historic districts. Since 1985, virtually all historic buildings identified by the Plan have been retained and not significantly altered so as to lose important facets of their historic nature. In recent years, several significant buildings have been rehabilitated with façade improvements and seismic upgrades. Two Category II buildings were significantly altered, including 70 Oak Street which now serves as the home for the San Francisco Conservatory of Music. The façade and concert hall remain as a reminder of the historic structure. New Construction in Conservation Districts New buildings in conservation districts have generally respected the massing of existing historic structures, especially by creating cornice lines at the level of neighboring buildings and setting back above this height. In some cases, the design of the ground-floor has not been consistent with the historic structure or district in which they are located. Although the standards and guidelines for new construction in conservation districts cover scale, composition and massing, materials and colors, and detailing and ornamentation, they do not specify ground-floor requirements. New buildings since the Plan s adoption include: 150 California Street New high-rise building in the Front/California District; six-storey massing and cornice line on the northern portion of the site aligns with historic buildings along Front Street Front Street Five-storey new building in the Front/California District; height, massing, materials and ornamentation follow the design guidelines for compatibility with neighboring historic buildings. This building and the 150 California Street structure replaced historic buildings that were demolished after the 1989 Loma Prieta earthquake. 101 Second Street New high-rise building in the Second/ New Montgomery District; cornice lines align with neighboring buildings cornices. 199 New Montgomery Street Sixteen-storey mixed use building containing 165 dwelling units and 5,000 square feet of retail at street level. This building replaces an existing surface parking lot in the New Montgomery/ Second Street Conservation District, and is compatible with the scale and materials of the District Sutter Street (Olympic Garage) A sevenstorey public parking and recreation structure, this building expands the facilities of the Olympic Club. This project replaced a four-level parking garage. The façade was designed to be compatible with surrounding buildings in the Kearny-Market-Mason-Sutter Conservation District, and is designed to look like an commercial building, not a garage. 466 Bush A 10-storey hotel with 86 guest rooms. This project replaced a vacant lot. The façade is designed to be compatible with surrounding buildings in the Kearny-Market-Mason-Sutter Conservation District. 710 Market Street/1 Kearny Street This project demolished a Category V Building, replacing an office structure, and created ground floor commercial space within the Kearny-Market- Mason-Sutter Conservation District. Transfer of Development Rights (TDR) The sale of TDR has been successful in reducing or eliminating development pressure to demolish historic resources. When the TDR program was created through the Downtown Plan, the Planning Department estimated that, based on its inventory of likely eligible historic properties, the potential supply of TDR space was approximately 8 million square feet. Since 1985, approximately 5 million square feet of TDR has been certified as eligible and 2.75 million square feet has been applied by development projects. As a result, there is approximately 2.25 million square feet of supply already certified, and about 3 million additional square feet of potential supply remaining. It is estimated that most of the 2.25 million square feet of TDRs certified, but not yet used, have been acquired by developers with projects approved or filed, but not yet built. (See Appendix B, Table 15 for a summary of TDR use by zone). 22

29 URBAN FORM The Downtown Plan makes specific recommendations for building height, bulk, and appearance for new construction in the C-3 District. The Plan considers the appearance of new construction as it relates to the skyline viewed from a distance, as well as how buildings meet the street. Specifically, the Plan calls for the clustering of tall buildings, heights that taper to surrounding districts and to the waterfront, and tower shapes that decrease in bulk as they increase in height and contain a visually interesting termination. To achieve streetscape interest, the Plan calls for buildings to come to the sidewalk edge, façades that are consistent with neighboring buildings, and avoiding blank street frontages in favor of active ground-floor uses. Additionally, the Plan uses tower height and bulk requirements to allow sun and sky access to streets, and to minimize wind exposure at street level. 23
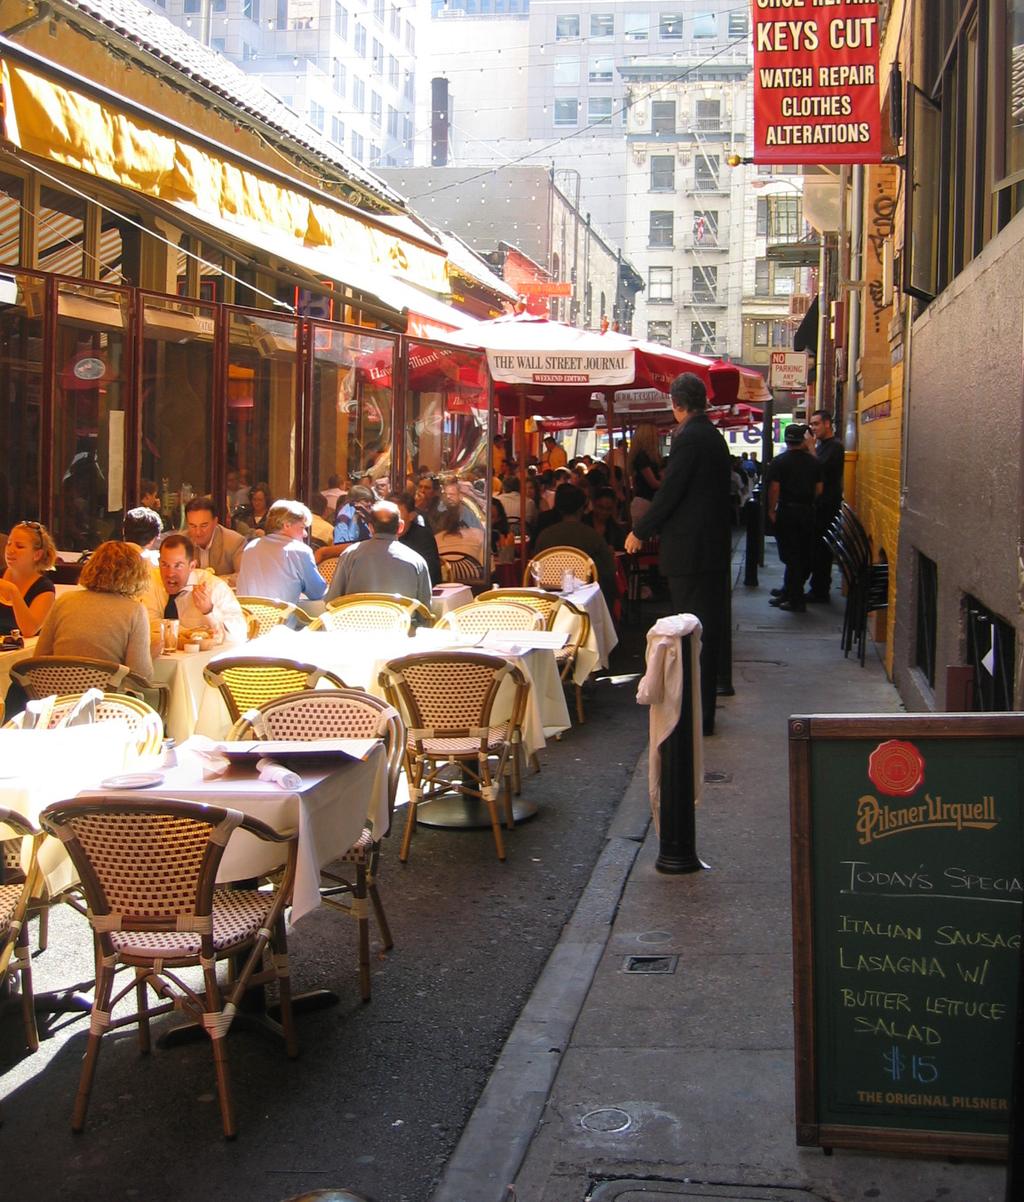
30 Downtown Urban Form Today Skyline Composition For the most part, high-rise construction within San Francisco has taken place within the downtown cluster of buildings where higher height limits are in place. With the C-3 area north of Market largely built out, most new high-rise construction since 1985 has taken place between Market and Howard Streets, moving the peak of the cluster south and retaining height as a visual element. This fulfills the intent of the Plan that places peak heights between Mission and Howard Streets. Street Level Urban Design Since 1985, most new construction was built to the sidewalk line, defining sidewalk space and creating streetscape interest. This is a positive change when compared with buildings built prior to the Downtown Plan. In the 1960s and 1970s, most structures were built away from the street, with landscaping or high arcades in front and entries located well off the street, creating blank often unusable frontage. Microclimate The Downtown Plan also sets height and massing guidelines so that buildings are oriented to maximize sun access to streets and public spaces and minimize wind exposure at street level. These requirements have resulted in maximum podium heights, related to the angle and width of the street, for new construction in certain locations. This policy has preserved sunlight in these locations at key times of the day. The Plan also contains controls to minimize high-rise construction surrounding important conservation alleys, such as Belden Alley. As a result, these streets have retained an intimately-scaled atmosphere that provides a sunny space for office workers, visitors and residents to lunch. Other alleys and pedestrian ways not identified for conservation do not contain these controls and are, as a result, less likely to have access to sunlight. Some new commercial buildings contain successful and active retail frontages and high levels of window transparency at ground levels, while others have no retail at all or dark glass at ground level. In some instances, ground level and lower level facades are not as active, visible, or clearly identified as retail spaces as they potentially could be. 24

31 MOVING ABOUT TRANSPORTATION The Downtown Plan calls for developing transit as the primary mode of transportation to and from downtown, and to accommodate employment growth without generating additional negative impacts associated with increased auto use, including traffic congestion and environmental pollution. To achieve this, the Plan sought to limit the number of long term parking spaces to the number that existed in 1985, and to increase ridesharing into downtown from 1.48 persons per vehicle to 1.66 persons per vehicle. Increasing transit share for all peak period trips into the Downtown C-3 District was another goal of the Plan. Specifically, it sought to increase transit share from 64% when the Plan was adopted to 70%. In 1981, San Francisco also enacted the Transit Impact Development Fee (TIDF) to recover transit operating and capital expansion costs incurred by expected growth. Today, this fee applies to all new non-residential developments Citywide. 25
.")
32 Downtown Transportation Today The Plan s goal to limit the number of long-term parking spaces has generally been achieved. The supply of offstreet parking has continued to grow, however. There are approximately 35,200 off-street parking spaces in the Downtown C-3 district, about 22% of the 159,700 off-street parking spaces citywide (SFMTA Parking Census 2010). Ridesharing data for downtown is not available, but trends for the larger area suggest that ridesharing declined. Transit ridership, however, increased to 72% for buildings surveyed in the Downtown Financial District in Since it was established in 1981, $137.4 million in TIDF revenues were collected to fund transit improvements. To date, the fund has been used primarily to fund operating expenses and the purchase of buses to serve the downtown. (See Appendix B, Table 16 for a list of TIDF revenues collected annually). Transportation Trends Despite progress in parking and transit improvement fund collections, vehicle trips entering the city and the downtown increased, contrary to Downtown Plan goals. If the trend in vehicle trips continues with projected job growth, additional measures may be needed to discourage driving into the downtown core. Forecast models show levels of auto traffic in the downtown reaching negative levels if significant intervention is not introduced. Many streets in the downtown are already substantially congested, especially during peak commute hours. Additional traffic congestion could impair the basic circulation of MUNI and other transit providers, and hinder local circulation and commercial activity. In addition, it can lead to unpleasant and potentially unsafe conditions for pedestrians and cyclists. The Downtown Plan established per-capita and pervehicle metrics as core transportation goals. But achieving these targets will likely not be sufficient to achieve the necessary vehicle reductions as actual cumulative trips could grow even more with continued development. Reducing traffic volumes to achieve the necessary improvements for transit, pedestrians, cycling, and public space needed to support continued growth will require additional measures not stated in the Downtown Plan. Pricing intervention, or other intervention, may be required in order to meet necessary volume reduction targets. Moreover, the reduction of traffic volume cannot wholly be achieved by regulation of quantity and pricing of parking. Much of the existing traffic originates outside of downtown and this traffic also uses area streets to access the Bay Bridge and freeways. Even if traffic is re-routed around the downtown core, it is likely that some form of intervention would also be needed to reduce volumes sufficiently to achieve the necessary improvements for transit, pedestrians, cycling, and public space required to support continued growth Transportation Management Associations Commuter Behavior Survey 26
33 II. Economic Change and Regional Growth Since 1985 Since the Downtown Plan was adopted in 1985, global and regional economic changes significantly affected growth in San Francisco. Globalization led to outsourcing, a decline in manufacturing, and a shift from larger to smaller employers. Services and technology related industries expanded the number of self-employed individuals and entrepreneurs. New jobs were created in cultural and institutional activities, especially in health care. Together these trends affected the composition and spatial pattern of downtown employment. Instead of the substantial employment growth anticipated by the Plan, San Francisco employment increased modestly. The region by contrast grew dramatically (Figure 2). Until 1975, San Francisco ranked first among Bay Area counties in employment with 33% of all jobs. By 1980, this share had declined to 22%. San Francisco is now the third largest employment center, after Santa Clara and Alameda counties, with 16% of Bay Area jobs. Rapid regional job growth occurred in office based activities, including technology related firms, as well as back offices originally located in San Francisco. 27
34 San Francisco Employment Change from Office to Other Activities The type of jobs in San Francisco also changed. By the end of the 1970s, downtown San Francisco emerged as a corporate headquarters and financial center for the West Coast. Middle-income industrial jobs declined while clerical, back office and professional service employment increased. The Downtown Plan sought to further encourage this office-based job growth. 1 But this growth did not occur. 2 As shown in Figure 3, office employment did not grow substantially. Instead San Francisco job growth was concentrated in Cultural Institutional and Educational (CIE) activities including medical employment and Retail, as large corporate headquarters and financial services moved to the suburbs and other areas. Since 1977, the percentage of San Francisco jobs in firms with more than 1,000 employees has fallen by 40% while small and mid-size business employment expanded (Figure 4). 3 Today, 23% of jobs are in firms with less than 20 employees and 29% are in firms with less than 100 employees. Sole Proprietors - Shift From Large to Smaller Employers Small business growth is evident in the number of sole proprietorships established in recent decades. Available statistics are mixed and incomplete, but suggest growth in smaller establishments as large employers declined. 4 Today, sole proprietorships are engaged in a broad range of activities including professional (28%), real estate (10%), arts and entertainment (10%), other services (9%), and health care (8%) (Figure 5). The expanding presence of these firms, and the industries they represent, does not match the large corporate activity originally envisioned by the Downtown Plan. Moreover, jobs provided by these firms are dispersed citywide with only an estimated 19% located in the downtown area. Although 39% of sole proprietors are found in neighborhood commercial areas, an estimated 26% are located in residential zones. Many are homebased businesses. Instead of the downtown-centered job growth expected in the Plan, a substantial amount of employment growth appears to have occurred in other areas of the City. 5 1 The Plan anticipated that 50% of jobs downtown would be professional, technical, administrative, or managerial; 40% clerical, sales, and service; and 10% other including trades and crafts. 2 The San Francisco Economic Strategy identifies four trends in San Francisco s occupational structure: professional and technical occupations grew; middle-income occupations, including production-related and office and administrative jobs declined; low-income service occupations grew moderately; and managerial job growth, possibly tied to a growing number of small firms that require more managers. 3 County Business Patterns - employment in each category is estimated using range mid-point. 4 Total San Francisco employment is higher than published EDD estimates, which include wage and salary jobs eligible for unemployment insurance, not Sole Proprietors. By how much however is unclear. The Bureau of Economic Analysis (BEA) estimates that up to 20% (about 152k employees) of San Francisco employment is from sole proprietors and partnerships, but this likely overstates total employment. Those who are self-employed for example, may hold more than one job and are counted by place of residence not location of work by BEA s methodology. BEA also double counts those forming multiple sole proprietorships and partnerships in the same year. For partnerships, up to four partners are counted regardless of their active involvement. Corporate directors who are corporate officers are also counted. Other total employment estimates, that include sole proprietors and partnerships, are much lower. These estimates are generally 4-6% higher than EDD statistics. For example, the American Community Survey (ACS) published by the Census Bureau, estimates total employment by means of transportation to work and includes those who work from home. ACS estimates generally match EDD data. ABAG employment estimates are derived from this Census information and include sole proprietorships and self-employed individuals. ABAG total employment estimates are up to 6% higher than information reported by EDD. Other information is available from the Census Bureau Non Employer Statistics, that reports between 1997 and 2008, the number of firms registered as sole proprietors in San Francisco increased from 63,509 to 79,348, a 25% increase. But as these statistics share BEA s residence-based methodology, firms registered in San Francisco may not operate in the City. This likely overstates the number of firms as a result. 5 Available information from Dun & Bradstreet suggests that sole proprietorships are dispersed throughout the City. 28
 Note: 1987 is the first year this data is")
35 Figure 2 Employment Growth in San Francisco and the Bay Area Source: ABAG Figure 3 Employment Trends by Land Use 250,000 +8, , , , , ,600-50,500 50,000 +3,600 0 O ffice R etail P D R H otel C IE Source: Employment Development Division (EDD) Note: 1987 is the first year this data is available. 29
36 Figure 4 Employment Trends by Establishment Size Em ployees Em ployees Em ployees Em ployees Source: Planning Department estimates based on County Business Patterns: establishment counts by firm size Figure 5 Sole Proprietorships by Industry Manufacturing 1% W holesale trade 2% A ccom m odation & food 2% Inform ation, publishers 3% T ransportation & warehousing 3% Educational services 3% Finance & insurance 4% Retail trade 5% P rofessional, technical services 28% A dm in & support 6% Construction 6% H ealth care & social assistance 8% Other services 9% Arts, entertainm ent 10% Real estate & leasing 10% Source: Census Bureau, Non-Employer Statistics
37 Downtown Area Employment A Change in Location Shifts in the location and composition of employment also occurred within the downtown area. Between 1987 and 2008, the larger Financial District area which includes part of South of Market (see Map 7 for boundaries) lost 39,700 jobs, while nearby North Beach lost 27,600 jobs. Most of this job loss was in Office and PDR but as PDR jobs downtown are mostly administrative offices for industrial firms, the decline in office employment was much greater. Together, these areas lost 67,300 jobs (Map 7). While the downtown office core lost jobs, other areas gained them including the South of Market, North Central, Southwest, and Civic Center (Map 7). This job growth however, was primarily in Cultural, Institutional and Educational activities (CIE) not Office. 6 Only in the South of Market did office jobs increase significantly by 27,100. This job growth in the South of Market contrasts with declining employment in the Financial District. While total South of Market employment increased by over 41,000, the Financial District lost a total of almost 40,000 jobs, nearly the same amount. Downtown C-3 Zone Employment Change The Downtown C-3 district mirrors this shift in the location and composition of employment. In total, the C-3 district lost about 31,000 jobs between 1981 and Office employment declined significantly by 61,800 jobs, while employment in CIE increased by 13,700 and Retail increased by 9,900. PDR employment also increased, but again these jobs are primarily administrative offices in manufacturing firms downtown, further suggesting the movement of office jobs from the Financial District to C-3 zoned areas in the South of Market (Figure 6). Classifying jobs by general land use remains a useful way to summarize citywide employment, but this does not reflect the diversity of jobs in downtown. Categorizing downtown employment by industry is more revealing. 8 Instead of a growing regional center for corporate headquarters and large office employers, downtown jobs diversified over time. Professional Services and Finance continue to provide the most employment, yet together represent only 33% of all jobs in the C-3 zone (Figure 7). 9 As of 2009 there were approximately 227,000 jobs in the original C-3 zone, fewer than when the area was surveyed for the Downtown Plan in Institutions that contributed to CIE growth include SFMOMA and California College of the Arts in SoMa; UCSF, California Pacific Medical Center and Kaiser in North Central; SF State University in the Southwest; and the Symphony, Opera, Conservatory of Music, and Academy of Art in the Civic Center area Downtown Plan employment survey. 8 Employment summarized by 2-digit North American Industrial Classification (NAICS) categories. 9 At 5% of downtown employment, adding Management of Companies and Enterprises increases this to 38% of employment employment estimated from EDD wage and salary data; 1981 employment from the Downtown Plan EIR that estimated wage and salary jobs at 258,400. The original C3 zone included portions of Chinatown, SoMa, and the Tenderloin. 31
 Office Retail PDR Hotel CIE")
38 North Beach -27,600 Van Ness -800 Financial District -39, C-3 Boundary North Central +20,900 Civic Center +8,900 South of Market +41,900 Southwest +13,400 EMPLOYMENT CHANGE IN THE DOWNTOWN AREA Miles MAP 07 1 C&I Report District (Number represents net job change) Office Retail PDR Hotel CIE I 32
39 Figure 6 C-3 Employment Change by Land Use Sector 250, , ,000-61, ,000 50,000 +9,900 +9, ,700 - O ffice R etail P D R H otel C IE ,800 Source: Downtown Plan EIR, Employment Development Department (EDD) Figure 7 C-3 Employment by Industry O ther 3% W holesale trade 1% Transportation & warehousing 3% Retail trade 6% Real estate & leasing 2% Public Adm inistration 11% Professional, technical services 18% Other services 4% M anufacturing 1% Managem ent of Com panies 5% Inform ation, publishers 4% Health care & social assistance 5% Finance & insurance 15% Educational services C onstruction Arts, entertainm ent 2% 1% 2% A dm in & support 7% A ccom m odation & food 10% 0 5,000 10,000 15,000 20,000 25,000 30,000 35,000 40,000 45,000 Source: Employment Development Department (EDD) 33

40 DOWNTOWN SAN FRANCISCO IN A REGIONAL CONTEXT: WHAT LIES AHEAD Regional economic forces affected the type and amount of employment growth originally anticipated by the Downtown Plan. Instead of office-based job growth, employment in professional activities and large corporate headquarters stabilized or declined while sole proprietors and other small employers expanded. This shift from large to small employers also changed the location of employment within San Francisco. Job growth occurred in SoMa and other areas and shifted from Office to CIE activities, while Financial District employment declined. San Francisco is no longer dominated to the extent it once was by large corporate office headquarters and is now a prime vacation and visitor destination where the experience of the City amounts to one of its greatest assets. This experience economy has established San Francisco as a center for innovation and technology that includes a substantial number of start-up firms. Yet, retaining these industries as they expand has remained a challenge. The Downtown Plan has been tremendously successful at protecting entire areas from downtown commercial encroachment, while providing additional infrastructure and improvements such as new open space. The Plan not only preserved historic districts and supported the retention of thousands of units of housing, including SROs, but by protecting Chinatown and promoting the presence of street-level retail, it substantially contributed to San Francisco s vibrant visitor economy. San Francisco and the Region The Bay Area is now intensifying efforts to grapple with the question of sustainability, particularly steps to reduce greenhouse gas emissions without stifling growth. With the passage of AB32 and SB375, there is increasing momentum to encourage transit-oriented development within every jurisdiction in the region and state. 1 Continuing to add development capacity downtown, is a prudent step toward furthering the goal of reducing the region s development footprint. Many of these issues of controlled growth were understood in 1985, and reflected in the Downtown Plan. The core premise of the Plan was that a compact, walkable, and transit-oriented downtown is the key precondition for the successful and sustainable growth of the city and the region. Future planning in the downtown area should reflect these principles and build on them, with a special focus on regional coordination. The Downtown Plan should continue the concentration of additional growth where it is most responsible and productive to do so in proximity to San Francisco s greatest concentration of public transit service. The increase in development, in turn, will continue to provide additional revenue for the necessary improvements and infrastructure downtown. 1 AB 32 mandates statewide reductions in greenhouse gas emissions, whereas SB 375 requires regions to adopt growth management land use plans that result in reduced greenhouse gas emissions. The Plan has been less successful at promoting downtown office, once seen as the primary engine of economic growth. Although downtown remains the most concentrated office employment center on the West Coast, as regional office employment dramatically expanded, office jobs downtown declined. As a result, future planning should be conducted within a regional context and focus on supporting existing businesses as well as promoting today s growth industries. 34

41 Increasing development around downtown San Francisco s transit system and increased revenues for public projects should remain core goals of the Plan, but it is also critical that policies be shaped by the values and principles of place-making that are essential to maintaining and creating what makes San Francisco a livable and unique city. The guiding principal behind planning efforts downtown in the future, should be to balance increased density with the quality of life and place considerations that define downtown and the City of San Francisco. The Downtown Plan Today and Tomorrow Much has changed in the 25 years since the Downtown Plan was adopted. Hundreds of new buildings, many of which were office, were constructed in the downtown area and beyond. Retail expanded from Union Square to south of Market Street, reinforcing the retail core and creating more active ground floor space. New hotels added thousands of rooms within walking distance of the Convention Center. But the Plan did not anticipate economic changes that affected growth in unforeseen ways. Since 1985, San Francisco s expanding visitor economy and shrinking support commercial and back-office activity reflected larger economic changes that the Plan could not have anticipated. These changes call into question some of the central assumptions that the Plan was based on, namely that downtown office would be the primary engine of San Francisco economic and employment growth, and that a policy-based Plan, implemented primarily through local zoning regulations, could shape the core economic structure of an expanding region. ( See Appendix C for a list of Downtown Plan Implementing Actions). These changes are now redefining the role of San Francisco in the region. Nevertheless, after 25 years the core principles of the Downtown Plan remain relevant. Concentrating growth in proximity to San Francisco s greatest concentration of transit service, remains the most productive and responsible place to do so. New development here will continue to provide additional revenue for the necessary improvements and infrastructure downtown. The guiding principal of planning efforts in the future should be to continue to balance increased density with the quality of life considerations that define the downtown today. 35
42 APPENDICES
CENTRAL SOMA PLAN & IMPLEMENTATION STRATEGY
 http://centralsoma.sfplanning.org CENTRAL SOMA LAN & IMLEMENTATION STRATEGY lanning Commission - August, 0 LUSK ST CLARENCE L STANFORD ST ZOE ST RITCH ST MORRIS ST OAK GROVE ST MERLIN ST LAU LAU ST MABINI
EAST SOMA AREA PLAN MONITORING REPORT
 EAST SOMA AREA PLAN MONITORING REPORT FEBRUARY 2012 East SoMa Area Plan Monitoring Report 2006-2010 Table of Contents 1. INTRODUCTION 01 2. COMMERCIAL SPACE AND EMPLOYMENT 03 2.1 Commercial Space Inventory
DOWNTOWN PLAN. This Downtown Plan annual report summarizes business and development ANNUAL MONITORING REPORT 2009
 DOWNTOWN PLAN ANNUAL MONITORING REPORT 2009 This Downtown Plan annual report summarizes business and development trends affecting Downtown San Francisco and covers the 2009 calendar year, as required by
San Francisco Planning Department April 2008
 2007 San Francisco HOUSING INVENTORY San Francisco Planning Department April 2008 1 2 3 4 1 Buena Vista Terrace, 1250 Haight St. - 40 affordable units, senior housing; conversion of historic church 2 Crescent
San Francisco HOUSING INVENTORY
 2008 San Francisco HOUSING INVENTORY San Francisco Planning Department April 2009 1 2 3 4 1 888 Seventh Street - 227 units including 170 off-site inclusionary affordable housing units; new construction
Provide a diversity of housing types, responsive to household size, income and age needs.
 8 The City of San Mateo is a highly desirable place to live. Housing costs are comparably high. For these reasons, there is a strong and growing need for affordable housing. This chapter addresses the
DOWNTOWN PLAN ANNUAL MONITORING REPORT
 DOWNTOWN PLAN ANNUAL MONITORING REPORT JULY 2015 Cover photo by: Jeremy Menzies Photographer San Francisco Municipal Transportation Agency 2015 SUMMARY & INFOGRAPHIC ii INTRODUCTION 01 The Downtown Plan
Office Development Annual Limit Program Status Update
 Office Development Annual Limit Program Status Update ULI San Francisco November 19, 2014 Annual Limit Program Overview - Outline 1. Program Overview 2. Prop M Amendments 3. Program Mechanics and Process
ET STREET CENTRAL SUBWAY PROJECT CALTRAIN EXTENSION. Folsom Boulevard WESTFIELD SHOPPING CENTRE CONT. JEWISH MUSEUM METREON MOSCONE WEST YERBA BUENA
 S PAC E S O LU T I O N S I N S O MA, S A N F R A N C I S CO STEUART ST. ANNIE ST. HAWTHORNE ST. SPEAR ST. MAIN ST. BEALE ST. FREMONT ST. FIRST ST. SECOND ST. THIRD ST. FOURTH ST. THIRD ST. ARY BLVD. T.
DOWNTOWN PLAN SEPTEMBER 2017 ANNUAL MONITORING REPORT
 DOWNTOWN PLAN SEPTEMBER 2017 ANNUAL MONITORING REPORT Cover photo by: Paolo Ikezoe San Francisco Planning Department 2016 SUMMARY & INFOGRAPHIC ii INTRODUCTION 01 The Downtown Plan 01 Report Structure
Draft for Public Review. The Market and Octavia Neighborhood Plan
 Draft for Public Review The Market and Octavia Neighborhood Plan San Francisco Planning Department As Part of the Better Neighborhoods Program December 00 . Housing People OBJECTIVE.1 MIXED-USE RESIDENTIAL
South of Market Study
 6TH 5TH 2ND 1ST FREMONT South of Market Study MAIN STEUART November 2005 MARKET 4TH MISSION 3RD HOWARD FOLSOM HARRISON THE EMBARCADERO BRYANT BRANNAN Senior Action Network Contents Introduction.5 Executive
390 Fremont St FOR LEASE > CREATIVE OFFICE SPACE RINCON/SOUTH BEACH SAN FRANCISCO HIGHLIGHTS
 HIGHLIGHTS > 8,250 SF Available Now > Full building opportunity - 2 floors > Rooftop deck > Open space/parking 3,550 SF for lease > 14ft roll up door > High exposed ceilngs and skylights - 29 clear height
DOWNTOWN PLAN ANNUAL MONITORING REPORT 2011
 DOWNTOWN PLAN ANNUAL MONITORING REPORT 2011 SAN FR A NCISCO PL A NNING DEPA RTMENT JULY 2012 Cover photo by Thomas Hawk http://www.flickr.com/photos/thomashawk/3455863438/in/set-72157619308158738 TABLE
23-story 322,434 s.f. Class A office tower Easily accessible for both public & private transportation commuters Near many prestigious restaurants,
 QUALITY & CHARACTER 23-story 322,434 s.f. Class A office tower Easily accessible for both public & private transportation commuters Near many prestigious restaurants, hotels, and private clubs Achieved
2016 SAN FRANCISCO HOUSING INVENTORY
 2016 SAN FRANCISCO HOUSING INVENTORY 2017 San Francisco Planning Department 1650 Mission Street, Suite 400 San Francisco, CA 94103-3114 www.sfplanning.org Front Cover: 1239 Turk St (Willie B. Kennedy Apartments),
U N I V E R S A L A P P E A L
 UNIVERSAL APPEAL PROPERTY FEATURES A 17-STORY CLASS A OFFICE BUILDING STRATEGICALLY LOCATED IN THE HEART OF SAN FRANCISCO S CENTRAL BUSINESS DISTRICT. 201 CALIFORNIA IS A DESTINATION FOR DYNAMIC COMPANIES
HOWARD. For Lease. Presented by Danny Yadegar Lic #
 855 HOWARD For Lease Presented by 415.432.2093 dannyyadegar@zephyrre.com context 855 Howard lies in the heart of San Francisco s South of Market District (SoMa). Built in 1922, the cast concrete building
4.13 Population and Housing
 Environmental Impact Analysis Population and Housing 4.13 Population and Housing 4.13.1 Setting This section evaluates the impacts to the regional housing supply and population growth associated with implementation
The Digital Divide in Assembly District 17: Broadband Wireline Service
 District 17 Served Underserved Unserved Total Households 228,802 2,663 155 231,620 99% 1% 0% 100% Population 461,830 4,717 954 467,501 99% 1% 0% 100% Meets and Exceeds State Goal of 98% Served Source:
Executive Summary Planning Code Text Amendment INITIATION HEARING DATE: JULY 28, 2016
 Executive Summary Planning Code Text Amendment INITIATION HEARING DATE: JULY 28, 2016 Project Name: Initiation of Planning Code Text Amendments Related to Academy of Art University (AAU). Planning Department
City of Oakland Programs, Policies and New Initiatives for Housing
 City of Oakland Programs, Policies and New Initiatives for Housing Land Use Policies General Plan Update In the late 1990s, the City revised its general plan land use and transportation element. This included
density framework ILLUSTRATION 3: DENSITY (4:1 FSR) EXPRESSED THROUGH BUILT FORM Example 1
 EXPRESSED THROUGH BUILT FORM Example 1") density framework 4 ILLUSTRATION 3: DENSITY (4:1 FSR) EXPRESSED THROUGH BUILT FORM INTRODUCTION The Downtown Core Area contains a broad range of building forms within its relatively compact area. These
density framework 4 ILLUSTRATION 3: DENSITY (4:1 FSR) EXPRESSED THROUGH BUILT FORM INTRODUCTION The Downtown Core Area contains a broad range of building forms within its relatively compact area. These
SHOWPLACE SQUARE/ POTRERO HILL AREA PLAN MONITORING REPORT
 SHOWPLACE SQUARE/ POTRERO HILL AREA PLAN MONITORING REPORT 2011 2015 2016 San Francisco Planning Department 1650 Mission Street, Suite 400 San Francisco, CA 94103-3114 www.sfplanning.org Front Cover: McClintock
Notice of Preparation of an Environmental Impact Report
 Notice of Preparation of an Environmental Impact Report Date: Case No.: 2008.1084E Project Title: 706 MISSION STREET THE MEXICAN MUSEUM AND RESIDENTIAL TOWER PROJECT Zoning: Downtown Retail (C 3 R) District
SAN FRANCISCO LEASED BY. Christopher T. Roeder License #
 0 H O WA R D S T R E E T R E M I U M C L A S S A O F F I C E I N T H E S O U T H F I N A N C I A L D I S T R I C T 0 H O WA R D S T R E E T SAN FRANCISCO F O R L E A S I N G I N F O R M AT I O N : LEASED
Table of Contents. Concept Plan Overview. Statement of Compliance with Design Guidelines. Statement of Compliance with Comprehensive Plan
 Table of Contents Concept Plan Overview Statement of Compliance with Design Guidelines Statement of Compliance with Comprehensive Plan Developer s Program Market Objective Benefit to Local Businesses Benefit
2017 SAN FRANCISCO HOUSING INVENTORY
 2017 SAN FRANCISCO HOUSING INVENTORY 2018 San Francisco Planning Department 1650 Mission Street, Suite 400 San Francisco, CA 94103-3114 www.sfplanning.org Front Cover: 588 Mission Bay Boulevard North (Five
Executive Summary Zoning Map and General Plan Amendments HEARING DATE: OCTOBER 25, DAY DEADLINE: DECEMBER 18, 2018
 Executive Summary Zoning Map and General Plan Amendments HEARING DATE: OCTOBER 25, 2018 90-DAY DEADLINE: DECEMBER 18, 2018 Project Name: Rezoning 1650-1680 Mission Street Case Number: 2018-007507MAP [Board
PLANNING DEPARTMENT. Historic Preservation Commission. Resolution No. 646 Planning Code Text Change, Zoning Map Amendment, and General Plan Amendment
 SAN FRANCISCO PLANNING DEPARTMENT Historic Preservation Commission Planning Code Text Change, Zoning Map Amendment, and General Plan Amendment HEARING DATE: JUNE 3, 2010, CONTINUED FROM: APRIL 21 AND MARCH
DeRose & Appelbaum +/ Geary Street. Santino DeRose Haley Klein. Commercial Real Estate Services. San Francisco CA SF Basement
 & Geary Street +/- 800 San Francisco CA SF Basement + CONTACT & Tenderloin The Tenderloin The Tenderloin is San Francisco s new hotspot. With a rich and fascinating history of nightlife, The Tenderloin
MarketSquareSF.com. Capital Improvements
 1 TENTH Capital Improvements 1 TENth makes its stunning debut. Building on the success of 1355 Market Street and its premier tenant roster, the newly re-clad 1 TENth will be a cutting edge structure in
Bylaw No , being "Official Community Plan Bylaw, 2016" Schedule "A" DRAFT
 Bylaw No. 2600-2016, being "Official Community Plan Bylaw, 2016" Schedule "A" Urban Structure + Growth Plan Urban Structure Land use and growth management are among the most powerful policy tools at the
NEWSLETTER. Colton Commercial & Partners, Inc. Quick Trends Statistics COLTON. State of the Market. San Francisco Q The Calm Before the Storm?
 Colton Commercial & Partners, Inc. Quick Trends Statistics The Calm Before the Storm? Citywide Average Vacancy Citywide Average Asking Rates Class A Buildings Asking Rates Class B Buildings Asking Rates
East SOMA Community Meeting Comments & Questions October 3 rd 2006
 East SOMA Community Meeting Comments & Questions October 3 rd 2006 Verbal Comments / Questions during the General Session Land Use SLI (Service Light Industrial zoning district) some people surprised to
Generic Environmental Impact Statement. Build-Out Analysis. City of Buffalo, New York. Prepared by:
 Generic Environmental Impact Statement Build-Out Analysis City of Buffalo, New York 2015 Prepared by: TABLE OF CONTENTS 1.0 INTRODUCTION 1 2.0 METHODOLOGY 2 3.0 EXISTING LAND USE 3 4.0 EXISTING ZONING
The CoStar Office Report
 The CoStar Office Report M I D - Y E A R 2 0 1 1 MID-YEAR 2011 SAN FRANCISCO San Francisco s Vacancy Decreases to 13.2% Net Absorption Positive 809,306 SF in the Quarter The San Francisco Office market
REGIONAL. Rental Housing in San Joaquin County
 Lodi 12 EBERHARDT SCHOOL OF BUSINESS Business Forecasting Center in partnership with San Joaquin Council of Governments 99 26 5 205 Tracy 4 Lathrop Stockton 120 Manteca Ripon Escalon REGIONAL analyst april
WORLD CLASS CITY. WORLD CLASS ASSET. WORLD CLASS TENANTS.
 WORLD CLASS CITY. WORLD CLASS ASSET. WORLD CLASS TENANTS. For office leasing contact: For retail leasing contact: WES POWELL ANN MONTILLA BEN LAZZARESCHI Jones Lang LaSalle Brokerage, Inc. Real Estate
Table of Contents. Title Page # Title Page # List of Tables ii 6.7 Rental Market - Townhome and Apart ment Rents
 RESIDENTIAL MONITORING REPORT 2013 Table of Contents Title Page # Title Page # List of Tables ii 6.7 Rental Market - Townhome and Apart ment Rents 21 List of Figures iii 7.0 Other Housing Demands and Trends
MarketSquareSF.com. Capital Improvements
 1 TENTH Capital Improvements 1 TENth makes its stunning debut. Building on the success of 1355 Market Street and its premier tenant roster, the newly re-clad 1 TENth is a cutting edge structure in San
APPROVED LONG-RANGE PROPERTY MANAGEMENT PLAN MAJOR APPROVED DEVELOPMENT PROJECT MISSION BAY
 APPROVED LONG-RANGE PROPERTY MANAGEMENT PLAN MAJOR APPROVED DEVELOPMENT PROJECT MISSION BAY EXECUTIVE SUMMARY The Successor Agency to the Redevelopment Agency of the City and County of San Francisco (the
Downtown Development Focus Area: I. Existing Conditions
 Downtown Development Focus Area: I. Existing Conditions The Downtown Development Focus Area is situated along Route 1, south of the train tracks, except for the existing Unilever property. It extends west
Ann Arbor Downtown Zoning Evaluation
 Ann Arbor Downtown Zoning Evaluation Options Workbook ENP & Associates in cooperation with the City of Ann Arbor September, 2013 Photo Courtesy of Andrew Horne, February 9, 2013 Introduction Thank you
M A N H A T T A N 69 THE FURMAN CENTER FOR REAL ESTATE & URBAN POLICY. Financial District Greenwich Village/Soho
 M A N H A T T A N Page Financial District 301 72 Greenwich Village/Soho 302 73 Lower East Side/Chinatown 303 74 Clinton/Chelsea 304 75 69 THE FURMAN CENTER FOR REAL ESTATE & URBAN POLICY Midtown 305 76
New condominium recorded 1,977 are down from 2013 (a decrease of 24%), however, condominium conversions are up by 98% to 730 units.
, however, condominium conversions are up by 98% to 730 units.") DATE: April 9, 2015 TO: Members, Planning Commission FROM: John Rahaim, Director of Planning RE: Transmittal of 2014 Housing Inventory STAFF CONTACT: Audrey Desmuke, 415.575.9136 The Planning Department
DATE: April 9, 2015 TO: Members, Planning Commission FROM: John Rahaim, Director of Planning RE: Transmittal of 2014 Housing Inventory STAFF CONTACT: Audrey Desmuke, 415.575.9136 The Planning Department
Memo. DATE: 20 September 2018 City Planning Commission John Rahaim, Director of Planning RE: HOUSING BALANCE REPORT No. 7 1 July June 2018
 DATE: 20 September 2018 TO: FROM: City Planning Commission John Rahaim, Director of Planning RE: HOUSING BALANCE REPORT No. 7 1 July 2008 30 June 2018 STAFF CONTACT: Teresa Ojeda, 415 558 6251 SUMMARY
Place Type Descriptions Vision 2037 Comprehensive Plan
 Place Type Descriptions Vision 2037 Comprehensive Plan The Vision 2037 Comprehensive Plan establishes a range of place types for Oxford, ranging from low intensity (limited development) Rural and Natural
LAKE MERRITT STATION AREA PLAN
 LAKE MERRITT STATION AREA PLAN Emerging Plan Open House Summary October 2011 2 1 Introduction The City of Oakland, Bay Area Rapid Transit (BART), and the Peralta Community College District, through a grant
Executive Summary (updated) Inner Mission North Survey and Mission Dolores Neighborhood Survey Historic District Themes and Boundaries
 Inner Mission North Survey and Mission Dolores Neighborhood Survey Historic District Themes and Boundaries") DATE: May 25, 2011 TO: FROM: RE: Historic Preservation Commission Matt Weintraub, Preservation Planner Comments and Responses, Inner Mission North Historic Resource Survey Case No. 2011.0401U This memorandum
DATE: May 25, 2011 TO: FROM: RE: Historic Preservation Commission Matt Weintraub, Preservation Planner Comments and Responses, Inner Mission North Historic Resource Survey Case No. 2011.0401U This memorandum
FOR LEASE 388 MARKET STREET SAN FRANCISCO, CA
 FOR LEASE 388 MARKET STREET SAN FRANCISCO, CA On-Site Amenities Fitness center (renovations planned for 2018) Five food service options on-site 24-hour lobby attendant Valet parking garage Bike storage
UCSF Mission Bay Community Task Force Meeting #1
 UCSF Mission Bay Community Task Force Meeting #1 Campus Planning 1 UCSF Planning Context Long Range Development Plan (LRDP) Our Institutional Master Plan Approved by The Regents Framework for physical
Appendix B: Housing Element Sites Inventory and Detailed Analysis
 Appendix B: 2015-2023 Housing Element Sites Inventory and Detailed Analysis Redwood City General This page intentionally left blank. Redwood City General Site Identifier Assessor Parcel Number General
REZONING GUIDE. Zone Map Amendment (Rezoning) - Application. Rezoning Application Page 1 of 3. Return completed form to
 - Application. Rezoning Application Page 1 of 3. Return completed form to") COMMUNITY PLANNING & DEVELOPMENT REZONING GUIDE Rezoning Application Page 1 of 3 Zone Map Amendment (Rezoning) - Application PROPERTY OWNER INFORMATION* PROPERTY OWNER(S) REPRESENTATIVE** CHECK IF POINT
COMMUNITY PLANNING & DEVELOPMENT REZONING GUIDE Rezoning Application Page 1 of 3 Zone Map Amendment (Rezoning) - Application PROPERTY OWNER INFORMATION* PROPERTY OWNER(S) REPRESENTATIVE** CHECK IF POINT
SAN FRANCISCO MUNICIPAL TRANSPORTATION AGENCY
 THIS PRINT COVERS CALENDAR ITEM NO.: 10.5 SAN FRANCISCO MUNICIPAL TRANSPORTATION AGENCY DIVISION: Finance and Information Technology BRIEF DESCRIPTION: Requesting that the Board of Supervisors hold a public
2300 STOCKTON FRANCISCO, CA
 2300 STOCKTON SAN FRANCISCO, CA FOR LEASE 2300 Stockton Street San Francisco, CA Alcatraz Island, Fisherman s Wharf and Golden Gate Bridge Views 2 nd Floor 23,000 SF 3 rd Floor 23,000 SF Total: 46,000
REPORT TO THE CHIEF ADMINISTRATIVE OFFICER FROM THE DEVELOPMENT AND ENGINEERING SERVICES DEPARTMENT
 REPORT TO THE CHIEF ADMINISTRATIVE OFFICER FROM THE DEVELOPMENT AND ENGINEERING SERVICES DEPARTMENT ON OFFICIAL COMMUNITY PLAN AMENDMENT APPLICATION NO. OCP00108 REZONING APPLICATION NO. REZ00578 900 MCGILL
Executive Summary Planning Code Text Amendment HEARING DATE: MAY 10, 2018
 Executive Summary Planning Code Text Amendment HEARING DATE: MAY 10, 2018 Project Name: Central SOMA Housing Sustainability District Case Number: 2018-004477PCA [Board File No. 180453] Initiated by: Mayor
Affordable Housing Bonus Program. Public Questions and Answers - #2. January 26, 2016
 Affordable Housing Bonus Program Public Questions and Answers - #2 January 26, 2016 The following questions about the Affordable Housing Bonus Program were submitted by the public to the Planning Department
MARKETWATCH MAY 2017
 MARKET WATCH San Francisco - SOMA MAY 2017 District 9 - Condos Q1-17 YoY $1.26M 2.5% Avg. Sale Price from Q1-16 SF District 9 - Condo Market Performance 5 Year Market Performance $1,063/SF -4.6% On 27
AMENDED IN BOARD 5/22/2018 RESOLUTION NO
 FILE NO. 180243 AMENDED IN BOARD 5/22/2018 RESOLUTION NO. 153-18 1 [Interim Zoning Controls - Conversion of Retail to Non-Retail Sales and Service Use in the C- 3-R Zoning District] 2 3 4 Resolution imposing
4 LAND USE 4.1 OBJECTIVES
 4 LAND USE The Land Use Element of the Specific Plan establishes objectives, policies, and standards for the distribution, location and extent of land uses to be permitted in the Central Larkspur Specific
City and County of San Francisco
 City and County of San Francisco Controller s Office FY 2009-10 Development Impact Fee Report January 24, 2011 City and County of San Francisco FY 2009-10 Development Impact Fee Report January 24, 2011
Appendix D: Economic Analysis of Rail Alternatives
 DRAFT Technical Report RAILYARD ALIGNMENT AND BENEFITS STUDY Appendix D: Economic Analysis of Rail Alternatives D RAFT M EMORANDUM To: From: Subject: Joe Speaks, CH2M Darin Smith and Jenny Lin Preliminary
M. Brett Gladstone Partner
 Brett focuses his practice on land use law and real estate transactions. He represents investors, developers, and government in land-use proceedings and CEQA compliance with respect to residential and
A n E x c e p t i o n a l S o u t h o f M a r k e t R e d e v e l o p m e n t O p p o r t u n i t y o r O w n e r / U s e r B u i l d i n g 3 4 H A R
 O FFERING MEMORANDUM A n E x c e p t i o n a l S o u t h o f M a r k e t R e d e v e l o p m e n t O p p o r t u n i t y o r O w n e r / U s e r B u i l d i n g 3 4 H A R R I E T S T R E E T S A N F R
Portland Historic Resources Zoning Regulations
 Summary of Portland Historic Resources Zoning Regulations This document summarizes important historic resources-related provisions of Portland s Zoning Code (Title 33: Planning and Zoning). Relevant sections
Appendix A: Guide to Zoning Categories Prince George's County, Maryland
 Appendix A: Guide to Zoning Categories Prince George's County, Maryland RESIDENTIAL ZONES 1 Updated November 2010 R-O-S: Reserved Open Space - Provides for permanent maintenance of certain areas of land
GENERAL PLAN UPDATE SPECIFIC AREAS OF THE CITY
 GENERAL PLAN UPDATE SPECIFIC AREAS OF THE CITY Background There are a total of 14 specific areas that are being reviewed as part of the update of the General Plan. Requests to review these areas came from
1417, , 1427 & 1429 Yonge Street - Official Plan Amendment and Zoning Amendment Applications - Preliminary Report
 STAFF REPORT ACTION REQUIRED 1417, 1421-1425, 1427 & 1429 Yonge Street - Official Plan Amendment and Zoning Amendment Applications - Preliminary Report Date: March 24, 2015 To: From: Wards: Reference Number:
The Impact of The Ellis Act. January 1, 2005 December 31, 2005
 The Impact of The Ellis Act January 1, 2005 December 31, 2005 Santa Monica Rent Control Board March 2006 IMPACT OF THE ELLIS ACT The Ellis Act allows landlords to go out of the rental business, evict tenants,
POPULATION FORECASTS
 POPULATION FORECASTS Between 2015 and 2045, the total population is projected to increase by 373,125 residents to reach 2.2 million. Some areas will see major increases, while other areas will see very
DRAFT FOR DISCUSSION PURPOSES ONLY. Port Credit Local Area Plan Built Form Guidelines and Standards DRAFT For Discussion Purposes
 Port Credit Local Area Plan Built Form Guidelines and Standards DRAFT For Discussion Purposes 1 Local Area Plan - Project Alignment Overview Directions Report, October 2008 (General Summary Of Selected
TASK 2 INITIAL REVIEW AND ANALYSIS U.S. 301/GALL BOULEVARD CORRIDOR FORM-BASED CODE
 TASK 2 INITIAL REVIEW AND ANALYSIS U.S. 301/GALL BOULEVARD CORRIDOR FORM-BASED CODE INTRODUCTION Using the framework established by the U.S. 301/Gall Boulevard Corridor Regulating Plan (Regulating Plan),
CHAPTER 7 HOUSING. Housing May
 CHAPTER 7 HOUSING Housing has been identified as an important or very important topic to be discussed within the master plan by 74% of the survey respondents in Shelburne and 65% of the respondents in
b. providing adequate sites for new residential development
 DIVISION 2.200 SECTION 2.201 INTRODUCTION A. Purpose The purpose of the Housing Element is to establish the goal, objectives, and policies to guide housing development within Polk County over the next
Summary Report on the Economic Impact of the State Center Project Baltimore, MD
 Summary Report on the Economic Impact of the State Center Project Baltimore, MD Prepared for: Maryland Department of Transportation Prepared by: BAE Urban Economics March 2011 Summary of Key Findings Phase
9 San Francisco MUNI Third Street Light Rail Project
 9 San Francisco MUNI Third Street Light Rail Project OVERVIEW: TRANSIT SYSTEM CHARACTERISTICS The San Francisco Municipal Railway (MUNI) carries 682,000 daily riders throughout San Francisco on trolley
San Francisco 4Q 16. Multifamily Report
 4Q 16 Multifamily Report 4Q 16 Multifamily Market Report Rent Increases Slowly But Still On The Rise The market for multifamily real estate in has exceeded pre-recession highs since the beginning of 213.
The Opportunity. Small and large format spaces exist in both internal and external portions of Avery Lane.
 The Opportunity At the base of an impeccably designed 68 foot tower sits the Shops at Avery Lane. The world class design is uniquely modern showcasing sophisticated materials and intriguing textures at
LAND USE. As such, the Township has estasblished the following statement of objectives for future development within its borders:
 LAND USE When creating a land use plan, a municipality should consider a process which firsts determines future population figures, whether growth or decline, and its targeted areas within the municipal
Mr. Carl Shannon, Senior Managing Director Tishman Speyer One Bush Street, Suite 450 San Francisco, CA November 21, 2014
 95 Brady Street San Francisco, CA 94103 415 541 9001 info@sfhac.org www.sfhac.org Mr. Carl Shannon, Senior Managing Director Tishman Speyer One Bush Street, Suite 450 San Francisco, CA 94104 Ref: 160 Folsom
Regional Equity and Affordable Housing
 City of Sacramento Regional Equity and Affordable Housing City Planning Academy April 21, 2014 Presentation Outline Why We Plan for Affordable Housing Distribution of Affordable Housing (Region/City) Current
HOUSING OVERVIEW. Housing & Economic Development Strategic Plan for Takoma Park Presented by Mullin & Lonergan Associates February 26,2018
 HOUSING OVERVIEW Housing & Economic Development Strategic Plan for Takoma Park Presented by Mullin & Lonergan Associates February 26,2018 Overarching Themes & Underlying Bases Takoma Park strives to be
Single Room Occupancy Hotels in San Francisco
 Single Room Occupancy Hotels in San Francisco A Health Impact Assessment Executive Summary FINAL REPORT SPRING 2017 Health Impact Assessment Program San Francisco Department of Public Health The Centers
The Digital Divide In Senate District 11: Broadband Wireline Service
 The Digital Divide In Senate District 11: Broadband Wireline Service District 11 Served Underserved Unserved Total Households 414,388 3,438 230 418,056 99% 1% 0% 100% Population 922,736 6,879 1,238 930,853
Goals, Objectives and Policies
 Goals, Objectives and Policies 1. GOAL SUPPORT THE PROVISION OF DECENT, SAFE AND SOUND HOUSING IN A VARIETY OF TYPES, SIZES, LOCATIONS AND COSTS TO MEET THE NEEDS OF CURRENT AND FUTURE RESIDENTS OF UNINCORPORATED
San Francisco Housing Market Update
 San Francisco Housing Market Update California Economic and Housing Market Outlook The national economy maintained a healthy growth rate in the first quarter of 2005 and appeared to be settling in for
HOUSING ELEMENT GOALS, OBJECTIVES, & POLICIES
 HOUSING ELEMENT GOALS, OBJECTIVES, & POLICIES GOAL H-1: ENSURE THE PROVISION OF SAFE, AFFORDABLE, AND ADEQUATE HOUSING FOR ALL CURRENT AND FUTURE RESIDENTS OF WALTON COUNTY. Objective H-1.1: Develop a
MONTGOMERY COUNTY RENTAL HOUSING STUDY. NEIGHBORHOOD ASSESSMENT June 2016
 MONTGOMERY COUNTY RENTAL HOUSING STUDY NEIGHBORHOOD ASSESSMENT June 2016 AGENDA Model Neighborhood Presentation Neighborhood Discussion Timeline Discussion Next Steps 2 WORK COMPLETED Socioeconomic Analysis
City of St. Petersburg, Florida Consolidated Plan. Priority Needs
 City of St. Petersburg, Florida 2000-2005 Consolidated Plan Priority Needs Permanent supportive housing and services for homeless and special needs populations. The Pinellas County Continuum of Care 2000
Annual (2013) Review of the Surrey Official Community Plan
 Review of the Surrey Official Community Plan") CORPORATE REPORT NO: R118 COUNCIL DATE: JUNE 23, 2014 REGULAR COUNCIL TO: Mayor & Council DATE: June 23, 2014 FROM: General Manager, Planning and Development FILE: 6440-01 SUBJECT: Annual (2013) Review
CORPORATE REPORT NO: R118 COUNCIL DATE: JUNE 23, 2014 REGULAR COUNCIL TO: Mayor & Council DATE: June 23, 2014 FROM: General Manager, Planning and Development FILE: 6440-01 SUBJECT: Annual (2013) Review
Table of Contents. Appendix...22
 Table Contents 1. Background 3 1.1 Purpose.3 1.2 Data Sources 3 1.3 Data Aggregation...4 1.4 Principles Methodology.. 5 2. Existing Population, Dwelling Units and Employment 6 2.1 Population.6 2.1.1 Distribution
Executive Summary Conditional Use and Office Development
 Executive Summary Conditional Use and Office Development HEARING DATE: NOVEMBER 1, 2012 Date: October 25, 2012 Case No.: 2012.1046 BC Project Address: 1550 BRYANT STREET Zoning: PDR-1-G (Production, Distribution,
ARTICLE 40 AFFORDABLE HOUSING DENSITY BONUS
 ARTICLE 40 AFFORDABLE HOUSING DENSITY BONUS Section 4000: Purpose. This section establishes policies which facilitate the development of affordable housing to serve a variety of needs within the City.
OFFERED AT: $4,995, Sixth Street, San Francisco, CA Premier Net Leased Boutique Retail Building in Mid-Market
 OFFERED AT: $4,995,000 26-28 Sixth Street, San Francisco, CA Property Highlights Premier Mid-Market location in the epicenter of new high-rise apartment buildings and technology companies. Proximate to
H-POLICY 1: Preserve and improve existing neighborhoods. Ensure that Prince William County achieves new neighborhoods with a high quality of life.
 HOUSING Intent The intent of the Housing Plan is to provide a framework for providing for the housing needs of all residents of Prince William County. These needs are expressed in terms of quality, affordability,
Analysis of Infill Development Potential Under the Green Line TOD Ordinance
 Analysis of Infill Development Potential Under the Green Line TOD Ordinance Prepared for the Los Angeles County Second Supervisorial District Office and the Department of Regional Planning Solimar Research
Town of Yucca Valley GENERAL PLAN 1
 Town of Yucca Valley GENERAL PLAN 1 This page intentionally left blank. 3 HOUSING ELEMENT The Housing Element is intended to guide residential development and preservation consistent with the overall values
Executive Summary Office Development Authorization
 Executive Summary Office Development Authorization HEARING DATE: AUGUST 16, 2012 Date: August 6, 2012 Case No.: 2012.0409B Project Address: China Basin Landing aka 980 Third Street & 185 Berry Street Zoning: