2011 CHICAGO SUBMARKET SNAPSHOTS
|
|
|
- Gary Black
- 6 years ago
- Views:
Transcription


1 T H I R D Q U A R T E R 2011 CHICAGO C O M P I L E D B Y M B R E A L E S T A T E
2 THIRD QUARTER 2011 CHICAGO TABLE OF CONTENTS SECTION ONE CHICAGO CENTRAL BUSINESS DISTRICT CBD 01 Central Business District Map 02 Central Loop 03 East Loop 04 North Michigan Avenue 05 River North 06 South Loop 07 West Loop SECTION ONE CHICAGO CENTRAL BUSINESS DISTRICT SUBURBAN 08 Suburban Map 09 East-West 10 North 11 Northwest 12 O Hare SECTION THREE ABOUT MB REAL ESTATE 13 Company Overview The Chicago Market Overview Submarket Snapshots are published quarterly by MB Real Estate. To obtain additional copies or for further information, please contact: KRYSTA BAVLSIK Manager of Research and Analytics or JACK GAVIN Research Coordinator 181 West Madison Street, Suite 4700 Chicago, Illinois (312)

3 CENTRAL BUSINESS DISTRICT MAP CENTRAL BUSINESS DISTRICT CHICAGO 1
4 CENTRAL LOOP Class B buildings drive occupancy increase While the Central Loop s Class A segment continues to have a direct vacancy rate under 10 percent, its Class B market has been struggling. However, Class B buildings improved with 177,000 square feet of additional occupancy during the third quarter. The demand increase translated into the Central Loop s strongest performance since early Large lease transactions were highlighted by Accretive Health s 28,000 square foot expansion at 231 South LaSalle, and The Administrative Office of the Illinois Court s renewal at 222 North LaSalle. McCorkle Court Reporters extended and expanded at 200 North LaSalle. With respect to investment sales, one major transaction closed and two other buildings were placed under contract. A joint venture led by GAW Capital Partners and the Korea Teachers Credit Union purchased 70 West Building Address Size (sf) Building Class 11 S LaSalle St 155,819 C 161 N Clark St 116,964 A 111 W Jackson Blvd 102,943 C 1 N Dearborn St 97,261 B 111 W Jackson Blvd 83,612 C 200 N LaSalle St 71,728 B 111 W Washington St * 71,718 C 120 S LaSalle St * 69,519 B 175 W Jackson Blvd * 68,539 B 175 W Jackson Blvd * 67,725 B * Indicates future available space Italicized addresses indicate new blocks this quarter Madison for $349 million, or $243 per square foot, from Hines Real Estate Investment Trust. In addition, an unidentified buyer is under contract to purchase the 440,000 square office portion of 22 West Washington for $187 million. Chicago-based Hearn Co. agreed to purchase 55 West Monroe from LaSalle Investment Management for $140 million. The Central Loop, which has historically been home to financial organizations and law firms, will see uneven demand in office space for the near-term. However, constrained supply and convenient location will keep the Central Loop s vacancy rate below most of the CBD s submarkets. CENTRAL BUSINESS DISTRICT The Central Loop s boundaries are the Chicago River (North), Wells Street (West), State Street (East), and Van Buren Street (South). CENTRAL LOOP SUMMARY A B C Total Inventory (square feet) 13,554,346 14,030,785 8,613,255 36,198,386 Year to Date Absorption (square feet) 85,930 85,487 (254,379) (82,962) Direct Vacancy Rate 9.7% 16.8% 16.8% 14.2% Total Vacancy Rate (Direct + Sublease) 12.1% 19.4% 18.5% 16.4% CENTRAL LOOP SUBMARKET HISTORICAL DIRECT VACANCY CHICAGO 2
5 EAST LOOP Robust leasing activity continues, but occupancy remains unchanged After a strong second quarter, the East Loop experienced little net change in occupancy. Several tenants within the East Loop have leveraged soft market conditions to upgrade to Class A buildings. However, such tenants are from Class B or C buildings within the East Loop and do not generate new demand for the overall submarket. The most notable example is energy company Integrys, who will vacate 196,000 square feet at 130 East Randolph and consolidate operations into 150,000 square feet at the Class A, 200 East Randolph. While this move strengthens the Class A segment, the vacancy rate for Class B buildings will rise, and another large block will hit the market. However, Class B will see some relief when OWP&P Cannon Design occupies 61,000 square feet at North Michigan Avenue, as it relocates from 111 West Washington in the Central Loop. Building Address Size (sf) Building Class 200 E Randolph St 380,158 A 303 E Wacker Dr * 271,382 B 130 E Randolph St * 185,042 B 55 E Monroe St 175,263 B 303 E Wacker Dr * 143,960 B 333 S Wabash Ave * 136,500 B N Michigan Ave 120,446 B 33 S State St 117,207 C 401 S State St 110,898 C 225 N Michigan Ave 78,498 B * Indicates future available space CommonWealth REIT, who entered the East Loop by purchasing 233 North Michigan last quarter, has agreed to purchase 111 East Wacker for $151 million. The new owners face with the challenge of leasing 200,000 square feet that will become available next year. The East Loop continues to have an uphill battle in gaining occupancy levels that match its competitive submarkets. Of the nine available, contiguous blocks greater than 100,000 square feet, five represent space that will be vacated in 2012, totaling nearly 1 million square feet. Also, short-term leases for Groupon and Obama for America are set to expire next year. Considering large block availability across the CBD and speculation regarding a new office development, it remains likely that the East Loop will continue to have a higher vacancy rate compared to the rest of the CBD. The East Loop is bordered by the Chicago River (North), State Street (West), Lake Shore Drive (East), and Van Buren Street (South). It is inhabited mostly by advertising and media firms and corporate tenants. CENTRAL BUSINESS DISTRICT EAST LOOP SUMMARY A B C Total Inventory (square feet) 4,014,487 10,207,612 8,457,711 22,679,811 Year to Date Absorption (square feet) 148,082 (3,055) (79,224) 65,802 Direct Vacancy Rate 21.9% 24.1% 13.9% 19.9% Total Vacancy Rate (Direct + Sublease) 27.4% 26.5% 14.2% 22.1% EAST LOOP SUBMARKET HISTORICAL DIRECT VACANCY CHICAGO 3

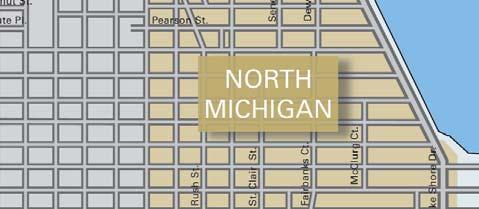
6 NORTH MICHIGAN AVENUE Activity remains slow; Wrigley Building sold Occupancy levels remained relatively unchanged as North Michigan Avenue experienced 20,000 square feet of negative absorption. This marks the eleventh consecutive quarter of occupancy declines. At 19.2 percent, the North Michigan Avenue vacancy rate has reached its highest level in MB Real Estate s tracked history. No lease transactions greater than 20,000 square feet were signed this quarter. This is significant because tenants larger than 20,000 square feet have relocated outside of the submarket. This quarter, Healthcare Information and Management Systems Society vacated 30,000 square feet at 230 East Ohio and moved to 33 West Monroe in the Central Loop. Building Address Size (sf) Building Class 330 N Wabash Ave 371,945 B 330 N Wabash Ave 97,932 C 455 N Cityfront Plaza Dr 90,207 B 740 N Rush St 73,294 B 980 N Michigan Ave 62,384 B 401 N Michigan Ave 51,870 A CENTRAL BUSINESS DISTRICT The submarket s biggest headline occurred when Groupon co-founders Brad Keywell and Eric Lefkofsky teamed with Zeller Realty Group to purchase the Wrigley Building at North Michigan Avenue for approximately $33 million. The new owners will seek landmark status and also plan significant renovations but are expected to lease the majority of the building as office space. Zeller Realty Group has also placed 500 North Michigan on the market, which could command offers between $70 and $80 million. North Michigan Avenue continues to have six blocks of direct, contiguous space greater than 50,000 square feet, including the 37th through 47th floors at 330 North Wabash, which total 372,000 square feet. Without significant job growth, demand will continue to falter. Vacancy rates are expected to remain high in light of tepid leasing activity. The North Michigan Avenue submarket is home to retailers, hotels, restaurants, entertainment venues, advertising and marketing agencies, and the large Northwestern Memorial Hospital campus. Its borders include Division Street (North), State Street (West), Lake Michigan (East), and the Chicago River (South). NORTH MICHIGAN AVENUE SUMMARY A B C Total Inventory (square feet) 3,952,669 4,634,167 4,425,684 13,012,520 Year to Date Absorption (square feet) (44,835) (51,535) (49,636) (146,006) Direct Vacancy Rate 20.0% 24.4% 13.2% 19.2% Total Vacancy Rate (Direct + Sublease) 22.5% 27.3% 14.0% 21.3% NORTH MICHIGAN AVENUE SUBMARKET HISTORICAL DIRECT VACANCY CHICAGO 4
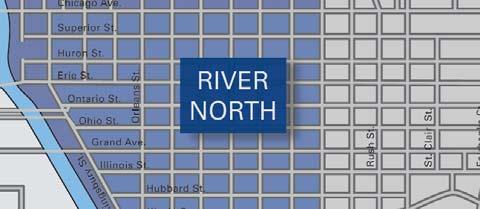
7 RIVER NORTH Vacancy continues to fall; 600 West Chicago sale closes Albeit slight, occupancy increased for the sixth consecutive quarter. The submarket has been the fastest to recover from the recession and currently boasts the lowest vacancy rate in the CBD due to its inventory of creative, loft-style buildings, as well as two of the market s newest skyscrapers. Two long-term leases signed by tenants currently outside of River North will increase future occupancy and counter those tenants who are reducing their space. In January 2012, Ventas will relocate from 111 South Wacker into 29,000 square feet at 353 North Clark. The American Bar Association signed the largest lease in the submarket by renewing 201,000 square feet at 321 North Clark but will cut space by one floor. Building Address Size (sf) Building Class 111 W Illinois St 141,503 A 350 W Mart Ctr 106,168 C 321 N Clark St 61,431 A 222 Merchandise Mart Plz 50,000 B CENTRAL BUSINESS DISTRICT CommonWealth REIT, the most active buyer this year in the CBD, closed on its purchase of 600 West Chicago for roughly $390 million ($249 per square foot). The sellers paid $290 million for the building at the height of the real estate bubble in 2007 when the building was 78 percent leased. Another prominent property is back on the market as Vornado Realty Trust looks to sell the 1.2 million square foot 350 North Orleans. One obstacle facing River North is that 5.4 percent of inventory is available for sublease, compared to 2.4 percent for the entire CBD. Once the underlying leases expire, these spaces will convert to direct vacancy. The submarket will need to continue to attract tenants from other submarkets or cities in order to keep vacancy below the rest of the CBD. The borders of the River North submarket are defined as Division Street (North), Racine Avenue (West), State Street (East), and Fulton Street and the Chicago River (South). It has historically been home to small, older buildings catering to art galleries, furniture studios, and small businesses, but has seen new development which has brought law firms and financial institutions to the submarket. RIVER NORTH SUMMARY A B C Total Inventory (square feet) 4,003,546 3,538,948 5,764,476 13,306,970 Year to Date Absorption (square feet) (41,288) 151,168 67, ,852 Direct Vacancy Rate 16.4% 7.0% 11.9% 12.0% Total Vacancy Rate (Direct + Sublease) 19.7% 17.5% 15.8% 17.4% RIVER NORTH SUBMARKET HISTORICAL DIRECT VACANCY CHICAGO 5
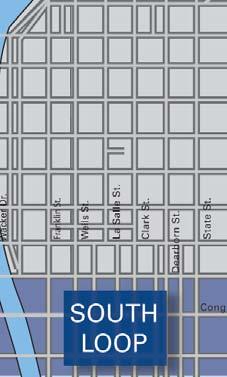
8 SOUTH LOOP Smallest submarket now has highest direct vacancy rate in CBD As has been the case since the downturn, the South Loop continued to see vacancy rates rise. At 20.6 percent, the South Loop now has the highest direct vacancy rate of the CBD s submarkets. However, due to the South Loop s limited inventory, one large tenant has the ability to drastically impact the performance of the submarket. One Financial Place comprises nearly half of the total amount of office space in the South Loop and is the submarket s only Class A building. Behringer Harvard, the building s owner, was able to secure a $90 million refinance loan during the quarter just nine days before the loan was due. The refinance required significant equity, since it was acquired at the height of the market in Building Address Size (sf) Building Class 619 S LaSalle St 89,000 C Approximately 61,000 square feet in the building is set to become directly available next quarter. This is largely due to the consolidation of back office operations at Goldman Sachs. If the building does not attract enough demand to fill this space next quarter, vacancy will continue to climb and could reach the highest levels in MB Real Estate s tracked history. The boundaries of the South Loop include Van Buren Street (North), I-90/I-94 (West), Lakeshore Drive (East), and 16th Street (South). The South Loop is populated primarily with education, small businesses, and converted residential properties. SOUTH LOOP SUMMARY A C Total CENTRAL BUSINESS DISTRICT Inventory (square feet) 1,019,325 1,271,908 2,291,233 Year to Date Absorption (square feet) (53,752) (39,500) (93,252) Direct Vacancy Rate 14.7% 25.3% 20.6% Total Vacancy Rate (Direct + Sublease) 16.0% 25.5% 21.3% SOUTH LOOP SUBMARKET HISTORICAL DIRECT VACANCY CHICAGO 6
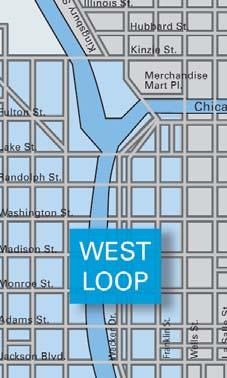
9 WEST LOOP Class A continues to outperform the CBD The West Loop posted its sixth consecutive quarter of positive demand and continues to recover faster than the rest of the CBD overall. Class A buildings now have absorbed 400,000 square feet in 2011, showing that this segment is the most desired location and asset class. For the second straight quarter, Wacker Drive was home to the largest lease transaction. PricewaterhouseCoopers renewed its lease for 279,000 square feet at 1 North Wacker. Fifth Third Bank renewed its lease and expanded to 218,000 square feet at 222 South Riverside, increasing its footprint by 38,000 square feet. Acquity Group renewed and expanded at 500 West Madison for a total of 65,000 square feet. Building Address Size (sf) Building Class 500 W Monroe St 369,207 A 233 S Wacker Dr 299,514 A 101 N Wacker Dr 106,732 B 500 W Monroe St * 106,475 A 300 S Riverside Plz 105,183 B 500 W Madison St 92,924 A 233 S Wacker Dr 91,216 A 1 S Wacker Dr 86,658 A 30 S Wacker Dr 85,831 A 564 W Randolph St 81,331 C As with leasing activity, the investment sales market continued to be extremely active. The Multi-Employer Property Trust purchased 200 West * Indicates future available space Madison from a Tishman Speyer & Transwestern joint venture for $218 million, or $235 per square foot. The property is 88 percent leased and was acquired in an all-cash transaction. Irvine Company, who purchased 71 South Wacker last year, agreed to purchase a 50 percent stake in 1 North Wacker for an estimated $443 per square foot. Hines Real Estate Investment Trust will retain the remaining 50 percent stake. Willis Tower and 311 South Wacker remain on the market. Due to the amount of leasing activity the submarket has experienced, MB Real Estate expects further positive absorption in the West Loop next quarter. Also, the investment sales market will continue to heat up as institutional investors and high-net-worth individuals bid for the some of the largest and most iconic buildings in the CBD. CENTRAL BUSINESS DISTRICT The West Loop s borders are defined as the Chicago River (North), I-94/I-90 (West), Wells Street (East), and Van Buren Street (South). WEST LOOP SUMMARY A B C Total Inventory (square feet) 26,891,979 9,723,404 6,467,059 43,082,442 Year to Date Absorption (square feet) 402, ,773 30, ,330 Direct Vacancy Rate 14.8% 12.7% 17.1% 14.6% Total Vacancy Rate (Direct + Sublease) 17.3% 14.0% 18.2% 16.7% WEST LOOP SUBMARKET HISTORICAL DIRECT VACANCY CHICAGO 7

10 SUBURBAN MAP SUBURBAN CHICAGO CHICAGO 8

11 EAST-WEST Class A buildings outperform submarket; rest of Suburban market Driven by strong demand for Class A buildings, the East- West submarket experienced its largest quarterly absorption since the second quarter of While Class B and C buildings saw minor occupancy changes, Class A buildings direct vacancy dipped below 20 percent. In addition to this quarter s absorption, the East-West submarket attracted several large leases that will result in additional positive absorption in the upcoming quarters. State Farm Insurance signed the largest lease in the entire Suburban market: a 154,000 square foot renewal and expansion at 1400 Opus Place in Downers Grove. This new lease results in an additional 82,000 square feet of occupancy. Comcast will relocate its offices from 1901 South Meyers Road in Oakbrook Terrace Building Address City Size (sf) Building Class 1200 Warrenville Rd Naperville 329,770 B 700 Oakmont Ln Westmont 256,767 A Torch Pky Warrenville 203,842 B 2000 Clearwater Dr Oak Brook 198,250 B 2400 Cabot Dr * Lisle 194,052 B 3500 Lacey Rd * Downers Grove 103,199 A 1333 Butterfield Rd Downers Grove 102,096 A 3333 Warrenville Rd Lisle 89,334 A 800 Jorie Blvd Oak Brook 88,886 B 2655 Warrenville Rd Downers Grove 76,691 A * Indicates future available space Italicized addresses indicate new blocks this quarter and increase its footprint by 50,000 square feet when it moves into 80,000 square feet at 1415 West Diehl Road in Naperville. American Realty Advisors purchased the Oak Brook Regency Towers located at 1415 & 1515 West 22nd Street for $70 million, equating to $174 per square foot. Combined, the buildings are 93 percent leased. This transaction demonstrates that demand for core, well-located office buildings still exists in the Suburban market. With leasing activity picking up in Class A assets, but stagnating in Class B and C, MB Real Estate expects vacancy to be flat over the next quarters. Current job growth cannot create absorption across all classes, and companies are considering alternative locations. The East-West submarket encompasses Cook, DuPage, Kane, Kendall, and Will Counties, with major cities including Downers Grove, Lisle, Naperville, and Oak Brook. SUBURBAN CHICAGO EAST-WEST SUMMARY A B C Total Inventory (square feet) 20,618,272 14,542,179 4,910,365 40,070,816 Year to Date Absorption (square feet) 262,562 (107,224) 25, ,124 Direct Vacancy Rate 19.6% 23.9% 23.1% 21.6% Total Vacancy Rate (Direct + Sublease) 23.9% 27.4% 23.2% 25.1% EAST-WEST SUBMARKET HISTORICAL DIRECT VACANCY CHICAGO 9
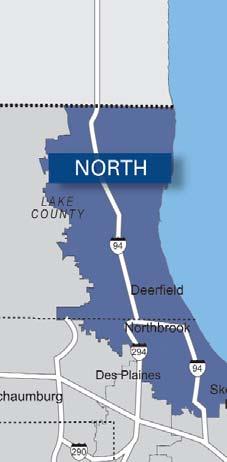
12 NORTH Occupancy continues its slide; 909 Davis under contract The direct vacancy rate in the North submarket reached 20.7 percent, which is the highest level in MB Real Estate s tracked history. While vacancy declined in Class B buildings, Class A experienced 220,000 square feet of negative absorption as a few buildings had large blocks vacated during the quarter. Despite historically being the most desired submarket in the Suburban market, the North submarket faltered. Mercer signed the largest lease transaction by renewing its 63,000 square foot space at 540 Lake Cook Road in Deerfield. Saputo Cheese USA extended its 27,000 square feet at 25 Tri State International in Lincolnshire. While retaining large tenants is crucial to a recovery, neither deal results in increased occupancy. Building Address City Size (sf) Building Class 1200 Lakeside Dr Bannockburn 257,190 A 1 Corporate Dr Long Grove 204,965 A 75 N Fairway Dr * Vernon Hills 200,344 A 1 Overlook Pt Lincolnshire 148,686 A 544 Lakeview Pky Vernon Hills 144,999 B 1 Corporate Dr Long Grove 142,130 A 4 Corporate Dr Long Grove 133,422 B 2355 Waukegan Rd Bannockburn 106,495 A 6 Parkway Blvd N * Deerfield 95,854 A 75 Tri State International * Lincolnshire 79,534 A * Indicates future available space Italicized addresses indicate new blocks this quarter 909 Davis Street, a premier office building in Evanston, was sold to Franklin Street properties for approximately $180 per square foot. The seller, American Real Estate Capital, previously had the property under contract for $200 per square foot, but the deal fell through last fall. The 195,000 square foot building is fully leased, with a majority occupied by Houghton Mifflin Harcourt. With weak leasing activity, seven direct blocks more than 100,000 square feet and an additional three blocks greater than 130,000 square feet available for sublease, MB Real Estate continues to maintain a negative short-term outlook. Sustained job growth and the retention of large tenants are necessary for occupancy to grow towards levels seen just a couple of years ago. The North submarket is located within portions of Cook and Lake Counties, with major cities including Bannockburn, Deerfield, Evanston, Glenview, Highland Park, Lake Forest, Northbrook, and Vernon Hills. SUBURBAN CHICAGO NORTH SUMMARY A B C Total Inventory (square feet) 16,873,552 7,442,387 2,560,495 26,876,434 Year to Date Absorption (square feet) (267,373) 11,616 (75,325) (331,083) Direct Vacancy Rate 20.5% 20.6% 22.5% 20.7% Total Vacancy Rate (Direct + Sublease) 26.4% 21.9% 23.0% 24.8% NORTH SUBMARKET HISTORICAL DIRECT VACANCY CHICAGO 10
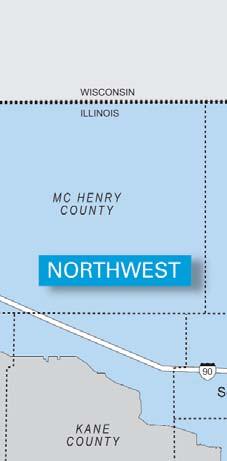
13 NORTHWEST Another weak quarter leads to highest vacancy rate in suburbs Occupancy declined for a sixth consecutive quarter as several large lease rollovers increased the amount of vacant space. At 27.5 percent, the Northwest submarket has surpassed O Hare to have the highest direct vacancy rate in the suburbs. Building Address City Size (sf) Building Class Lake Cook Rd Deer Park 351,425 A 1600 McConnor Pky Schaumburg 300,686 A 1701 Golf Rd Rolling Meadows 281,528 A A key contributor to this quarter s vacancy jump is Ameriquest Mortgage s lease expiration at 1600 McConnor Parkway in Schaumburg. The defunct wholesale lender, whose practices were at the heart of the financial crisis, previously marketed a total of 168,000 square feet for sublease. However, its lease expired in August and joined the glut of direct vacant space Algonquin Rd 1299 Algonquin Rd 5550 Prairie Stone Pky * 150 NW Point Blvd 425 N Martingale Rd 3800 Golf Rd 1 Salem Lake Dr Rolling Meadows Schaumburg Hoffman Estates Elk Grove Village Schaumburg Rolling Meadows Long Grove 206, , , , , , ,252 C C A B A B A * indicates future available space Although several large tenants renewed last quarter, the submarket once again failed to attract enough new tenants to lead to significant future occupancy gains. Lincoln Financial will relocate within submarket and into 47,000 square feet 1701 Golf Road in Rolling Meadows. Intuit signed a 10-year lease for 24,805 square feet at 95 West Algonquin. A surplus of large blocks continues to hamper any potential recovery. The Northwest has 17 contiguous blocks of at least 100,000 square feet available for direct lease, more than any other submarket in Suburban Chicago. In addition, AT&T is marketing its 1.2 million square foot campus in Hoffman Estates for sublease. With numerous options available, large tenants evaluating the Northwest submarket will continue to have the upper hand in lease negotiations for the foreseeable future. The Northwest submarket is located within the portions of Cook, Kane, Lake, and McHenry Counties, with major cities including Arlington Heights, Itasca, Rolling Meadows, and Schaumburg. SUBURBAN CHICAGO NORTHWEST SUMMARY A B C Total Inventory (square feet) 18,526,958 9,759,079 2,312,562 30,598,599 Year to Date Absorption (square feet) (560,645) (358,363) (50,783) (969,791) Direct Vacancy Rate 23.0% 35.0% 31.3% 27.5% Total Vacancy Rate (Direct + Sublease) 24.7% 36.3% 32.6% 29.0% NORTHWEST SUBMARKET HISTORICAL DIRECT VACANCY CHICAGO 11
14 O HARE Demand flattens; three-building Columbia Centre trades in short sale The O Hare submarket experienced occupancy losses in Class A buildings but slight increases in Class B and C. The direct vacancy rate remains below its peak. However, vacancy rates for Class B and C properties are still well over 30 percent. As firms continue to shed space or relocate outside of the submarket, O Hare failed to attract new large tenants during the quarter. The American Board of Radiology, who signed a 10-year lease for 50,000 square feet at 5440 North Cumberland Avenue in Chicago last quarter, will not occupy its space until Spring This represents the only known large future addition to occupancy. Building Address City Size (sf) Building Class E Devon Ave Des Plaines 142,596 B 9525 W Bryn Mawr Ave Rosemont 113,868 A 8700 W Bryn Mawr Ave Chicago 97,801 A 4242 N Harlem Ave Norridge 93,155 B 9801 W Higgins Rd Rosemont 78,682 B 8700 W Bryn Mawr Ave * Chicago 76,469 A 9500 W Bryn Mawr Ave Rosemont 72,149 B 9500 W Bryn Mawr Ave * Rosemont 56,554 A 2400 E Devon Ave Des Plaines 51,000 B W Higgins Rd Chicago 50,214 A * Indicates future available space Investment activity was highlighted by the short-sale of the three building, Columbia Centre. The three Class A buildings located at 9450 and 9525 Bryn Mawr Avenue, as well as 5600 North River Road in Rosemont, traded for $37 million or $61 per square foot. The properties, which have a combined vacancy rate of 25 percent, were acquired by a joint venture of White Oak Realty Partners and Pearlmark Real Estate Partners from Transwestern Investment Company. Tenants with large space requirements have considerable options with 10 direct blocks and one sublease block of space greater than 50,000 square feet available. Given the amount of options, O Hare will continue to be a tenants' market. The O Hare submarket is located in northwestern Cook County, with major cities including northwestern Chicago, Elk Grove Village, and Rosemont. SUBURBAN CHICAGO O'HARE SUMMARY A B C Total Inventory (square feet) 7,826,174 4,347,075 2,543,059 14,716,308 Year to Date Absorption (square feet) (90,761) (19,928) 16,488 (94,200) Direct Vacancy Rate 21.7% 31.3% 35.7% 26.9% Total Vacancy Rate (Direct + Sublease) 24.4% 35.6% 35.8% 29.7% O HARE SUBMARKET HISTORICAL DIRECT VACANCY CHICAGO 12

15 ABOUT MB REAL ESTATE Our mission is to provide clients and investors with extraordinary real estate value and unlimited support MB REAL ESTATE At MB Real Estate, our corporate mission is to maximize the value of our clients real estate by creating timely and innovative solutions that meet their unique needs and objectives. We offer the highest level of real estate support with our team of committed, resultsdriven experts in asset and facilities management, leasing, tenant representation, development, project management, and investment services. Supported by dedicated accounting, marketing, human resources, and information technology teams, our unique full-service firm is an industry leader in local and national corporate real estate. MB REAL ESTATE HEADQUARTERS 181 West Madison, Suite 4700 Chicago, Illinois phone: fax: EAST COAST REGIONAL HEADQUARTERS 335 Madison Avenue, 14th Floor New York, New York phone: fax: COMPANY LEADERSHIP PETER E. RICKER Chairman & CEO JOHN T. MURPHY President DEPARTMENT LEADERSHIP MARK A. BUTH Senior Vice President & Managing Director of Leasing Services ANDREW J. DAVIDSON Executive Vice President & Managing Director of Corporate Services & Tenant Advisory GARY A. DENENBERG Executive Vice President & Managing Director of Leasing Services DAVID R. GRAFF Senior Vice President of Project Services MAUREEN G. GROVE Vice President & Managing Director of Accounting Services DANIEL J. NIKITAS Executive Vice President of Corporate Services & Tenant Advisory Services KEV IN M. PURCELL Executive Vice President & Managing Director of Asset Management PATRICIA ALUISI Senior Vice President & Managing Director of Administration CHICAGO 13
Market Report Q Colliers Bennett & Kahnweiler Inc. Chicago. Quarterly Market Trends. Suburban Office Overview
 Overall, the suburban office market continues to be defined by the strength of industry sectors residing in each submarket. Quarterly Market Trends Suburban Office Overview December 24 The suburban office
YEAR-END CHICAGO SUBURBS Office Market Report. Big Moves Create Negative Absorption Driving Vacancy Rates Higher. YTD Net Absorption
 CHICAGO SUBURBS Office Market Report Net Absorption (1,919,191) Availability 24.1% Big Moves Create Negative Absorption Driving s Higher MARKET CONDITIONS: The suburbs had several major real estate occurrences
Q1-Q2 Asking Rate (Direct) $20.30
 $20.30") CHICAGO SUBURBS Office Market Report Net Absorption (123,983) Q1-Q2 Availability 24.4% and Availability s Mislead True Market Conditions MARKET CONDITIONS: At its core, Chicagoland s suburban office market
CHICAGO SUBURBS Office Market Report Net Absorption (123,983) Q1-Q2 Availability 24.4% and Availability s Mislead True Market Conditions MARKET CONDITIONS: At its core, Chicagoland s suburban office market
Suburban Office. After a steady decrease in vacancy throughout 2013, the suburban Chicago office market suffered a setback in the first quarter.
 Q1 SUBURBAN OFFICE CHICAGO OFFICE MARKET OVERVIEW MARKET INDICATORS Suburban Office Q4 Q1 VACANCY 20.3% 21.2% YTD ABSORPTION 922,626-1,237,378 RENTS $19.98 $19.91 INVENTORY 118,674,400 118,674,400 - Suburban
Suburban Office CHICAGO OFFICE MARKET OVERVIEW Q SUBURBAN OFFICE
 Q1 SUBURBAN OFFICE CHICAGO OFFICE MARKET OVERVIEW MARKET INDICATORS Suburban Office Q4 Q1 VACANCY 20.4% 20.3% YTD ABSORPTION 916,462 195,280 RENTS $19.90 $19.74 INVENTORY 119,051,661 119,051,661 - Suburban
Hitting the Wall CHICAGO OFFICE MARKET OVERVIEW Q SUBURBAN OFFICE
 Q3 SUBURBAN OFFICE CHICAGO OFFICE MARKET OVERVIEW MARKET INDICATORS Suburban Office Q2 Q3 VACANCY 20.4% 20.4% - YTD ABSORPTION 809,134 793,859 RENTS $19.71 $19.78 INVENTORY 119,350,985 119,350,985 - Hitting
Chicago CBD. 4.1% Chicago s unemployment rate continued to trend downward, standing at 4.1% as of May 2017.
 Second Quarter 2017 Office Market Report Chicago CBD Market Facts 4.1% Chicago s unemployment rate continued to trend downward, standing at 4.1% as of May 2017. 34,400 jobs The Chicago metro area added
Downtown Office Market Report CHICAGO. Mid-Year
 Downtown Office CHICAGO 2005 Mid-Year Table of Contents page I. DOWNTOWN OFFICE MARKET OVERVIEW 1 Chicago CBD Submarket Map 3 Second Quarter Statistics 4 II. ABOUT COLLIERS BENNETT & KAHNWEILER INC. 5
Suburban Office Market Report CHICAGO
 Suburban Office CHICAGO Third Quarter Third Quarter Table of Contents SUBURBAN OFFICE MARKET OVERVIEW 1 Page OFFICE SUBMARKET MAP 2 THIRD QUARTER STATISTICS 3 TOP THIRD QUARTER LEASE TRANSACTIONS 4 CHICAGO
Suburban Office CHICAGO OFFICE MARKET OVERVIEW Q SUBURBAN OFFICE
 Q2 SUBURBAN OFFICE CHICAGO OFFICE MARKET OVERVIEW MARKET INDICATORS Suburban Office Q2 Q2 VACANCY 21.1% 21.0% YTD ABSORPTION 595,359 SF 244,556 SF RENTS $19.90 $19.91 - INVENTORY 120,106,309 120,106,309
Back in the Game. After taking a hit earlier in the year, the suburban Chicago office market improved in the third quarter of 2014.
 Q3 SUBURBAN OFFICE CHICAGO OFFICE MARKET OVERVIEW Back in the Game After taking a hit earlier in the year, the suburban Chicago office market improved in the third quarter of. While the suburban Chicago
Office Market Analysis City of Chicago. According to Costar Property, the City of Chicago office market is distributed as follows:
 Office Market Analysis City of Chicago Market Composition & Distribution According to Costar Property, the City of Chicago office market is distributed as follows: Office Submarket Distribution - City
CHICAGO CBD OFFICE INVESTMENT PROPERTIES GROUP
 CHICAGO CBD OFFICE INVESTMENT PROPERTIES GROUP SECOND QUARTER NEWSLETTER 216 HOT TOPICS Capital markets remain a focus with 14 assets either under contract or sold totaling $2.6 billion, which includes
CHICAGO CBD MARKET OVERVIEW & SNAPSHOTS
 CHICAGO CBD MARKET OVERVIEW & SNAPSHOTS FIRST QUARTER 2017 RESEARCH 181 WEST MADISON STREET, SUITE 4700, CHICAGO, ILLINOIS 60602 (312) 487-5977 MBRES.COM 1 FIRST QUARTER 2017 CHICAGO MARKET OVERVIEW TABLE
Chicago CBD. 5.3% Chicago s unemployment rate continued to trend downward. As of August 2017, the unemployment rate stood at 5.3%.
 Third Quarter 2017 Office Market Report Chicago CBD Market Facts 5.3% Chicago s unemployment rate continued to trend downward. As of August 2017, the unemployment rate stood at 5.3%. 24,700 jobs The metro
Suburban Office Holds Steady
 Research & Forecast Report SUBURBAN CHICAGO OFFICE Third Quarter Suburban Office Holds Steady Ronna Larsen Senior Research Manager Suburban Chicago Despite activity in certain areas of the market, overall
Chicago Rising CHICAGO OFFICE MARKET OVERVIEW Q DOWNTOWN OFFICE RESEARCH REPORT SECOND QUARTER 2011 DOWNTOWN CHICAGO OFFICE
 Q2 2011 DOWNTOWN OFFICE CHICAGO OFFICE MARKET OVERVIEW Chicago Rising The Chicago CBD office market is by no means fully recovered and vacancy rates still remain elevated relative to pre-credit crisis
Chicago CBD. 4.7% Chicago s unemployment rate trended downward. As of November 2017, the unemployment rate stood at 4.7%.
 Fourth Quarter 2017 Office Market Report Chicago CBD Market Facts 4.7% Chicago s unemployment rate trended downward. As of November 2017, the unemployment rate stood at 4.7%. 31,678 jobs The metro Chicago
Finishing on a High Note
 Research & Forecast Report SUBURBAN CHICAGO OFFICE Fourth Quarter Finishing on a High Note Ronna Larsen Senior Research Manager Suburban Chicago Despite spending much of with negative absorption, the Chicago
Vacancy rate 20.6% 21.5% 21.6% Rents $20.41 $20.91 $ Inventory 113,477, ,477, ,477,034. Chicago 4.8% 3.6% Illinois 5.9% 4.
 Research & Forecast Report SUBURBAN CHICAGO OFFICE Second Quarter Status Quo Ronna Larsen Senior Research Manager Suburban Chicago Pockets of improvement in suburban market, but overall vacancy remains
Urban and Suburban Current Market Conditions Chicago
 COMMERCIAL REAL ESTATE LEASES: Urban and Suburban Current Market Conditions Chicago Prepared for: Negotiating and Enforcing Commercial Leases September 17-18, 2007 The Gleacher Center Chicago, Illinois
Chicago s industrial market thrives during the third quarter.
 CHICAGO INDUSTRIAL MARKET MONITOR THIRD QUARTER 2015 Chicago s industrial market thrives during the third quarter. Demand across the Chicago industrial market remains high sending absorption up and vacancy
TRANSWESTERN OUTLOOK DC AT Q1O8
 TRANSWESTERN OUTLOOK DC AT Q1O8 Even With Soft Office Absorption, Vacancy Remains Low; Rents Continue to Edge Up The District of Columbia s office market experienced steady conditions during the 1st quarter
Colliers International 6250 N. River Road Suite Rosemont, IL Phone Fax No warranty or representation is made
 Colliers International 6250 N. River Road Suite 11-100 Rosemont, IL 60018 Phone 847 698 8444 Fax 847 698 8445 O Hare Quarter in Review» The O'Hare submarket continues to set new vacancy records. Significant
A Strong Finish. DOWNTOWN CHICAGO OFFICE Fourth Quarter Research & Forecast Report
 Research & Forecast Report DOWNTOWN CHICAGO OFFICE Fourth Quarter 2015 A Strong Finish Robert Patterson Research Analyst Downtown Chicago 2015 was an extremely strong year for commercial real estate in
National Presence. Local Focus
 Metropolitan DC Market Overview 4Q 214 Overall Market Summary The Washington, DC Metropolitan commercial real estate market is comprised of approximately 41.9 million square feet of rentable office space
KEY TOWER SALE highlights start of 2017
 KEY TOWER SALE highlights start of 2017 Demand for office space in the Greater Cleveland office market remained strong as 2016 wound down and transitioned into the first quarter of 2017. After netting
+48.6 million sf office inventory
 Research Market Report METROPOLITAN MILWAUKEE OFFICE 2018 Quarter 1 Research Wisconsin Introduction Following a strong second half of 2017, 2018 had a slow start. Despite an increase in vacancy and negative
Summary. Houston. Dallas. The Take Away
 Page Summary The Take Away The first quarter of 2017 was marked by continued optimism through multiple Texas metros as job growth remained positive and any negatives associated with declining oil prices
Q2:11. Transwestern Outlook WASHINGTON, D.C.
 11 Office Property Owners Invest in Renovating Older Product to Class A; Vacancy Edges Up as Rents Edge Down; Investment Sales Strong and Net Absorption Notable The District of Columbia office market experienced
MARKET REPORT. Manhattan Office Sector Continues Recovery as Downtown Breaks Record MANHATTAN SNAPSHOT 4.2% 0.8PP 1.98MM SF MANHATTAN OFFICE
 3Q 2014 OFFICE MANHATTAN OFFICE MARKET REPORT MANHATTAN Leasing ACTIVITY Availability RATE ABSORPTION 4.2% 0.8PP Asking RENTS 2.3% Note: Compared to 2Q 2014 Statistics 1.98MM SF Manhattan Office Sector
Metropolitan Chicago. Market Review. Office Market Review. Second Quarter 2014
 Metropolitan Chicago Market Review Office Market Review Second Quarter 214 1 To our valued customers, partners and future clients I recently returned from a three-day bicycle tour of the Colorado Rocky
Orange County Office Market Continues to Tighten Causing Rental Rates to Increase
 OFFICE ORANGE COUNTY MARKET REPORT Continues to Tighten Causing Rental Rates to Increase MARKET OVERVIEW MARKET INDICATORS - VACANCY 12.6% NET ABSORPTION 688,800 CONSTRUCTION 497,387 RENTAL RATE $2.26
Vacancy Inches Higher, Despite Continued Absorption
 Research & Forecast Report GREATER PHOENIX OFFICE 1Q 2017 Vacancy Inches Higher, Despite Continued Absorption Key Takeaways > > Improving conditions in the Greater Phoenix office market took a pause in
Strong Marketwide Leasing Activity Points To A Strong Finish for Tri-Cities
 OFFICE TRI-CITIES MARKET REPORT Strong Marketwide Leasing Activity Points To A Strong Finish for Tri-Cities MARKET OVERVIEW MARKET INDICATORS - VACANCY 14.9% NET ABSORPTION 254,6 CONSTRUCTION 113,8 RENTAL
Washington, D.C. Quarterly Market Report. 1st Quarter lpcwashingtondc.com
 Washington, D.C. Quarterly Market Report 1st Quarter 1 Table of Contents Washington, D.C. Leasing & Market Research Metropolitan D.C. Market Overview...3 Washington, D.C. Quarterly Overview...5 Washington
>> Hollywood Market Activity Flattens
 Research & Forecast Report Central Los Angeles OFFICE Q2 216 Accelerating success. >> Hollywood Market Activity Flattens Key Takeaways > There is currently 533,6 square feet () of office product under
Greater Los Angeles MARKETBEAT. Office Q Economy. Market Overview
 LOS ANGELES COUNTY Economic Indicators Q2 16 Q2 17 Los Angeles Employment 4.38M 4.44M Los Angeles Unemployment 5.3% 4.4% U.S. Unemployment 4.9% 4.4% 12-Month Forecast Economy The job growth rate in Los
A Quiet Start. chicago OFFICE MARKET OVERVIEW Q DOWNTOWN OFFICE RESEARCH REPORT Q DOWNTOWN CHICAGO OFFICE.
 Q1 2013 DOWNTOWN OFFICE chicago OFFICE MARKET OVERVIEW RESEARCH REPORT Q1 2013 DOWNTOWN CHICAGO OFFICE A Quiet Start Consistent with the start of, the first quarter of 2013 proved to be relatively lackluster.
DISTRICT OF COLUMBIA IN THIS ISSUE OFFICE Q RESEARCH MARKET REPORT. State of the Economy. Leasing Activity. Development Pipeline.
 RESEARCH MARKET REPORT DISTRICT OF COLUMBIA OFFICE IN THIS ISSUE State of the Economy p.2 Leasing Activity p.3 Development Pipeline p.4 Market Outlook p.5 Market Breakdown p.6 DC Development: No Signs
Orange County Office Market Continues to Tighten As Vacancy Decreases
 OFFICE ORANGE COUNTY MARKET REPORT Continues to Tighten As Decreases MARKET OVERVIEW MARKET INDICATORS - VACANCY 13.5% NET ABSORPTION 101,500 CONSTRUCTION 497,387 RENTAL RATE $2.21 P FSG UNEMPLOYMENT 4.2%
McClurg Court Center The Heart of Chicago's Streeterville & Northwestern Medical District
 Now Available Retail & Restaurant Opportunities from 835 to 15,767 at Downtown Chicago McClurg Court Center The Heart of Chicago's Streeterville & Northwestern Medical District Artist s concept of renovated
Washington, D.C. Quarterly Market Report. 4th Quarter lpcwashingtondc.com
 Washington, D.C. Quarterly Market Report th Quarter 17 Table of Contents Washington, D.C. Leasing & Market Research Metropolitan D.C. Market Overview...3 Washington, D.C. Quarterly Overview...5 Washington
Speculative construction and record breaking investment sales lead the way in Q2 2015
 MARKETVIEW Boston Downtown Office, Q2 2015 Speculative construction and record breaking investment sales lead the way in Q2 2015 Vacancy 7.5% Availability 13.9% Absorption 424,525 SF Sublease 0.75% Under
739 South Clark Street
 CHICAGO SOUTH LOOP Offering Memorandum For Sale > 30,559 SF (0.70 ACRE) MIXED-USE DEVELOPMENT SITE 739 South Clark Street Chicago, IL NORTH PREPARED BY: Brian Pohl Executive Vice President DIRECT +1 312
Mid-Year 2018: Chicago Market Snapshot. Condominium Deconversions: A Creative Structure for Unlocking Value
 Mid-Year 2018: Chicago Market Snapshot Condominium Deconversions: A Creative Structure for Unlocking Value James M. Hanson Principal Capital Markets james.hanson@avisonyoung.com 312.273.4506 Avison Young
Metropolitan Chicago. Market Review. Office Market Review. Second Quarter 2013
 Metropolitan Chicago Market Review Office Market Review Second Quarter 213 To our valued customers, partners and future clients A powerful storm blew through Chicago on a late afternoon about a month ago
NAI REOC San Antonio San Antonio Retail Market I Third Quarter 2011
 MEDIA RELEASE Contact: Kim Gatley Senior Vice President & Director of Research NAI REOC San Antonio P 210 524 4000 I F 210 524 4029 kgatley@naireocsanantonio.com www.naireocsanantonioblog.com SAN ANTONIO
>> Strong Sales Activity Persists in Second Quarter
 Research & Forecast Report TRI-CITIES OFFICE Q2 217 Accelerating success. >> Strong Sales Activity Persists in Second Quarter Key Takeaways > Overall vacancy in the Tri-Cities office market decreased in
HISTORICAL VACANCY VS RENTS. Downtown Los Angeles Office Market Q Q RENTS VACANCY $31 2Q10 2Q11 2Q12 2Q13 2Q14
 www.colliers.com/losangeles OFFICE LOS ANGELES MARKET REPORT Rate Decrease Below 20% As Market Activity Remains Flat MARKET OVERVIEW MARKET INDICATORS - VACANCY 19.5% The Downtown Los Angeles market in
The Market Is Energized By Increased Development In Hollywood
 OFFICE CENTRAL LOS ANGELES MARKET REPORT The Market Is Energized By Increased Development In Hollywood MARKET OVERVIEW MARKET INDICATORS - VACANCY 20.5% NET ABSORPTION 24,100 CONSTRUCTION 574,000 RENTAL
>> Orange County Market Gains Positive Momentum
 Research & Forecast Report ORANGE COUNTY OFFICE Accelerating success. >> Orange County Market Gains Positive Momentum Key Takeaways > The Orange County office market saw positive demand for third quarter
Major tenant contractions and impending corporate development set the stage for 2014 and beyond
 Q1 2014 OFFICE MINNEAPOLIS-ST. PAUL OFFICE MARKET REPORT Major tenant contractions and impending corporate development set the stage for 2014 and beyond SF Absorbed Percent Vacant MARKET INDICATORS Q1
CLEVELAND CBD OFFICE MARKET
 RESEARCH 3Q 2018 CLEVELAND CBD OFFICE MARKET CBD ACTION DOMINATED 3Q AS MARKET S HEALTH REBOUNDED History repeated itself for the third year in a row during the third quarter of 2018, as a handful of prominent
Research. Legal firms rightsizing leads to uptick in vacancy CLEVELAND 1Q16 OFFICE MARKET. Current Conditions
 Legal firms rightsizing leads to uptick in vacancy The Greater Cleveland office market started 2016 on a sour note, as the office sector gave back space for the first time in 12 months, ending the first
VACANCY NET ABSORPTION CONSTRUCTION
 The office market in Milwaukee is in an exciting time. With the delivery of 833 East last quarter and the delivery of Meadowland Research & Technology Center this quarter, the office market is expanding
Feeling A Little Sluggish
 SECOND QUARTER 2012 DOWNTOWN research report second quarter 2012 downtown chicago office chicago OFFICE MARKET OVERVIEW Feeling A Little Sluggish During the second quarter, market fundamentals in the CBD
OFFICE MARKET ANALYSIS
 OFFICE MARKET ANALYSIS ALEC LAWRENCE Portland State University The fourth quarter finds the Portland office market nearing a sweet spot for developers. Strong absorption, decreasing vacancy, and increasing
Las Vegas Valley Executive Summary
 ARROYO MARKET SQUARE Las Vegas Valley Executive Summary Retail Market 4th Quarter 2013 THE DISTRICT AT GREEN VALLEY RANCH January 23, 2014 Re: Commercial Real Estate Survey: 4th Quarter, 2013 Dear Reader,
Tri-Cities Sees Increased Leasing Activity and Climbing Rents
 OFFICE TRI-CITIES MARKET REPORT Tri-Cities Sees Increased Leasing Activity and Climbing Rents MARKET OVERVIEW MARKET INDICATORS - The Tri-Cities office market recorded 165, square feet () of positive absorption
>> Market Records Strong Demand To End 2016
 Research & Forecast Report Central Los Angeles OFFICE Q4 216 Accelerating success. >> Market Records Strong Demand To End 216 Key Takeaways > There is currently 61,4 square feet () of office product under
First Quarter 2017 Industrial Market Report. Chicago. Economic Overview
 Chicago Market Facts 5.3% Chicago s unemployment rate continued to trend downward. Recorded at 5.3% as of February 2017. 17 MSF The number of completed projects increased to 5.1 msf and projects currently
Slow Start to the Year as Hollywood Awaits Construction Deliveries
 office CENTRAL LOS ANGELES market report Slow Start to the Year as Hollywood Awaits Construction Deliveries Market overview MARKET indicators - VACANCY 19.1% NET ABSORPTION 24,300 CONSTRUCTION 1,242,600
Gaining Traction Gradually in 2018
 Research & Forecast Report RENO OFFICE Q1 2018 Gaining Traction Gradually in 2018 >> Overall vacancy increased slightly to 12.3% >> Negative net absorption of 13,792 square feet >> Rental rates remained
Chicago s industrial market thrives during the second quarter.
 Economic Overview CHICAGO INDUSTRIAL MARKET MONITOR SECOND QUARTER 2015 Chicago s industrial market thrives during the second quarter. Demand across the Chicago industrial market remains high sending absorption
Quarterly Market Report
 HOUSTON OFFICE JANUARY 2018 EXECUTIVE SUMMARY Office Market Shows Signs of Improvement Houston s overall vacancy rate remained relatively unchanged at 20.7% in, a decrease of 10 basis points quarter-over-quarter,
Second Quarter: Suburban Maryland s Uptick in Leasing has yet to be Realized in Absorption Numbers
 Q2 2013 OFFICE SUBURBAN MARYLAND SUBURBAN MARYLAND MARKET REPORT Second Quarter: Suburban Maryland s Uptick in has yet to be Realized in Numbers Updated May 2012 MARKET INDICATIONS Q2 2013 Q3 2013 (p)
DENVER. Office Research Report. First Quarter Partnership. Performance.
 DENVER Office Research Report First Quarter 2018 Denver Market Facts 61,614 Jobs added in the last 12 months ending in February, a 4.1% increase in employment. 3.1% Unemployment in Denver, lower than the
MAR KET GLANCE SAN DIEGO OFFICE MARKET REPORT PROPERTY SERVICES DEVELOPMENT INVESTMENT FOURTH QUARTER 2015 PROPERTY SERVICES DEVELOPMENT INVESTMENT
 AT A SAN DIEGO OFFICE MARKET REPORT FOURTH QUARTER 215 AT A NEW SUPPLY PUSHES VACANCY RATES HIGHER San Diego s regional economy has been buzzing and added a net total of 37,8 jobs in the 12 months ending
Market Research. OFFICE First Quarter 2010
 colliers international LAS VEGAS, NV Market Research OFFICE First Quarter 2010 Market Indicators Net Absorption Construction Rental Rate Q1-10 Q2-2010 Projected Clark County Economic Data Jan-10 Jan-09
Stronger Office Market Looking Into Future
 Research & Forecast Report Long Island OFFICE MARKET Q2 2015 Stronger Office Market Looking Into Future Rose Liu Research & Financial Analyst Long Island Takeaways Class A & B Long Island economic and
MEDICAL OFFICE BUILDING SNAPSHOT: Q1 2015
 OUTLYING MEDICAL OFFICE BUILDING MARKET HIGHLIGHTS Demand for off campus medical office buildings (MOBs) over the next several years, including those located in the outlying Chicago MOB market will be
Homestretch: Office Market Set to Finish Strong
 Research & Forecast Report RENO OFFICE Q3 2016 Homestretch: Office Market Set to Finish Strong >> Vacancy drops significantly the largest drop quarter over quarter in 2016 >> Rental rates are not increasing
Caution: Vacancy Increases Ahead
 MARKET REPORT DISTRICT OF COLUMBIA OFFICE Fourth Quarter 2016 Caution: Vacancy Increases Ahead Market Indicators Q4 2016 2017 (Projected) NET Despite year-to-date negative absorption, the Washington, DC
Orange County Office Market Continues A Positive Stride Into 2016
 OFFICE ORANGE COUNTY MARKET REPORT Continues A Positive Stride Into 2016 MARKET OVERVIEW MARKET INDICATORS - VACANCY 12.8% NET ABSORPTION 143,900 CONSTRUCTION 594,300 RENTAL RATE $2.31 P FSG UNEMPLOYMENT
Office Leasing Activity Hits a Road Bump In Omaha and Nationally
 Research & Forecast Report OMAHA OFFICE Fourth Quarter 2017 Office Leasing Activity Hits a Road Bump In Omaha and Nationally In the fourth quarter of 2017, the Omaha office market experienced negative
Negative Absorption And Sharp Rise In Total Vacancy to Begin 2014
 OFFICE TRI-CITIES MARKET REPORT Negative Absorption And Sharp Rise In Total to Begin 214 MARKET OVERVIEW MARKET INDICATORS - VACANCY 19.4% NET ABSORPTION -154,9 CONSTRUCTION 155, RENTAL RATE $2.63 P UNEMPLOYMENT
RESEARCH & FORECAST REPORT
 Q2 2012 OFFICE LAS VEGAS NEVADA RESEARCH & FORECAST REPORT Recovery Without Job Growth? Despite office employment still trending downwards, Southern Nevada s office market posted positive net absorption
Negative Absorption Recorded For The First Time In Past Nine Quarters
 OFFICE SAN FERNANDO & VENTURA MARKET REPORT Negative Absorption Recorded For The First Time In Past Nine Quarters MARKET OVERVIEW MARKET INDICATORS - VACANCY 15.6% NET ABSORPTION -124,000 CONSTRUCTION
Postive Demand and Robust Leasing Fuels Tri-Cities Market
 Q4 215 office tri-cities market report Postive Demand and Robust Leasing Fuels Tri-Cities Market Market overview MARKET indicators - Q4 215 VACANCY 14.4% NET ABSORPTION 127,7 CONSTRUCTION 167,8 RENTAL
South Bay Experiences Slow and Steady Market Activity
 OFFICE SOUTH BAY MARKET REPORT South Bay Experiences Slow and Steady Market Activity MARKET OVERVIEW MARKET INDICATORS - VACANCY 21.4% NET ABSORPTION -68,500 CONSTRUCTION 210,000 RENTAL RATE $2.08 FSG
>> 2017 Begins With Continued Strong Demand
 Research & Forecast Report Central Los Angeles OFFICE Q1 217 Accelerating success. >> 217 Begins With Continued Strong Demand Key Takeaways > Hudson Pacific's Icon at Sunset property delivered 323,3 square
Austin s office rental rates continue to grow along with its population
 Research & Forecast Report AUSTIN OFFICE Q3 2016 Austin s office rental rates continue to grow along with its population Kaitlin Holm Research and Marketing Coordinator Austin Austin continues to grow
MARKETBEAT Columbus. Office Q1 2018
 COLUMBUS OFFICE Economic Indicators Q1 17 Q1 18 Unemployment 4.1% 3.8% Ohio Unemployment 5.1% 4.6% U.S. Unemployment 4.7% 4.1% Market Indicators (Overall, All Classes) Q1 17 Q1 18 Overall Vacancy 12.2%
San Diego County Vol. XX, Issue I Rental Trends Executive Summary March 2007
 Real Estate Research and Consulting for over 25 years Vol. XX, Issue I Rental Trends Executive Summary Editor: Robert D. Martinez- Director of Research s institutional grade rental complexes experienced
>> Orange County Rents Increase to Start 2017
 Research & Forecast Report ORANGE COUNTY OFFICE Accelerating success. >> Orange County Rents Increase to Start 2017 Key Takeaways > The Orange County office market saw positive demand for the first part
Metropolitan Milwaukee Office Market Report Third Quarter 2015
 Metropolitan Milwaukee Office Market Report Third Quarter 2015 RETAIL OFFICE INDUSTRIAL LAND INVESTMENT NAI MLG COMMERCIAL 414 347 9400 757 N BROADWAY, SUITE 700, MILWAUKEE, WI 53202 MLGCOMMERCIAL.COM
Volume II Edition I Why This is a Once in a Lifetime Opportunity for Investors
 www.arizonaforcanadians.com Volume II Edition I Why This is a Once in a Lifetime Opportunity for Investors In This Edition How to make great investment returns in a soft market U.S. Financing for Canadians
>> 2016 Off to A Good Start for Tri-Cities
 Research & Forecast Report TRI-CITIES OFFICE Q1 216 Accelerating success. >> 216 Off to A Good Start for Tri-Cities Key Takeaways > The Tri-Cities office market saw vacancy decline for the seventh consecutive
>> Orange County Vacancy Continues to Decline
 Research & Forecast Report ORANGE COUNTY OFFICE Accelerating success. >> Orange County Continues to Decline Key Takeaways > The South County submarket led the Orange County market in overall net absorption
OFFICE MARKET ANALYSIS
 OFFICE MARKET ANALYSIS KYLE BROWN RMLS Fellow, Master of Real Estate Development Candidate Amid some encouraging signs nationally, the Portland office market has maintained its stability, with the CBD
Washington, D.C. Quarterly Market Report. 3rd Quarter lpcwashingtondc.com
 Washington, D.C. Quarterly Market Report Table of Contents Washington, D.C. Leasing & Market Research Metropolitan D.C. Market Overview...3 Washington, D.C. Quarterly Overview...5 Washington D.C. Top Sales...
Columbus MARKETBEAT. Office Q2 2017
 COLUMBUS OFFICE Economic Indicators Market Indicators Q2 16 Q2 17 Unemployment 4.0% 3.9% Ohio Unemployment 5.0% 5.0% U.S. Unemployment 4.9% 4.4% Q2 16 Q2 17 Overall Vacancy 13.3% 13.4% 212K -80K Construction
RENTS VACANCY $2.10 1Q11 1Q12 1Q13 1Q14 1Q15
 office Greater LOS ANGELES basin market report Rising Rents and Positive Absorption Lead to Tightening Market Conditions EXECUTIVE SUMMARY MARKET indicators - VACANCY 15.7% NET ABSORPTION +487,5 CONSTRUCTION
>> South Bay Market Hits 9-Year High in Demand
 Research & Forecast Report South Bay OFFICE Q3 2016 Accelerating success. >> South Bay Market Hits 9-Year High in Demand Key Takeaways > The El Segundo/Beach Cities submarket once again led the South Bay
City of Noblesville Unified Development Ordinance Audit. Real Estate Analysis
 City of Noblesville Unified Development Ordinance Audit Real Estate Analysis December 10 th, 2012 Introduction The Noblesville Real Estate Analysis compares the health of the real estate market against
Direct Vacant (SF) Vacancy Rate (%) Grand Total ,816,898 4,632,760 4,123, % 245,399 66,997 66,997
 Vacancy Rate (%) Grand Total ,816,898 4,632,760 4,123, % 245,399 66,997 66,997") 1st Quarter 213 $25 Market Highlights With the impending move of Pinnacle leaving the market next quarter, the Memphis Office market was able to start the year on a positive note, posting nearly 67, SF
1st Quarter 213 $25 Market Highlights With the impending move of Pinnacle leaving the market next quarter, the Memphis Office market was able to start the year on a positive note, posting nearly 67, SF
Legal Industry: Bigger No Longer Better
 MARKET REPORT DISTRICT OF COLUMBIA OFFICE First Quarter 2017 Legal Industry: Bigger No Longer Better After a strong end to 2016, leasing activity in the beginning of 2017 started with a whimper. Just two
The Improvement of the Industrial Market
 Research & Forecast Report Long Island industrial MARKET Q2 2015 The Improvement of the Industrial Market Rose Liu Research & Financial Analyst Long Island Takeaways The overall economy on Long Island
Research HOUSTON 1Q16 OFFICE MARKET. Current Conditions
 2016: A Wait-and-See Year In, Will they or won t they? has nothing to do with the Federal Reserve and interest rates and everything to do with OPEC s decision to potentially curb production. Observers